Download to read offline


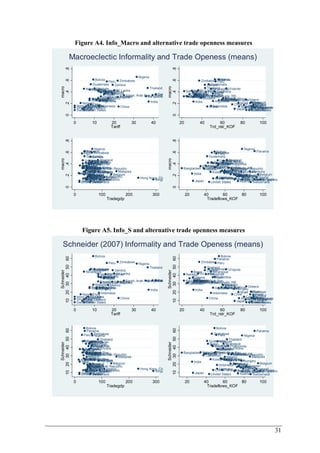
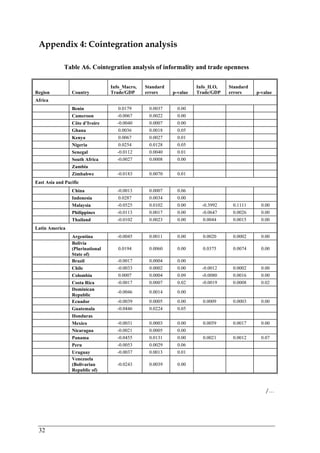


This document summarizes a study examining the relationship between trade liberalization and informality using three different data sets. The study finds mixed results. Cross-sectional correlations support trade liberalization reducing informality, but panel analyses do not. Cointegration analysis finds more openness associated with greater informal output and employment in most countries, while lower trade restrictions are linked to lower informality. Systems GMM estimation also yields contrasting results across data sets, with fewer restrictions tied to more informal output but less informal employment. The study provides comprehensive empirical evidence on this relationship using multiple measures of informality and econometric techniques for a large set of countries.


