This document provides an introduction and summary of the World Economic Forum's inaugural Financial Development Report 2008. It was published at a time of financial instability and uncertainty. The report aims to provide a holistic perspective on financial development by assessing countries' financial systems, examining the link between finance and economic growth, and discussing financial reforms. It incorporates input from academics, business and political leaders through the Forum's multistakeholder engagement process. The report includes the Financial Development Index, country profiles, data tables, and analysis to facilitate discussions on financial system strengths, priorities and reforms.


![Recent crises of the Western financial system
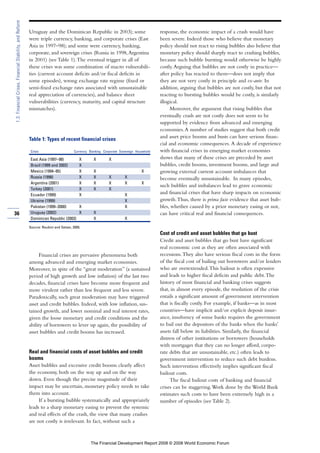
The decade from 1994 until 2003 was one of repeated
financial crises in emerging market economies: Mexico
in 1994;Thailand, Indonesia, Malaysia, and Korea in
1997–98, Russia in 1998; Brazil, Ecuador, Pakistan, and
Ukraine in 1999;Turkey and Argentina in 2001; and
Uruguay and the Dominican Republic in 2003.These
crises were caused by a combination of macroeconomic
weaknesses, policy mistakes, inappropriate exchange rate
policies, balance sheet vulnerabilities, poor corporate
governance, and weak and poorly supervised and regu-
lated financial systems.
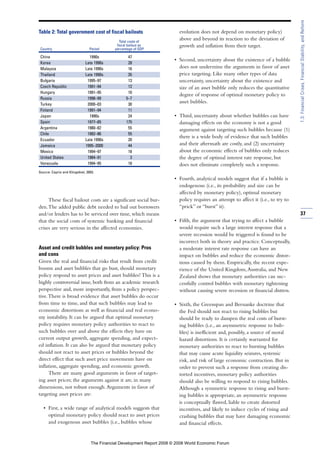
Although not every one of these financial crises
ended up in a systemic crisis of the banking or financial
system or the corporate system, many of them did.The
weaknesses in corporate governance, the emergence of
credit and asset bubbles, the poor supervision and regu-
lation of financial institutions, the distorted incentives
for financial institutions (in part because of moral hazard
distortions created by implicit and/or explicit govern-
ment bailout guarantees), and phenomena such as
directed and connected lending combined led to credit,
debt, and financial excesses that eventually triggered sys-
temic banking and corporate crises.
The resolution of these crises implied a variety of
policy actions, including structural reforms to make cor-
porate and financial systems less vulnerable and more
resilient as well as fundamental reforms of financial reg-
ulation and supervision.At the time of these crises, the
International Monetary Fund (IMF), the United States,
and the G7 countries were highly critical of the finan-
cial weaknesses—particularly the quality of institutions,
regulations, and governance—that had been triggering
factors in these crises.The fact that structural reforms in
the financial sector of these economies did occur—on
top of macro and policy changes—explains the high
growth rate of emerging market economies in the last
few years and their resilience, in spite of global shocks
that have hit advanced economies and their financial
markets in the last few years.
It is thus somehow ironic and paradoxical that,
while a decade ago (1997–98), the United States and
other G7 policymakers were lecturing East Asian and
other emerging market policymakers about the structur-
al weaknesses of their financial systems and prodding
them to implement structural reform, today the financial
turmoil and stress is at the core of the financial systems
of the most advanced economies and financial markets
in the world: those in the United States, in the United
Kingdom, and, to a smaller extent, in the euro zone.
The severe liquidity and credit crunch that started
with the housing bust and the collapse of the subprime
mortgage market in the United States revealed a much
larger credit and asset bubble and financial excesses of
leverage that went well beyond subprime mortgages.
Excessive debt accumulation and risky leverage occurred
in subprime mortgages, near prime mortgages, prime
mortgages, commercial real estate, the whole plethora of
securitized products associated with mortgages and
other asset-backed securities (ABSs), structured finance
products (mortgage-backed securities [MBSs], collateral-
ized debt obligations [CDOs], constant proportion debt
obligations [CPDOs], collateralized mortgage obligations
[CMOs], collateralized loan obligations [CLOs]), unse-
cured consumer credit (credit cards, auto loans, student
loans), leveraged loans financing excessively leveraged
leveraged buy-outs (LBOs), muni bonds, industrial and
commercial loans, junk corporate bonds, and credit
default swaps (CDSs).This credit house of cards began
to sway in 2007 and collapsed in 2008.The excesses
were not limited to the United States but extended to
other advanced economies; housing bubbles and credit
booms in consumer credit were widespread in the
United Kingdom, Spain, Ireland, and—in minor part—
other euro zone economies.The financial turmoil and
credit/liquidity crunch triggered by the subprime melt-
down revealed fundamental weaknesses in the operation
of advanced economies’ financial markets and in the sys-
tem of supervision and regulation of the financial sys-
tem, including banks and non-bank financial institu-
tions.
This crisis has led to the recognition that funda-
mental reforms of the regulation and supervision of the
financial systems of advanced economies are necessary in
a world of financial globalization.A plethora of propos-
als for reform have been advanced by a number of insti-
tutions: the Financial Stability Forum, the Fed, the US
Treasury, the G7, the FSA and other policy bodies in the
United Kingdom, the BIS, the IMF. It is clearly recog-
nized that the system of regulation and supervision of
financial institutions is in trouble and in need of serious
reform.
Which reforms are most appropriate? Instead of
considering the specific reforms suggested by individual
institutions and regulatory bodies, it makes sense to ana-
lyze the fundamental weaknesses, distortions, and open
issues in the advanced economies’ financial markets, and
thus what the appropriate principles for a new system of
regulation and supervision may be.The rest of this chap-
ter considers the most important issues related to reform
of the regulation and supervision of financial institutions
in a world of financial globalization.
Issues of reform in a world of financial globalization
Given the ongoing financial crisis in the United States
and parts of other advanced economies’ financial sys-
tems, the need for the appropriate reform of the system
of supervision and regulation of financial institutions has
become a core and urgent subject of debate among
scholars, market experts, and policymakers.
To understand what the appropriate system of regu-
lation and supervision of financial institutions may be in
a world of financial globalization, one needs to analyze
39
1.3:FinancialCrises,FinancialStability,andReform
The Financial Development Report 2008 © 2008 World Economic Forum](https://image.slidesharecdn.com/financial-development-report-2008-1233057524747939-3/85/Financial-Development-Report-2008-57-320.jpg)