Download to read offline


![Copyright © International Labour Organization 2011
First published (2011)
Publications of the International Labour Offi ce enjoy copyright under Protocol 2 of the Universal Copyright
Convention. Nevertheless, short excerpts from them may be reproduced without authorization, on condition that the
source is indicated. For rights of reproduction or translation, application should be made to the ILO Publications
(Rights and Permissions), International Labour Offi ce, CH–1211 Geneva 22, Switzerland, or by email: pubdroit@
ilo.org. The International Labour Offi ce welcomes such applications.
Libraries, institutions and other users registered in the United Kingdom with the Copyright Licensing Agency, 90
Tottenham Court Road, London W1T 4LP [Fax: (+44) (0)20 7631 5500; email: cla@cla.co.uk], in the United
States with the Copyright Clearance Center, 222 Rosewood Drive, Danvers, MA 01923 [Fax: (+1) (978) 750
4470; email: info@copyright.com] or in other countries with associated Reproduction Rights Organizations, may
make photocopies in accordance with the licences issued to them for this purpose.
Arandarenko, Mihail
Supporting strategies to recover from the crisis in South Eastern Europe: country assessment: Serbia / Mihail
Arandarenko ; International Labour Organization, Decent Work Technical Support Team and Country Offi ce for
Central and Eastern Europe. – Budapest: ILO, 2011
1 v.
ISBN: 9789221253884; 9789221253891 (web pdf)
International Labour Organization; ILO DWT and Country Offi ce for Central and Eastern Europe
employment / unemployment / informal employment / social protection / labour policy / economic recession /
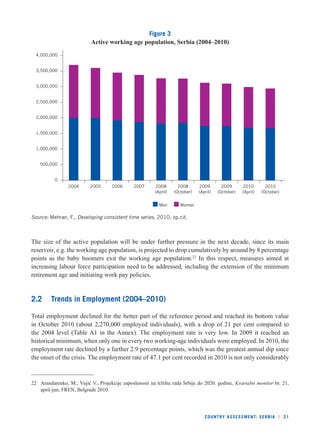
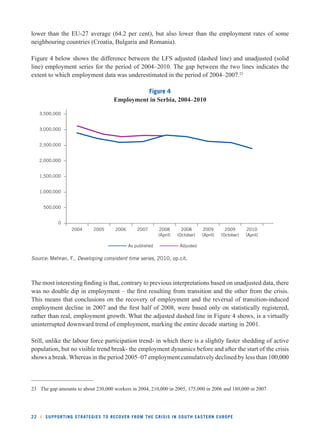
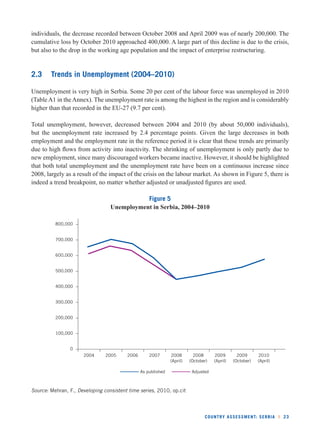
economic recovery / Serbia
13.01.3
Also available in Serbian: Pomoc´ne strategije za oporavak od krize u jugoistocˇnoj Evropi : Studijaprocene :
Srbija, ISBN: 9789228253887; 9789228253894 (web pdf), – Budapest: ILO, 2011
ILO Cataloguing in Publication Data
The designations employed in ILO publications, which are in conformity with United Nations practice, and
the presentation of material therein do not imply the expression of any opinion whatsoever on the part of the
International Labour Offi ce concerning the legal status of any country, area or territory or of its authorities, or
concerning the delimitation of its frontiers. The responsibility for opinions expressed in signed articles, studies
and other contributions rests solely with their authors, and publication does not constitute an endorsement by
the International Labour Offi ce of the opinions expressed in them. Reference to names of fi rms and commercial
products and processes does not imply their endorsement by the International Labour Offi ce, and any failure to
mention a particular fi rm, commercial product or process is not a sign of disapproval.
ILO publications can be obtained through major booksellers or ILO local offi ces in many countries, or direct
from ILO Publications, International Labour Offi ce, CH–1211 Geneva 22, Switzerland. Catalogues or lists of new
publications are available free of charge from the above address, or by email: pubvente@ ilo.org
Visit our website: www.ilo.org/publns](https://image.slidesharecdn.com/466524-141111161704-conversion-gate01/85/466524-4-320.jpg)


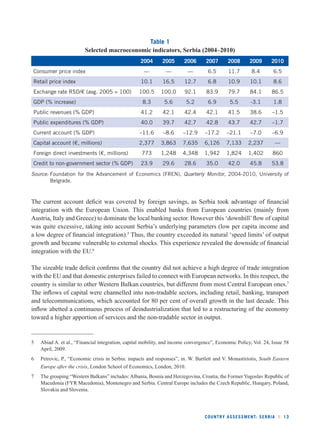

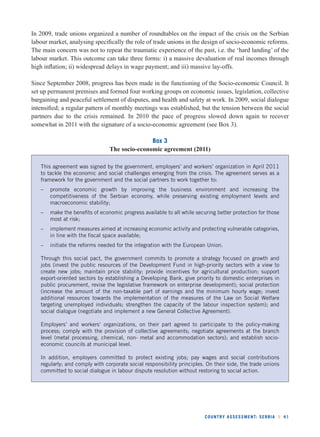


This document is a country assessment report on Serbia that examines the impact of the economic crisis and outlines policy responses. It finds that: 1) Serbia was significantly impacted by the global economic crisis, with real GDP declining by 3% in 2009, exports falling by 19%, and unemployment rising sharply. 2) The crisis led to major job losses and a rise in unemployment, hitting both formal and informal employment. Unemployment increased from 13.6% in 2008 to 16.1% in 2010, with long-term unemployment and youth unemployment particularly affected. 3) The government implemented stimulus policies including job retention schemes, public works programs, unemployment benefits, and tripartite social agreements between government, employers,


