This document analyzes economic growth and determining factors in Hungary and Ukraine. It finds that Central and Eastern Europe has not finished transition and is trending toward the Southern European periphery crisis. The authors introduce a new production function identifying bottlenecks as organizational and human capital not meeting needs of large companies. Both countries are postponing long-term investments like human capital due to present crisis, exacerbating issues.
The efforts to stabilize the Moldovan economy after the crisis of 1998 have been largely successful. The country avoided international default as current account position radically improved, cooperation with international financial institutions was re-established and a significant primary fiscal surplus was achieved. As a result, the exchange rate was stabilised and inflation substantially reduced. Moreover, several important structural reforms were implemented and privatisation of key-industries pursued with much more determination than previously. However, only economic growth would bring real solutions to the persistent problems of external and internal imbalances of the Moldovan economy and would allow the country to face its heavy debt burden in the future. Unfortunately, prospects for sustainable growth remain weak, as the most important issues that constrain private entrepreneurship and investments have not been effectively tackled. These issues include: lack of territorial integrity, ineffective legal system, widespread corruption and rent seeking. It is unlikely that these problems can be solved until the Moldovan parliament assumes full ownership of reform process.
Authored by: Larisa Lubarova, Oleg Petrushin, Artur Radziwill
Published in 2000
The paper first considers why central European countries wish to join EMU soon. The main reasons are the risk of macroeconomic instability they face outside the euro zone if they wish to grow quickly. At the same time, Central Europe is highly integrated as regards trade with EMU, so it is little exposed to asymmetric shocks that would require a realignment of exchange rates. Finally, it is argued that there is no cost in terms of slower growth from EMU accession, so that there is no trade-off, as has been claimed, between nominal convergence to EMU and real convergence to EU average GDP levels. Second, the paper assesses whether Central European accession to EMU would be disadvantageous to current members. It concludes that accession cannot increase inflationary pressure on existing EMU members, as has been claimed, but that slow growing members of EMU might suffer increased unemployment, unless they increase the flexibility of their labour markets. Incumbent members may also be unwilling to share power with Central Europeans in EMU institutions.
Authored by: Jacek Rostowski
Published in 2003
In 2011, the Belarusian ruble lost nearly 2/3 of its value. In December, the inflation rate approached 110% yoy. At the same time, the economy grew by 5.3% that year and continued with 3.6% yoy growth in January 2012. Is this a sign of economic recovery? Will it turn into sustainable growth? Or has the country exited from the crisis at all? To address these questions, CASE Fellow and Director of the IPM Research Centre in Minsk Alexander Chubrik looks at the roots of the 2011 crisis and compares them with the features of the long-lasting period of economic growth in Belarus.
Authored by: Alexander Chubrik
Published in 2012
Unlike the crisis years of 2007-2009 (when the insolvency of large banks was a major problem), the current round of the global financial crisis has fiscal origins. Almost all developed countries suffer from an excessive public debt burden that has been built up over the last two decades or more. The financial crisis caused a further deterioration of government accounts as a result of ill-tailored countercyclical fiscal response and, in some cases, a costly financial sector rescue. All excessively indebted countries must conduct fiscal adjustment, even if this involves economic and political costs in terms of lower output and higher unemployment. Central banks can reduce these costs through accommodative monetary policies but without compromising their anti-inflationary missions and institutional independence. The ECB is additionally constrained by its institutional status which is based on a delicate cross-country political consensus. Excessive ECB involvement in quasi-fiscal rescue operations can undermine this consensus and lead to a disintegration of the Eurozone. There are also strong arguments in favor of strengthening fiscal and banking integration within the EU, especially the fiscal discipline mechanism at national levels, and building the EU rescue capacity in respect to sovereigns and banks based on strong policy conditionality.
Authored by: Marek Dabrowski
Published in 2012
This year's SITE Energy Day was devoted to discussing the consequences of oil price fluctuations for markets and actors of the economy. The half-day conference engaged policy-oriented scholars and experts from the business community to discuss the impact of oil price fluctuations on macro fundamentals, international trade, strategies of oil cartels, strategic risk management, and opportunities for change in energy systems.
Torbjörn Becker, Director of SITE, gave a talk "The volatility of oil price forecasts and its macroeconomic implications"
For more information and research analysis please visit: www.hhs.se/site
Swedbank Economic Outlook - 2010, September 21Swedbank
Swedbank was founded in 1820, as Sweden’s first savings bank was established. Today, our heritage is visible in that we truly are a bank for each and every one and in that we still strive to contribute to a sustainable development of society and our environment. We are strongly committed to society as a whole and keen to help bring about a sustainable form of societal development. Our Swedish operations hold an ISO 14001 environmental certification, and environmental work is an integral part of our business activities.
This document analyzes Poland's economic convergence towards euro area levels before and after joining the EU in 2004. It finds that Poland experienced strong economic growth averaging higher than the euro area. This led to steady increases in GDP per capita and price levels converging towards euro area averages. Inflation was largely kept under control after adopting an inflation targeting policy. However, public finances suffered from chronic deficits, though public debt remained moderate. The economic crisis that began in 2008 impacted Poland through falling stock prices, a depreciating currency, and slowing credit and GDP growth. Political debates around adopting the euro were ongoing.
This paper reports the progress of nominal and real convergence of Spain, Portugal and Greece during their accession to the Economic and Monetary Union (EMU). When the EMU was designed, it was hoped that it would induce nominal convergence (convergence of interest rates and inflation rates) and stimulate investments and economic growth through its positive microeconomic effects. As had been expected, nominal interest rates have converged quite early during the accession, output has been growing fast, and the countries experienced an inflow of foreign direct investments (FDI) and an increase of domestic investment rates. However, once within the EMU, all three countries experienced persistently higher inflation rates, which may be consistent with the convergence of price levels, instead of inflation. While all the above phenomena can be related to the EMU accession, in an econometric estimation for Spain in which we control for macroeconomic policies, we are unable to detect significant microeconomic effects of the EMU. Therefore, we conclude that it is the policies induced by the necessity to satisfy the Maastricht criteria that matter primarily for the macroeconomic performance soon after accession. In any case, the experience of the SPG is encouraging for the new member states facing accession to the EMU in the future.
Authored by: Marek Jarocinski
Published in 2003
Russia's Lost Decade? Challenges to Growth, Recipes for AccelerationAndrey Shapenko
The Russian economy today is going through a critical stage. The growth model, which catapulted the country into the world’s top ten economies’ list has been exhausted and most experts believe that Russia is facing a long period of low or no growth. While the world is moving forward, Russia’s standing still. Hovering anxiously in one place means its economy is becoming smaller and is further increasing its competitive gap.
The ailing economy is often blamed on the falling oil prices combined with the economic sanctions that were imposed on Russia in 2014. However, the array of challenges that the economy is facing today is much broader than that, and the recession in Russia has deeper roots.
This report represents an attempt to discuss those roots and to summarize economic agenda that the country's leadership will face on the way to restart growth, amid the 2018 presidential elections. This agenda will define economic and fiscal policy over the next 5-10 years, and thus will impact anyone who is doing business or going to invest in the country.
This document provides an overview of Ukraine's economy and business climate, as well as its trade relations with the EU. It finds that while Ukraine has significant economic strengths in its large population, fertile farmland, and strategic location, its economy also faces weaknesses such as corruption, political instability, and an inefficient bureaucracy. The document examines Ukraine's trade with the EU and promising sectors for European investment such as agribusiness and biomass energy. It analyzes the potential for closer EU-Ukraine economic integration through a proposed Association Agreement, but also notes political risks from Ukraine's internal reforms and pressure from Russia.
Poland's economy is slowing after strong growth in recent years. GDP growth is expected to decline to 2.7% in 2012 from 4.3% in 2011 due to weaker global demand, lower investment, and rising unemployment. While Poland avoided recession in 2008-2009 due to fiscal stimulus and currency depreciation, continued reforms are needed to increase competitiveness through innovation, education, and reducing regional economic disparities. The eurozone crisis has allowed Poland to delay euro adoption plans, but it wants to still have influence over eurozone policies as its economy remains closely tied to Europe's.
Swedbank was founded in 1820, as Sweden’s first savings bank was established. Today, our heritage is visible in that we truly are a bank for each and every one and in that we still strive to contribute to a sustainable development of society and our environment. We are strongly committed to society as a whole and keen to help bring about a sustainable form of societal development. Our Swedish operations hold an ISO 14001 environmental certification, and environmental work is an integral part of our business activities.
1) Estonia has attracted the most foreign direct investment as a percentage of GDP from euro area countries and other Baltic states since adopting the euro.
2) Latvia and Lithuania saw large drops in FDI, mainly due to restructuring at Swedbank.
3) Adopting the euro is expected to help Latvia attract more foreign investment by increasing credibility, though responsible fiscal policy is also important.
This document is a paper analyzing inflation and monetary policy in Russia between 1992-2001. It seeks to identify the main factors driving inflation in Russia during this period through empirical testing and econometric analysis. The paper finds that money expansion and exchange rate depreciation fueled inflation, though the underlying trends changed over time. Until 1999, fiscal policy posed the biggest obstacle to disinflation, while later, attempts to target both money supply and exchange rate simultaneously through monetary policy caused inflationary pressures.
Russia - sharp slowdown and protacted recoverySwedbank
Swedbank was founded in 1820, as Sweden’s first savings bank was established. Today, our heritage is visible in that we truly are a bank for each and every one and in that we still strive to contribute to a sustainable development of society and our environment. We are strongly committed to society as a whole and keen to help bring about a sustainable form of societal development. Our Swedish operations hold an ISO 14001 environmental certification, and environmental work is an integral part of our business activities.
Chief Assistant Professor Dr. Ivan Krumov Todorov holds several degrees related to finance and economics. He currently works as a Chief Assistant Professor of Finance at the South-West University "Neofit Rilski" in Blagoevgrad, Bulgaria where he teaches various courses. His research focuses on macroeconomics, European economic integration, and convergence between EU member states and the euro area. He has published extensively in Bulgarian and international journals and participated in several research projects.
This paper discusses the processes of nominal and real convergence and their dependence on exchange rate regimes adopted in Central and Eastern European countries (CEECs) in thecontext of their future EMU accession. We focus our argument on the possibility of trade-off between the pace of disinflation and the maintenance of competitiveness and growth. Fixednominal exchange rate shifts the burden of adjustment on to the tradable sector but whether this pressure results in faster restructuring and faster productivity growth or becomes a straightjacket for the economy is an open question. The paper implements a simple empirical assessment of convergence of inflation to EU levels and economic growth of 7 CEE economies which had adopted different exchange rate regimes in period 1993-2002. Results indicate that fixed exchange rates seem to have been a better tool of fighting inflation as compared to floating exchange rates or intermediate regimes. The presence of a fixed exchange rate has also been characterised byhigher real GDP growth rates implying an absence of trade-off between nominal and real convergence in the investigated sample. Qualifications attached to these results are discussed.
Authored by: Przemyslaw Kowalski
Published in 2003
The paper studies labour developments in Moldova during transition period. The questions addressed are the size and character of labour market adjustment. Established data sources have been complemented by the results of available surveys to get more precise estimates of the effective employment. Wage data was adjusted for the stock of arrears. We conclude that adjustment to the new market order in Moldova has been done trough prices, which is similar to other FSU countries. Real wages, if adjusted for arrears, amount to only 14% of the pre-transition level. On the other hand, only small labour shedding is observed. Registered unemployment rate is one of the lowest in the FSU and CEE countries. Such way of adjustment has a number of negative consequences, the most important being the phenomenon of unpaid leaves. It appears, that only formal affiliation with enterprise remains, leaving those people effectively unemployed. Survey evidence report double-digit open unemployment rates, with widespread under-employment. With no system of unemployment benefits in place, a substantial number of labour force is involved in survival informal activities.
Authored by: Elena Jarocinska
Published in 2000
Swedbank was founded in 1820, as Sweden’s first savings bank was established. Today, our heritage is visible in that we truly are a bank for each and every one and in that we still strive to contribute to a sustainable development of society and our environment. We are strongly committed to society as a whole and keen to help bring about a sustainable form of societal development. Our Swedish operations hold an ISO 14001 environmental certification, and environmental work is an integral part of our business activities.
This dissertation thesis examines the impact of the debt crisis on the Visegrad economies of Central Europe. The author aims to analyze the causes and effects of the crisis through a comprehensive literature review and analysis of economic indicators. Several hypotheses are proposed regarding factors such as external influences, impacts on the real economy, exchange rates, interest rates, and foreign direct investment. The expected results will reveal changes in the financial sector, non-financial sector, and external sector behavior in the Visegrad countries. In conclusion, the findings will be discussed in the context of relevant economic theories to determine how well outcomes agree or disagree with theoretical frameworks.
Bank lending in Latvia increased in August, with business loans growing 0.8% month-over-month. Total bank loans expanded by 0.2% while decreasing annually by 6.6%. GDP grew by 0.9% quarter-over-quarter and 2.3% year-over-year in Q2, driven by private consumption and increases in investment, exports, and imports. Inflation was 1.0% in September.
Published by DESA’s Development Policy and Analysis Division, the September issue of the Monthly Briefing on the World Economic Situation and Prospects covers recent events affecting the world economy such as the connection between slowing growth in Europe and weaker exports from Asia. The recessionary environment in Europe is reducing growth prospects for some developing economies as it weakens demand for those economies’ exports. This has been felt most strongly in East and South Asia, where exports to the EU are down by 7.2 per cent year on year, and Western Asia (including Iran) where exports are down 18 per cent.
For more information: http://www.un.org/en/development/desa/policy/index.shtml
This document summarizes an eMarketer webinar on online holiday shopping trends for 2013. Key points include:
- US digital holiday sales are expected to grow in the mid-teens to 20% range, outpacing overall retail growth. Mobile commerce continues boosting online sales to new highs.
- In 2012, US holiday ecommerce sales reached $42.3 billion, up 14% from 2011, as mobile commerce increased significantly.
- For 2013, trends include the continued blurring of online and in-store shopping, more mobile tools for shoppers and sales associates, expanded fulfillment and delivery options, and social media playing a smaller role in direct sales.
This document outlines the terms and conditions for a competition called "Meet The Vamps" hosted by Blogmusik SAS between April 14-21, 2014 on Twitter. It specifies that the competition is open to UK and Ireland residents aged 16+, with one entry per person. The winner will receive a pair of tickets and meet & greet passes to a Vamps concert of their choice, as well as Vamps merchandise goodie bags. The terms also cover participant requirements, winner selection process, use of personal data, intellectual property rights, and dispute resolution.
El documento habla sobre los slots, que son elementos de una placa base que permiten conectar tarjetas adaptadoras o de expansión para realizar funciones de control de dispositivos periféricos. Explica qué es un slot, para qué sirve y menciona algunos tipos como XT, AGP, ISA, VESA y PCI.
Swedbank was founded in 1820, as Sweden’s first savings bank was established. Today, our heritage is visible in that we truly are a bank for each and every one and in that we still strive to contribute to a sustainable development of society and our environment. We are strongly committed to society as a whole and keen to help bring about a sustainable form of societal development. Our Swedish operations hold an ISO 14001 environmental certification, and environmental work is an integral part of our business activities.
This document analyzes Poland's economic convergence towards euro area levels before and after joining the EU in 2004. It finds that Poland experienced strong economic growth averaging higher than the euro area. This led to steady increases in GDP per capita and price levels converging towards euro area averages. Inflation was largely kept under control after adopting an inflation targeting policy. However, public finances suffered from chronic deficits, though public debt remained moderate. The economic crisis that began in 2008 impacted Poland through falling stock prices, a depreciating currency, and slowing credit and GDP growth. Political debates around adopting the euro were ongoing.
This paper reports the progress of nominal and real convergence of Spain, Portugal and Greece during their accession to the Economic and Monetary Union (EMU). When the EMU was designed, it was hoped that it would induce nominal convergence (convergence of interest rates and inflation rates) and stimulate investments and economic growth through its positive microeconomic effects. As had been expected, nominal interest rates have converged quite early during the accession, output has been growing fast, and the countries experienced an inflow of foreign direct investments (FDI) and an increase of domestic investment rates. However, once within the EMU, all three countries experienced persistently higher inflation rates, which may be consistent with the convergence of price levels, instead of inflation. While all the above phenomena can be related to the EMU accession, in an econometric estimation for Spain in which we control for macroeconomic policies, we are unable to detect significant microeconomic effects of the EMU. Therefore, we conclude that it is the policies induced by the necessity to satisfy the Maastricht criteria that matter primarily for the macroeconomic performance soon after accession. In any case, the experience of the SPG is encouraging for the new member states facing accession to the EMU in the future.
Authored by: Marek Jarocinski
Published in 2003
Russia's Lost Decade? Challenges to Growth, Recipes for AccelerationAndrey Shapenko
The Russian economy today is going through a critical stage. The growth model, which catapulted the country into the world’s top ten economies’ list has been exhausted and most experts believe that Russia is facing a long period of low or no growth. While the world is moving forward, Russia’s standing still. Hovering anxiously in one place means its economy is becoming smaller and is further increasing its competitive gap.
The ailing economy is often blamed on the falling oil prices combined with the economic sanctions that were imposed on Russia in 2014. However, the array of challenges that the economy is facing today is much broader than that, and the recession in Russia has deeper roots.
This report represents an attempt to discuss those roots and to summarize economic agenda that the country's leadership will face on the way to restart growth, amid the 2018 presidential elections. This agenda will define economic and fiscal policy over the next 5-10 years, and thus will impact anyone who is doing business or going to invest in the country.
This document provides an overview of Ukraine's economy and business climate, as well as its trade relations with the EU. It finds that while Ukraine has significant economic strengths in its large population, fertile farmland, and strategic location, its economy also faces weaknesses such as corruption, political instability, and an inefficient bureaucracy. The document examines Ukraine's trade with the EU and promising sectors for European investment such as agribusiness and biomass energy. It analyzes the potential for closer EU-Ukraine economic integration through a proposed Association Agreement, but also notes political risks from Ukraine's internal reforms and pressure from Russia.
Poland's economy is slowing after strong growth in recent years. GDP growth is expected to decline to 2.7% in 2012 from 4.3% in 2011 due to weaker global demand, lower investment, and rising unemployment. While Poland avoided recession in 2008-2009 due to fiscal stimulus and currency depreciation, continued reforms are needed to increase competitiveness through innovation, education, and reducing regional economic disparities. The eurozone crisis has allowed Poland to delay euro adoption plans, but it wants to still have influence over eurozone policies as its economy remains closely tied to Europe's.
Swedbank was founded in 1820, as Sweden’s first savings bank was established. Today, our heritage is visible in that we truly are a bank for each and every one and in that we still strive to contribute to a sustainable development of society and our environment. We are strongly committed to society as a whole and keen to help bring about a sustainable form of societal development. Our Swedish operations hold an ISO 14001 environmental certification, and environmental work is an integral part of our business activities.
1) Estonia has attracted the most foreign direct investment as a percentage of GDP from euro area countries and other Baltic states since adopting the euro.
2) Latvia and Lithuania saw large drops in FDI, mainly due to restructuring at Swedbank.
3) Adopting the euro is expected to help Latvia attract more foreign investment by increasing credibility, though responsible fiscal policy is also important.
This document is a paper analyzing inflation and monetary policy in Russia between 1992-2001. It seeks to identify the main factors driving inflation in Russia during this period through empirical testing and econometric analysis. The paper finds that money expansion and exchange rate depreciation fueled inflation, though the underlying trends changed over time. Until 1999, fiscal policy posed the biggest obstacle to disinflation, while later, attempts to target both money supply and exchange rate simultaneously through monetary policy caused inflationary pressures.
Russia - sharp slowdown and protacted recoverySwedbank
Swedbank was founded in 1820, as Sweden’s first savings bank was established. Today, our heritage is visible in that we truly are a bank for each and every one and in that we still strive to contribute to a sustainable development of society and our environment. We are strongly committed to society as a whole and keen to help bring about a sustainable form of societal development. Our Swedish operations hold an ISO 14001 environmental certification, and environmental work is an integral part of our business activities.
Chief Assistant Professor Dr. Ivan Krumov Todorov holds several degrees related to finance and economics. He currently works as a Chief Assistant Professor of Finance at the South-West University "Neofit Rilski" in Blagoevgrad, Bulgaria where he teaches various courses. His research focuses on macroeconomics, European economic integration, and convergence between EU member states and the euro area. He has published extensively in Bulgarian and international journals and participated in several research projects.
This paper discusses the processes of nominal and real convergence and their dependence on exchange rate regimes adopted in Central and Eastern European countries (CEECs) in thecontext of their future EMU accession. We focus our argument on the possibility of trade-off between the pace of disinflation and the maintenance of competitiveness and growth. Fixednominal exchange rate shifts the burden of adjustment on to the tradable sector but whether this pressure results in faster restructuring and faster productivity growth or becomes a straightjacket for the economy is an open question. The paper implements a simple empirical assessment of convergence of inflation to EU levels and economic growth of 7 CEE economies which had adopted different exchange rate regimes in period 1993-2002. Results indicate that fixed exchange rates seem to have been a better tool of fighting inflation as compared to floating exchange rates or intermediate regimes. The presence of a fixed exchange rate has also been characterised byhigher real GDP growth rates implying an absence of trade-off between nominal and real convergence in the investigated sample. Qualifications attached to these results are discussed.
Authored by: Przemyslaw Kowalski
Published in 2003
The paper studies labour developments in Moldova during transition period. The questions addressed are the size and character of labour market adjustment. Established data sources have been complemented by the results of available surveys to get more precise estimates of the effective employment. Wage data was adjusted for the stock of arrears. We conclude that adjustment to the new market order in Moldova has been done trough prices, which is similar to other FSU countries. Real wages, if adjusted for arrears, amount to only 14% of the pre-transition level. On the other hand, only small labour shedding is observed. Registered unemployment rate is one of the lowest in the FSU and CEE countries. Such way of adjustment has a number of negative consequences, the most important being the phenomenon of unpaid leaves. It appears, that only formal affiliation with enterprise remains, leaving those people effectively unemployed. Survey evidence report double-digit open unemployment rates, with widespread under-employment. With no system of unemployment benefits in place, a substantial number of labour force is involved in survival informal activities.
Authored by: Elena Jarocinska
Published in 2000
Swedbank was founded in 1820, as Sweden’s first savings bank was established. Today, our heritage is visible in that we truly are a bank for each and every one and in that we still strive to contribute to a sustainable development of society and our environment. We are strongly committed to society as a whole and keen to help bring about a sustainable form of societal development. Our Swedish operations hold an ISO 14001 environmental certification, and environmental work is an integral part of our business activities.
This dissertation thesis examines the impact of the debt crisis on the Visegrad economies of Central Europe. The author aims to analyze the causes and effects of the crisis through a comprehensive literature review and analysis of economic indicators. Several hypotheses are proposed regarding factors such as external influences, impacts on the real economy, exchange rates, interest rates, and foreign direct investment. The expected results will reveal changes in the financial sector, non-financial sector, and external sector behavior in the Visegrad countries. In conclusion, the findings will be discussed in the context of relevant economic theories to determine how well outcomes agree or disagree with theoretical frameworks.
Bank lending in Latvia increased in August, with business loans growing 0.8% month-over-month. Total bank loans expanded by 0.2% while decreasing annually by 6.6%. GDP grew by 0.9% quarter-over-quarter and 2.3% year-over-year in Q2, driven by private consumption and increases in investment, exports, and imports. Inflation was 1.0% in September.
Published by DESA’s Development Policy and Analysis Division, the September issue of the Monthly Briefing on the World Economic Situation and Prospects covers recent events affecting the world economy such as the connection between slowing growth in Europe and weaker exports from Asia. The recessionary environment in Europe is reducing growth prospects for some developing economies as it weakens demand for those economies’ exports. This has been felt most strongly in East and South Asia, where exports to the EU are down by 7.2 per cent year on year, and Western Asia (including Iran) where exports are down 18 per cent.
For more information: http://www.un.org/en/development/desa/policy/index.shtml
This document summarizes an eMarketer webinar on online holiday shopping trends for 2013. Key points include:
- US digital holiday sales are expected to grow in the mid-teens to 20% range, outpacing overall retail growth. Mobile commerce continues boosting online sales to new highs.
- In 2012, US holiday ecommerce sales reached $42.3 billion, up 14% from 2011, as mobile commerce increased significantly.
- For 2013, trends include the continued blurring of online and in-store shopping, more mobile tools for shoppers and sales associates, expanded fulfillment and delivery options, and social media playing a smaller role in direct sales.
This document outlines the terms and conditions for a competition called "Meet The Vamps" hosted by Blogmusik SAS between April 14-21, 2014 on Twitter. It specifies that the competition is open to UK and Ireland residents aged 16+, with one entry per person. The winner will receive a pair of tickets and meet & greet passes to a Vamps concert of their choice, as well as Vamps merchandise goodie bags. The terms also cover participant requirements, winner selection process, use of personal data, intellectual property rights, and dispute resolution.
El documento habla sobre los slots, que son elementos de una placa base que permiten conectar tarjetas adaptadoras o de expansión para realizar funciones de control de dispositivos periféricos. Explica qué es un slot, para qué sirve y menciona algunos tipos como XT, AGP, ISA, VESA y PCI.
Sam was a koala who was rescued from devastating bushfires by volunteer firefighter David Tree. Sam suffered second and third degree burns on her paws but received treatment and bandages at a wildlife shelter. At the shelter, Sam met another koala named Bob who was also injured in the fires. Sam and Bob formed a bond during their recovery and are seen comforting each other, showing the hope for survival after such destruction.
The document outlines a roadmap to transform a property and casualty insurer's direct marketing strategy from a mass mailing approach focused on call center volume to a more data-driven and targeted strategy. It details challenges around expertise, data access, and key performance indicators. The proposed strategy focuses on building analytics capabilities, testing creative concepts, and optimizing mailings based on customer value. Key metrics like response rates, revenue, and cost per acquisition are improved. The client is able to grow their direct business significantly while lowering marketing costs over a two year period.
This document describes a marketing product called TrafficTickets that is designed to drive consumer traffic to retail locations. TrafficTickets are game pieces distributed to consumers that direct them to come to a retailer's point-of-sale display to see what prize they have won. This increases foot traffic and sales. Response rates for TrafficTickets campaigns range from 2-35% depending on the industry, much higher than other promotional tactics. The product can be used for various applications and is a turnkey service that includes premiums, production, distribution, and fulfillment. Pricing is customized based on the details of each individual campaign. Examples of successful TrafficTickets programs for retailers, banks, and automotive companies are provided that significantly
Pictures i took for my magazine front cover and contents pageAshleighWood2
I took pictures for the front cover and contents page of a magazine. The pictures will be used on the front cover and contents page to showcase what stories and articles are included in the upcoming issue. My photos were commissioned to help promote and advertise the magazine's new issue.
Jack is a Primary 6 student who has superpowers related to words. He can read very quickly and has an extensive vocabulary. Despite his young age, he fights crime using his word-related abilities (synonyms: exceptional, remarkable, outstanding).
Music videos use various techniques to reinforce the song's meaning, genre, and mood. Editing, lyrics, mise-en-scene, and camerawork all reflect the tempo, feeling, and genre of the music. Close-ups are common to personalize songs for audiences and draw them into relating to the lyrics. Digital effects and varied editing, like fast cuts or character blending, also enhance videos and offer different pleasures for viewers.
This document discusses moving from valuing diversity to achieving cultural competence. It defines key terms like diversity, inclusion, and competence. Developing cultural competence is a process that involves awareness, understanding, and action. Organizations can build competence by establishing diversity missions and developing employees' skills in areas like communication and decision-making across different cultures. The goal is for management practices and individual competencies to effectively address diversity.
Francisco Estrada 2013
El estado de Missouri ha creado un sistema de justicia juvenil que ha tenido tanto éxito en los últimos 30 años que se ha conocido como el "Milagro de Missouri.“”
Lo constituyen una serie de prácticas que se combinan para hacer único el sistema de Missouri :
Se compone sobre todo de pequeñas instalaciones, en general diseñadas para entre 10 y 30 jóvenes, cerca de los hogares de los jóvenes.
Estas instalaciones no se parecen a las cárceles con las celdas tradicionales; sólo hay ocho celdas de aislamiento en todo el estado, que se utilizan raramente y sólo en situaciones de emergencia
http://justiciapenaladolescente.blogspot.com/
Material del Diplomado en Intervenciones especializadas con adolescentes infractores de ley penal. 2013
Universidad de Chile
This document discusses different types of sound symbolism in language. Sound symbolism refers to words that attempt to convey meaning through mimicry of sounds. There are several types of sound symbolism, including onomatopoeia which imitates sounds, clustering where words with similar sounds tend to have related meanings, and iconism where variations in sounds can change the meaning of words with the same referent. The document also describes the work of Margaret Magnus who wrote a book explaining these different types of phonosemantics or sound symbolism to lay readers.
Mercury Interactive's WinRunner is an automated testing tool that:
1. Records user interactions to generate test scripts in a programming language.
2. Plays back tests to emulate user interactions and compare results to expectations.
3. Provides reports on test runs and tools to debug and maintain tests for evolving applications.
This document discusses several topics related to ethical confusion and dilemmas in society. It begins by describing social norms in ancient India that are now considered unacceptable, like certain sexual practices and the concept of devadasis. It then discusses determinants of individual ethics and provides examples of racism faced by Indians abroad. It analyzes the Maruti factory violence case from the perspectives of both management and workers. It also discusses the issues around rape cases in India from the perspectives of punishment, media intervention, and the conservative nature of society. Throughout, it highlights the confusion that can arise from conflicting value systems between different groups and the challenges of reconciling ethics with customs, authority, and standards of living. For managers, it questions how to reform un
Sandro Botticelli was an Italian painter during the Early Renaissance. He was born in 1445 in Florence, Italy and apprenticed under goldsmith and painter Filippo Lippi. Botticelli was influenced by Lippi's use of color and developed his own tender style. He gained popularity painting works for the influential Medici family. Later in life, Botticelli fell under the influence of Dominican preacher Savonarola and destroyed many of his own paintings. He died in 1510 at age 65 in Florence.
This document provides guidance on planning and delivering effective presentations. It discusses establishing a clear purpose and understanding your audience. Tips are provided on structuring the presentation, including introducing the topic, signposting between sections, and concluding. Guidance is given on using visual aids, handling questions, and reducing content to PowerPoint slides while practicing delivery. The goal is to help presenters connect with their audience and communicate their message confidently.
Done by Doha_Smart_7 from Doha School
Composites are materials made from two or more constituent materials with significantly different physical or chemical properties, that when combined, produce a material with characteristics different from the individual components.
The Project consist of making insulating system for home used water tanks using composite materials in order to preserve the water cooler at hot seasons.
The combination of wood and foam layers plus a reflecting aluminum layer constitute a powerful insulating system preserving cool water in summer time and even preserve the sun heat during winter by removing the upper layer.
This paper draws on the experience of emerging Europe and argues that foreign capital is an enviable development opportunity with tail risks. Financial integration and foreign savings supported growth in the EU12 and EU candidate countries. We argue that this was possible because of EU membership (actual or potential) and its role as an anchor for expectations. In contrast, the eastern partnership states did not benefit from the foreign savings-growth link. But financial integration also led to a buildup of vulnerabilities and now exposes emerging Europe to prolonged uncertainty and financial deleveraging due to eurozone developments. Nonetheless, we believe that external imbalances should not be eradicated—nor should emerging Europe pursue a policy of self-insurance. Instead, what we refer to as an acyclical fiscal policy stance could serve to counterbalance private sector behavior. Going forward, a more proactive macroprudential policy will also be needed to limit financial system vulnerabilities when external imbalances are large.
This paper build on work presented in a World Bank report titled “Golden Growth: Restoring the Lustre of the European Economic Model” (2012) and on Juan Zalduendo’s presentation on “Financial integration. Lessons from CEE and SEE” delivered at the CASE 2011 International Conference on “Europe 2020: Exploring the Future of European Integration” held in Falenty near Warsaw, November 18-19, 2011.
Authored by: Aleksandra Iwulska, Naotaka Sugawara, Juan Zalduendo
Published in 2012
Emerging market economies were major beneficiaries of the economic boom before 2007. More recently, they have become victims of the global financial crisis. Their future development depends, to a large extent, on global economic prospects. Today the global economy and the European economy are much more integrated and interdependent than they were ten or twenty years ago. Every country must recognize its limited economic sovereignty and must be prepared to deal with the consequences of global macroeconomic fluctuations.
The statistical data for 2009 provides a mixed picture with respect to the impact of the crisison various groups of countries and individual economies. On average, Central and Eastern Europe experienced a smaller output decline than the Euro area and the entire EU while the CIS, especially its European part, contracted more dramatically. However, there was a deep differentiation within each country group. Looking globally, richer countries, which are more open to trade and in which the banking sector plays a larger role and which rely more on external financing, suffered more than less sophisticated economies, which are less dependent on trade and credit (especially from external sources). With some exceptions, the previous good growth performance helped rather than handicapped countries in the CEE and CIS regions in the crisis year of 2009.
The post-crisis recovery has been rather modest and incomplete. It remains vulnerable to new shocks (like the Greek Fiscal crisis), the danger of sovereign default and other uncertainties. Full post-crisis recovery and increasing potential growth will require far going economic and institutional reforms on both national, regional (e.g., EU) and global levels.
Authored by: Marek Dąbrowski
Published in 2010
1) If the EU did not exist, European countries would face greater economic instability without the euro as a common currency. There would be more volatility in exchange rates and prices, exacerbating the crisis in weaker economies.
2) Without EU coordination of responses, countries would be less willing to help troubled banks and firms for fear of revealing weaknesses. This could prolong and deepen the crisis.
3) A lack of cooperation could also increase protectionism as countries act solely in their own interests rather than working together.
The document discusses Europe's fragmented bond markets, which have become more divided during the euro crisis. Government bond yields have varied widely between member states, making fiscal adjustment difficult for countries with high borrowing costs and slowing economic growth. While market differentiation pressures fiscal discipline, the current level of variance is unsustainable. Integrating Europe's bond markets into a large, unified market could help overcome difficulties by creating more liquidity and lowering interest rates, but this cannot undermine budget constraints for highly indebted countries.
This paper discusses the global financial crisis of 2008/9 in thirteen countries, the ten new EU members that previously were communist and the three countries of Western former Soviet Union. Their problems were excessive current account deficits and private foreign debt, currency mismatches, and high inflation, while public finances were in good shape. The dominant cause was fixed exchange rates. Many lessons can be drawn from this crisis. A dollar peg makes no sense in this part of the world. The five currency boards in the region have lacked credibility. By contrast, inflation targeting has worked eminently. The euro has proven credible both in the countries that officially adopted it and in the countries that adopted it unilaterally. With the exception of Hungary, all the countries in the region have displayed decent fiscal policies. No government should accept large domestic loans in foreign currency and they can be regulated away. The IMF has successfully returned to the original Washington consensus with relatively few conditions: a reasonable budget balance and a realistic exchange rate policy, while focusing more on bank restructuring. The most controversial issue is the role of the ECB. The ECB should facilitate the accession of willing EU members to the euro by relaxing the ERM II conditions.
Authored by: Anders Aslund
Published in 2009
The document discusses the impact of the US economic crisis on the European economy. It provides background on the US subprime crisis and how US subprime loans were bundled and sold globally, including to European investors. It then examines how the crisis has impacted Europe through tightened credit standards, falling economic sentiment indicators, and recession in Eastern European economies that had taken on significant foreign debt. Eurozone statistics show rising unemployment, declining GDP growth forecasts, and falling industrial production prices.
Twenty years of euro history confirms the euro’s stability and position as the second global currency. It also enjoys the support of majority of the euro area population and is seen as a good thing for the European Union. The European Central Bank has been successful in keeping inflation at a low level. However, the European debt and financial crisis in the 2010s created a need for deep institutional reform and this task remains unfinished.
The paper examines economic and political challenges of joining the euro area in the case of Poland. After reviewing the economic developments since the pre-accession period and assessing economic convergence with the euro area the paper focuses on the political and institutional challenges of acceding to the euro zone. Special attention is given to the effect of the crisis triggered by the collapse of Lehman brothers in September 2008 on both political and economic dynamics of the process. The developments in parameters related to the economic and legal criteria for joining the euro area are scrutinized in detail during the entire period before and after the crisis. The paper is concluded with the review of the status quo in mid-2010 as well as summary and recommendations.
Authored by: Przemsilaw Wozniak
Published in 2010
The UN/DESA Expert Group Meeting on the World Economy (Project LINK) was held in New York on 24-26 October. The agenda of the meeting included three broad items: (1) Economic outlook for the world economy in 2012-2013, (2) Major macroeconomic policy issues, and (3) Econometric modelling. The LINK Global Economic Outlook summarizes the forecasts for the world economy in 2012-2013. Also available are the LINK Country Reports which contain detailed country forecasts and policy analyses.
The document provides an economic outlook for retailers globally. It discusses the slowdown in major economies due to the European debt crisis dragging down demand. While the US economy is expected to accelerate in 2013 if fiscal issues are resolved, growth remains tied to uncertainties in Europe. China has slowed but avoided a hard landing through stimulus. Long-term, China faces challenges of rebalancing its economy away from investment and managing demographic shifts. The outlook for retailers will be influenced by continued consumer spending in the US but greater dependence on exports and emerging markets globally going forward.
The document summarizes key findings from the 2011 Transition Report on the impact of the global financial crisis in transition economies. It finds that:
1) While most transition economies returned to growth in 2011, the recovery is fragile and unemployment remains high. The crisis negatively impacted many people's individual situations and lowered support for democracy and markets in some countries.
2) Households in transition economies were hit much harder by the crisis than those in Western Europe, often having to cut consumption of necessities like food. Formal social safety nets were less effective, and pre-crisis borrowing left some vulnerable.
3) The crisis reduced support for markets and democracy in new EU countries but increased it in CIS countries by turning
This document provides an overview of macroeconomic trends and business investment in Europe. It discusses how the recovery is gaining traction across most European economies, but challenges remain like low inflation and lack of credit for small businesses. While austerity has hampered growth, the ECB has implemented stimulus measures to boost lending and exports. Individual countries also need structural reforms. Europe remains attractive for business due to political stability, open trade policies, and a skilled workforce, though emerging markets present more opportunities for growth.
The document provides updates on economic recovery efforts in several EU member states. It discusses signs of recovery in Austria through declining unemployment, but notes high numbers still in job retraining programs. Belgium's central bank raised growth and inflation forecasts but debt is projected to exceed 100% of GDP. Bulgaria may face IMF demands for spending cuts if it seeks aid. Cyprus received positive reviews but was placed under excessive deficit monitoring by the EU.
Crisis and Trust in National and European Union institutions – Panel evidence...Wikiprogress_slides
Presentation by Felix Roth at the OECD Workshop on “Joint Learning for an OECD Trust Strategy” on 14 October 2013. Dr. Roth discusses the consequences of citizens declining trust and the driving factors of declining trust in Europe. He also provides an econometric analysis of trust and unemployment.
Since the publication in July of stress test for banks in Europe, everything went quiet on the PIGS debt crisis with no much news during the summer. Things however are boiling again and Greek will come back to the forefront of medias sooner rather than later.
European leaders could be forgiven for feeling they are being besieged from all angles.
From the East, tensions with Russia over Ukraine have echoes of the Cold War, dampening business growth hopes in neighbouring economies and highlighting reliance on Russian natural resources.
Europe is facing multiple challenges from within and outside its borders that are impacting its economic outlook. However, the region has made significant economic progress over the past year. Many economies that were hardest hit by the sovereign debt crisis like Ireland and Spain are seeing robust growth, while the EU and eurozone as a whole posted acceleration in GDP growth in 2014. Business confidence in Europe has also risen above global levels for the first time in years due to improved growth prospects and ECB action. Nonetheless, high unemployment, debt burdens, and geopolitical tensions continue to pose threats to European stability and growth.
The document discusses the state of European economies in January 2009 and August 2010. It summarizes that the European Commission raised its 2010 GDP growth forecasts for the EU and eurozone to 1.8% and 1.7% respectively, driven by strong export growth in Germany. However, growth is expected to slow in the second half of the year as the global economy hits a soft patch. Unemployment rates remain elevated across Europe.
De acuerdo con el último informe difundido por Crédito y Caución, las insolvencias de muchas de las economías europeas se mantendrán muy por encima de los niveles de 2007 en 2014 y 2015.
El panorama económico mundial se ha deteriorado en los últimos seis meses. El ritmo de crecimiento en la zona euro y China ha sido más débil de lo esperado y la intensificación de la crisis geopolíticas referentes a Rusia y al Estado Islámico en Oriente Medio han minado la confianza internacional.
Abnormalities of hormones and inflammatory cytokines in women affected with p...Alexander Decker
Women with polycystic ovary syndrome (PCOS) have elevated levels of hormones like luteinizing hormone and testosterone, as well as higher levels of insulin and insulin resistance compared to healthy women. They also have increased levels of inflammatory markers like C-reactive protein, interleukin-6, and leptin. This study found these abnormalities in the hormones and inflammatory cytokines of women with PCOS ages 23-40, indicating that hormone imbalances associated with insulin resistance and elevated inflammatory markers may worsen infertility in women with PCOS.
A usability evaluation framework for b2 c e commerce websitesAlexander Decker
This document presents a framework for evaluating the usability of B2C e-commerce websites. It involves user testing methods like usability testing and interviews to identify usability problems in areas like navigation, design, purchasing processes, and customer service. The framework specifies goals for the evaluation, determines which website aspects to evaluate, and identifies target users. It then describes collecting data through user testing and analyzing the results to identify usability problems and suggest improvements.
A universal model for managing the marketing executives in nigerian banksAlexander Decker
This document discusses a study that aimed to synthesize motivation theories into a universal model for managing marketing executives in Nigerian banks. The study was guided by Maslow and McGregor's theories. A sample of 303 marketing executives was used. The results showed that managers will be most effective at motivating marketing executives if they consider individual needs and create challenging but attainable goals. The emerged model suggests managers should provide job satisfaction by tailoring assignments to abilities and monitoring performance with feedback. This addresses confusion faced by Nigerian bank managers in determining effective motivation strategies.
A unique common fixed point theorems in generalized dAlexander Decker
This document presents definitions and properties related to generalized D*-metric spaces and establishes some common fixed point theorems for contractive type mappings in these spaces. It begins by introducing D*-metric spaces and generalized D*-metric spaces, defines concepts like convergence and Cauchy sequences. It presents lemmas showing the uniqueness of limits in these spaces and the equivalence of different definitions of convergence. The goal of the paper is then stated as obtaining a unique common fixed point theorem for generalized D*-metric spaces.
A trends of salmonella and antibiotic resistanceAlexander Decker
This document provides a review of trends in Salmonella and antibiotic resistance. It begins with an introduction to Salmonella as a facultative anaerobe that causes nontyphoidal salmonellosis. The emergence of antimicrobial-resistant Salmonella is then discussed. The document proceeds to cover the historical perspective and classification of Salmonella, definitions of antimicrobials and antibiotic resistance, and mechanisms of antibiotic resistance in Salmonella including modification or destruction of antimicrobial agents, efflux pumps, modification of antibiotic targets, and decreased membrane permeability. Specific resistance mechanisms are discussed for several classes of antimicrobials.
A transformational generative approach towards understanding al-istifhamAlexander Decker
This document discusses a transformational-generative approach to understanding Al-Istifham, which refers to interrogative sentences in Arabic. It begins with an introduction to the origin and development of Arabic grammar. The paper then explains the theoretical framework of transformational-generative grammar that is used. Basic linguistic concepts and terms related to Arabic grammar are defined. The document analyzes how interrogative sentences in Arabic can be derived and transformed via tools from transformational-generative grammar, categorizing Al-Istifham into linguistic and literary questions.
A time series analysis of the determinants of savings in namibiaAlexander Decker
This document summarizes a study on the determinants of savings in Namibia from 1991 to 2012. It reviews previous literature on savings determinants in developing countries. The study uses time series analysis including unit root tests, cointegration, and error correction models to analyze the relationship between savings and variables like income, inflation, population growth, deposit rates, and financial deepening in Namibia. The results found inflation and income have a positive impact on savings, while population growth negatively impacts savings. Deposit rates and financial deepening were found to have no significant impact. The study reinforces previous work and emphasizes the importance of improving income levels to achieve higher savings rates in Namibia.
A therapy for physical and mental fitness of school childrenAlexander Decker
This document summarizes a study on the importance of exercise in maintaining physical and mental fitness for school children. It discusses how physical and mental fitness are developed through participation in regular physical exercises and cannot be achieved solely through classroom learning. The document outlines different types and components of fitness and argues that developing fitness should be a key objective of education systems. It recommends that schools ensure pupils engage in graded physical activities and exercises to support their overall development.
A theory of efficiency for managing the marketing executives in nigerian banksAlexander Decker
This document summarizes a study examining efficiency in managing marketing executives in Nigerian banks. The study was examined through the lenses of Kaizen theory (continuous improvement) and efficiency theory. A survey of 303 marketing executives from Nigerian banks found that management plays a key role in identifying and implementing efficiency improvements. The document recommends adopting a "3H grand strategy" to improve the heads, hearts, and hands of management and marketing executives by enhancing their knowledge, attitudes, and tools.
This document discusses evaluating the link budget for effective 900MHz GSM communication. It describes the basic parameters needed for a high-level link budget calculation, including transmitter power, antenna gains, path loss, and propagation models. Common propagation models for 900MHz that are described include Okumura model for urban areas and Hata model for urban, suburban, and open areas. Rain attenuation is also incorporated using the updated ITU model to improve communication during rainfall.
A synthetic review of contraceptive supplies in punjabAlexander Decker
This document discusses contraceptive use in Punjab, Pakistan. It begins by providing background on the benefits of family planning and contraceptive use for maternal and child health. It then analyzes contraceptive commodity data from Punjab, finding that use is still low despite efforts to improve access. The document concludes by emphasizing the need for strategies to bridge gaps and meet the unmet need for effective and affordable contraceptive methods and supplies in Punjab in order to improve health outcomes.
A synthesis of taylor’s and fayol’s management approaches for managing market...Alexander Decker
1) The document discusses synthesizing Taylor's scientific management approach and Fayol's process management approach to identify an effective way to manage marketing executives in Nigerian banks.
2) It reviews Taylor's emphasis on efficiency and breaking tasks into small parts, and Fayol's focus on developing general management principles.
3) The study administered a survey to 303 marketing executives in Nigerian banks to test if combining elements of Taylor and Fayol's approaches would help manage their performance through clear roles, accountability, and motivation. Statistical analysis supported combining the two approaches.
A survey paper on sequence pattern mining with incrementalAlexander Decker
This document summarizes four algorithms for sequential pattern mining: GSP, ISM, FreeSpan, and PrefixSpan. GSP is an Apriori-based algorithm that incorporates time constraints. ISM extends SPADE to incrementally update patterns after database changes. FreeSpan uses frequent items to recursively project databases and grow subsequences. PrefixSpan also uses projection but claims to not require candidate generation. It recursively projects databases based on short prefix patterns. The document concludes by stating the goal was to find an efficient scheme for extracting sequential patterns from transactional datasets.
A survey on live virtual machine migrations and its techniquesAlexander Decker
This document summarizes several techniques for live virtual machine migration in cloud computing. It discusses works that have proposed affinity-aware migration models to improve resource utilization, energy efficient migration approaches using storage migration and live VM migration, and a dynamic consolidation technique using migration control to avoid unnecessary migrations. The document also summarizes works that have designed methods to minimize migration downtime and network traffic, proposed a resource reservation framework for efficient migration of multiple VMs, and addressed real-time issues in live migration. Finally, it provides a table summarizing the techniques, tools used, and potential future work or gaps identified for each discussed work.
A survey on data mining and analysis in hadoop and mongo dbAlexander Decker
This document discusses data mining of big data using Hadoop and MongoDB. It provides an overview of Hadoop and MongoDB and their uses in big data analysis. Specifically, it proposes using Hadoop for distributed processing and MongoDB for data storage and input. The document reviews several related works that discuss big data analysis using these tools, as well as their capabilities for scalable data storage and mining. It aims to improve computational time and fault tolerance for big data analysis by mining data stored in Hadoop using MongoDB and MapReduce.
1. The document discusses several challenges for integrating media with cloud computing including media content convergence, scalability and expandability, finding appropriate applications, and reliability.
2. Media content convergence challenges include dealing with the heterogeneity of media types, services, networks, devices, and quality of service requirements as well as integrating technologies used by media providers and consumers.
3. Scalability and expandability challenges involve adapting to the increasing volume of media content and being able to support new media formats and outlets over time.
This document surveys trust architectures that leverage provenance in wireless sensor networks. It begins with background on provenance, which refers to the documented history or derivation of data. Provenance can be used to assess trust by providing metadata about how data was processed. The document then discusses challenges for using provenance to establish trust in wireless sensor networks, which have constraints on energy and computation. Finally, it provides background on trust, which is the subjective probability that a node will behave dependably. Trust architectures need to be lightweight to account for the constraints of wireless sensor networks.
This document discusses private equity investments in Kenya. It provides background on private equity and discusses trends in various regions. The objectives of the study discussed are to establish the extent of private equity adoption in Kenya, identify common forms of private equity utilized, and determine typical exit strategies. Private equity can involve venture capital, leveraged buyouts, or mezzanine financing. Exits allow recycling of capital into new opportunities. The document provides context on private equity globally and in developing markets like Africa to frame the goals of the study.
This document discusses a study that analyzes the financial health of the Indian logistics industry from 2005-2012 using Altman's Z-score model. The study finds that the average Z-score for selected logistics firms was in the healthy to very healthy range during the study period. The average Z-score increased from 2006 to 2010 when the Indian economy was hit by the global recession, indicating the overall performance of the Indian logistics industry was good. The document reviews previous literature on measuring financial performance and distress using ratios and Z-scores, and outlines the objectives and methodology used in the current study.
SATTA MATKA DPBOSS KALYAN MATKA RESULTS KALYAN CHART KALYAN MATKA MATKA RESULT KALYAN MATKA TIPS SATTA MATKA MATKA COM MATKA PANA JODI TODAY BATTA SATKA MATKA PATTI JODI NUMBER MATKA RESULTS MATKA CHART MATKA JODI SATTA COM INDIA SATTA MATKA MATKA TIPS MATKA WAPKA ALL MATKA RESULT LIVE ONLINE MATKA RESULT KALYAN MATKA RESULT DPBOSS MATKA 143 MAIN MATKA KALYAN MATKA RESULTS KALYAN CHART
KALYAN CHART SATTA MATKA DPBOSS KALYAN MATKA RESULTS KALYAN MATKA MATKA RESULT KALYAN MATKA TIPS SATTA MATKA MATKA COM MATKA PANA JODI TODAY BATTA SATKA MATKA PATTI JODI NUMBER MATKA RESULTS MATKA CHART MATKA JODI SATTA COM INDIA SATTA MATKA MATKA TIPS MATKA WAPKA ALL MATKA RESULT LIVE ONLINE MATKA RESULT KALYAN MATKA RESULT DPBOSS MATKA 143 MAIN MATKA KALYAN MATKA RESULTS KALYAN CHART
AI Transformation Playbook: Thinking AI-First for Your BusinessArijit Dutta
I dive into how businesses can stay competitive by integrating AI into their core processes. From identifying the right approach to building collaborative teams and recognizing common pitfalls, this guide has got you covered. AI transformation is a journey, and this playbook is here to help you navigate it successfully.
SATTA MATKA DPBOSS KALYAN MATKA RESULTS KALYAN CHART KALYAN MATKA MATKA RESULT KALYAN MATKA TIPS SATTA MATKA MATKA COM MATKA PANA JODI TODAY BATTA SATKA MATKA PATTI JODI NUMBER MATKA RESULTS MATKA CHART MATKA JODI SATTA COM INDIA SATTA MATKA MATKA TIPS MATKA WAPKA ALL MATKA RESULT LIVE ONLINE MATKA RESULT KALYAN MATKA RESULT DPBOSS MATKA 143 MAIN MATKA KALYAN MATKA RESULTS KALYAN CHART
Dpboss Satta Matta Matka Kalyan Chart Indian MatkaDpboss Matka
dpboss,Sattamatka,satta,matka,satta matka,kalyan weekly chart.kalyan chart. Kalyan jodi chart.kalyan penal chart.kalyan today.kalyan open.fix satta, fix fix fix Satta matka nambar,Sattamatka Win Provide The Best strategy to win a lot of money and Get Best Satta Matka Tips On Every Market & Fix Fix Fix Satta Namber, Satta Matka, Kalyan Matka, Matka Guessing, Satta Matka Result, and Matka Bazar. Satta Bazar, Matka Game, Kalyan Panel Chart, Sattaking143 Number Weekly Jodi, Matka Guessing Final Ank Open Close. Fix Fix FixSatta Nambar prabhat satta. Kalyan panel chart 2020–2010 Kalyan Night Chart, Indian Satta King Satta. Matka Result, Fix Matka, Satta Market, Matka Market, Matka, sattamatka, main ratan panel chart, mumbai panel chart. Milan panel chart, Matka one, simple matka guessing, param matka guessing trick 143 surya alex, satta, Dpboss, sattamatka, boss matka, matka boss,Satta Boss Tara Matka, Rajdhani Night Chart, and Golden Dubai Matka.Sattamatka Madhur Satta, Fastest Matka Satka Batta. Matka 420 Matka Boss, Kalyan Wapka Mobi Site 100 Tricks,Kalyan Night Panel Chart. Milan night panel chart, time bazar khiladi 420. Sona matka 111 420, boss 440, matka india net, weekly Indian Satta fix ank otg. Satta Matka Cool Tag- matka result, matka guessing, satta matta matka 143, dpboss, matka guessing fix Jodi, matka guessing 143, matka guessing dpboss, kalyan chart, Fix fix 3 ank today, Fix fix 3 ank 143, kalyan chart, kalyan final, kalyan open fix pana, fix fix 3 ank 4 ank, fix fix 3 ank time bazar, kalyan chart fix open to close Fix fix 3 ank kalyan, Fix fix 3 ank chart, fix fix fix open, 100 fix ank, , kalyan fix open 143, kalyan fix open guessing, kalyan open, kalyan 100 fix open today,
❽❽❻❼❼❻❻❸❾❻ DPBOSS NET SPBOSS SATTA MATKA RESULT KALYAN MATKA GUESSING FREE KA...essorprof62
DPBOSS NET SPBOSS SATTA MATKA RESULT KALYAN MATKA GUESSING FREE KALYAN FIX JODI ANK LEAK FIX GAME BY DP BOSS MATKA SATTA NUMBER TODAY LUCKY NUMBER FREE TIPS ...
Unlocking WhatsApp Marketing with HubSpot: Integrating Messaging into Your Ma...Niswey
50 million companies worldwide leverage WhatsApp as a key marketing channel. You may have considered adding it to your marketing mix, or probably already driving impressive conversions with WhatsApp.
But wait. What happens when you fully integrate your WhatsApp campaigns with HubSpot?
That's exactly what we explored in this session.
We take a look at everything that you need to know in order to deploy effective WhatsApp marketing strategies, and integrate it with your buyer journey in HubSpot. From technical requirements to innovative campaign strategies, to advanced campaign reporting - we discuss all that and more, to leverage WhatsApp for maximum impact. Check out more details about the event here https://events.hubspot.com/events/details/hubspot-new-delhi-presents-unlocking-whatsapp-marketing-with-hubspot-integrating-messaging-into-your-marketing-strategy/
Easy Earnings Through Refer and Earn Apps Without KYC.pptxFx Lotus
Learn how to make extra money with refer and earn apps that don’t require KYC. Find out the advantages, top apps, and strategies to boost your earnings quickly and easily.
NewBase 20 June 2024 Energy News issue - 1731 by Khaled Al Awadi_compressed.pdfKhaled Al Awadi
Greetings,
Hawk Energy is pleased to present you with the latest energy news
NewBase 20 June 2024 Energy News issue - 1731 by Khaled Al Awadi
Regards.
Founder & S.Editor - NewBase Energy
Khaled M Al Awadi, Energy Consultant
MS & BS Mechanical Engineering (HON), USAGreetings,
Hawk Energy is pleased to present you with the latest energy news
NewBase 20 June 2024 Energy News issue - 1731 by Khaled Al Awadi
Regards.
Founder & S.Editor - NewBase Energy
Khaled M Al Awadi, Energy Consultant
MS & BS Mechanical Engineering (HON), USAGreetings,
Hawk Energy is pleased to present you with the latest energy news
NewBase 20 June 2024 Energy News issue - 1731 by Khaled Al Awadi
Regards.
Founder & S.Editor - NewBase Energy
Khaled M Al Awadi, Energy Consultant
MS & BS Mechanical Engineering (HON), USAGreetings,
Hawk Energy is pleased to present you with the latest energy news
NewBase 20 June 2024 Energy News issue - 1731 by Khaled Al Awadi
Regards.
Founder & S.Editor - NewBase Energy
Khaled M Al Awadi, Energy Consultant
MS & BS Mechanical Engineering (HON), USAGreetings,
Hawk Energy is pleased to present you with the latest energy news
NewBase 20 June 2024 Energy News issue - 1731 by Khaled Al Awadi
Regards.
Founder & S.Editor - NewBase Energy
Khaled M Al Awadi, Energy Consultant
MS & BS Mechanical Engineering (HON), USAGreetings,
Hawk Energy is pleased to present you with the latest energy news
NewBase 20 June 2024 Energy News issue - 1731 by Khaled Al Awadi
Regards.
Founder & S.Editor - NewBase Energy
Khaled M Al Awadi, Energy Consultant
MS & BS Mechanical Engineering (HON), USA
Cover Story - China's Investment Leader - Dr. Alyce SUmsthrill
In World Expo 2010 Shanghai – the most visited Expo in the World History
https://www.britannica.com/event/Expo-Shanghai-2010
China’s official organizer of the Expo, CCPIT (China Council for the Promotion of International Trade https://en.ccpit.org/) has chosen Dr. Alyce Su as the Cover Person with Cover Story, in the Expo’s official magazine distributed throughout the Expo, showcasing China’s New Generation of Leaders to the World.
L'indice de performance des ports à conteneurs de l'année 2023SPATPortToamasina
Une évaluation comparable de la performance basée sur le temps d'escale des navires
L'objectif de l'ICPP est d'identifier les domaines d'amélioration qui peuvent en fin de compte bénéficier à toutes les parties concernées, des compagnies maritimes aux gouvernements nationaux en passant par les consommateurs. Il est conçu pour servir de point de référence aux principaux acteurs de l'économie mondiale, notamment les autorités et les opérateurs portuaires, les gouvernements nationaux, les organisations supranationales, les agences de développement, les divers intérêts maritimes et d'autres acteurs publics et privés du commerce, de la logistique et des services de la chaîne d'approvisionnement.
Le développement de l'ICPP repose sur le temps total passé par les porte-conteneurs dans les ports, de la manière expliquée dans les sections suivantes du rapport, et comme dans les itérations précédentes de l'ICPP. Cette quatrième itération utilise des données pour l'année civile complète 2023. Elle poursuit le changement introduit l'année dernière en n'incluant que les ports qui ont eu un minimum de 24 escales valides au cours de la période de 12 mois de l'étude. Le nombre de ports inclus dans l'ICPP 2023 est de 405.
Comme dans les éditions précédentes de l'ICPP, la production du classement fait appel à deux approches méthodologiques différentes : une approche administrative, ou technique, une méthodologie pragmatique reflétant les connaissances et le jugement des experts ; et une approche statistique, utilisant l'analyse factorielle (AF), ou plus précisément la factorisation matricielle. L'utilisation de ces deux approches vise à garantir que le classement des performances des ports à conteneurs reflète le plus fidèlement possible les performances réelles des ports, tout en étant statistiquement robuste.
Adani Group Requests For Additional Land For Its Dharavi Redevelopment Projec...Adani case
It will bring about growth and development not only in Maharashtra but also in our country as a whole, which will experience prosperity. The project will also give the Adani Group an opportunity to rise above the controversies that have been ongoing since the Adani CBI Investigation.
[To download this presentation, visit:
https://www.oeconsulting.com.sg/training-presentations]
Unlock the full potential of the MECE (Mutually Exclusive, Collectively Exhaustive) Principle with this comprehensive PowerPoint deck. Designed to enhance your analytical skills and strategic decision-making, this presentation guides you through the fundamental concepts, advanced techniques, and practical applications of the MECE framework, ensuring you can apply it effectively in various business contexts.
The MECE Principle, developed by Barbara Minto, an ex-consultant at McKinsey, is a foundational tool for structured thinking. Minto is also renowned for the Minto Pyramid Principle, which emphasizes the importance of logical structuring in writing and presenting ideas. This presentation includes a clear explanation of the MECE principle and its significance. It offers a detailed exploration of MECE concepts and categories, highlighting how to create mutually exclusive and collectively exhaustive segments. You will learn to combine MECE with other powerful business frameworks like SWOT, Porter's Five Forces, and BCG Matrix. Discover sophisticated methods for applying MECE in complex scenarios and enhancing your problem-solving abilities. The deck also provides a step-by-step guide to performing thorough and structured MECE analyses, ensuring no aspect is overlooked. Insider tips are included to help you avoid common mistakes and optimize your MECE applications.
The presentation features illustrative examples from various industries to show MECE in action, providing practical insights and inspiration. It includes engaging group activities designed for the practice of the MECE principle, fostering collaborative learning and application. Key takeaways and success factors for mastering the MECE principle and applying it in your professional work are also covered.
The MECE Principle presentation is meticulously designed to provide you with all the tools and knowledge you need to master the MECE principle. Whether you're a business analyst, manager, or strategist, this presentation will empower you to deliver insightful and actionable analysis, drive better decision-making, and achieve outstanding results.
LEARNING OBJECTIVES:
1. Understand the MECE Principle
2. Improve Analytical Skills
3. Apply MECE Framework
4. Enhance Decision-Making
5. Optimize Resource Allocation
6. Facilitate Strategic Planning
1. Developing Country Studies www.iiste.org
ISSN 2224-607X (Paper) ISSN 2225-0565 (Online)
Vol.3, No.8, 2013
64
Intellectual Capital Paradox: The case of Hungary and Ukraine
Dr. György Boda (Correspondent Author)
Department of Business Studies
Corvinus University of Budapest
Fővám tér 8, H-1093 Budapest
E-mail: gyorgy.boda@uni-corvinus.hu
Nataliia Stukalo
Department of International Economics and World Finance
Oles Honchar Dnipropetrovs’k National University
Naukovaya St. 13, 49050, Dnipropetrovs’k
E-mail: nstukalo@ukr.net
Iaroslava Stoliarchuk
International Economics Department,
Kiev National Economic University
named after Vadym Hetman
Peremoga Pr., 54/1, 03680, Kyiv
E-mail: stolyaroslava@yandex.ru
József Fejes
Department of Business Studies
Corvinus University of Budapest
Fővám tér 8, H-1093 Budapest
E-mail: jozsef.fejes@uni-corvinus.hu
Abstract
The authors have analysed the economic growth and its determining factors in countries of the European Union,
particularly in Hungary and Ukraine. We applied quantitative methods by analysing topic related database. We
have found that the Central-Eastern European Periphery has not finished its transition, and this change is heading
in the direction of the Southern Periphery of the European Union. As the Southern Periphery is the area of
economic crises right now, it is obvious that something should be done in order to avoid falling to the same fate
for the Central-Eastern European Periphery. The authors introduced a new production function and with its help
they identified the bottlenecks of growth in Hungary and Ukraine, namely the organizational and human capital
that in its present development stage, do not correspond to the needs of creating state of the art larger companies.
The present crisis pushes both countries to postpone long-term developments, such as investments into human
capital, and in this way makes the solution of the crisis more difficult.
Keywords: Intellectual Capital, Growth, Southern European Periphery, Central-Eastern European Periphery,
Enterprise Demography, Competitiveness
1. Introduction
Two decades have passed since the transition from centrally planned economies into market economies in
Central and Eastern Europe began. Experiencing our everyday economic difficulties, the public opinion is
inclined to evaluate this transition period as unsuccessful. This is dangerous, because it does not take into proper
account the significant development that has been achieved and instead of completing the achieved half results
the prevailing pessimism could everything destroy what we have positively done. At the same time it must be
acknowledged that something went wrong and patience alone is not enough to be successful.
2. Developing Country Studies www.iiste.org
ISSN 2224-607X (Paper) ISSN 2225-0565 (Online)
Vol.3, No.8, 2013
65
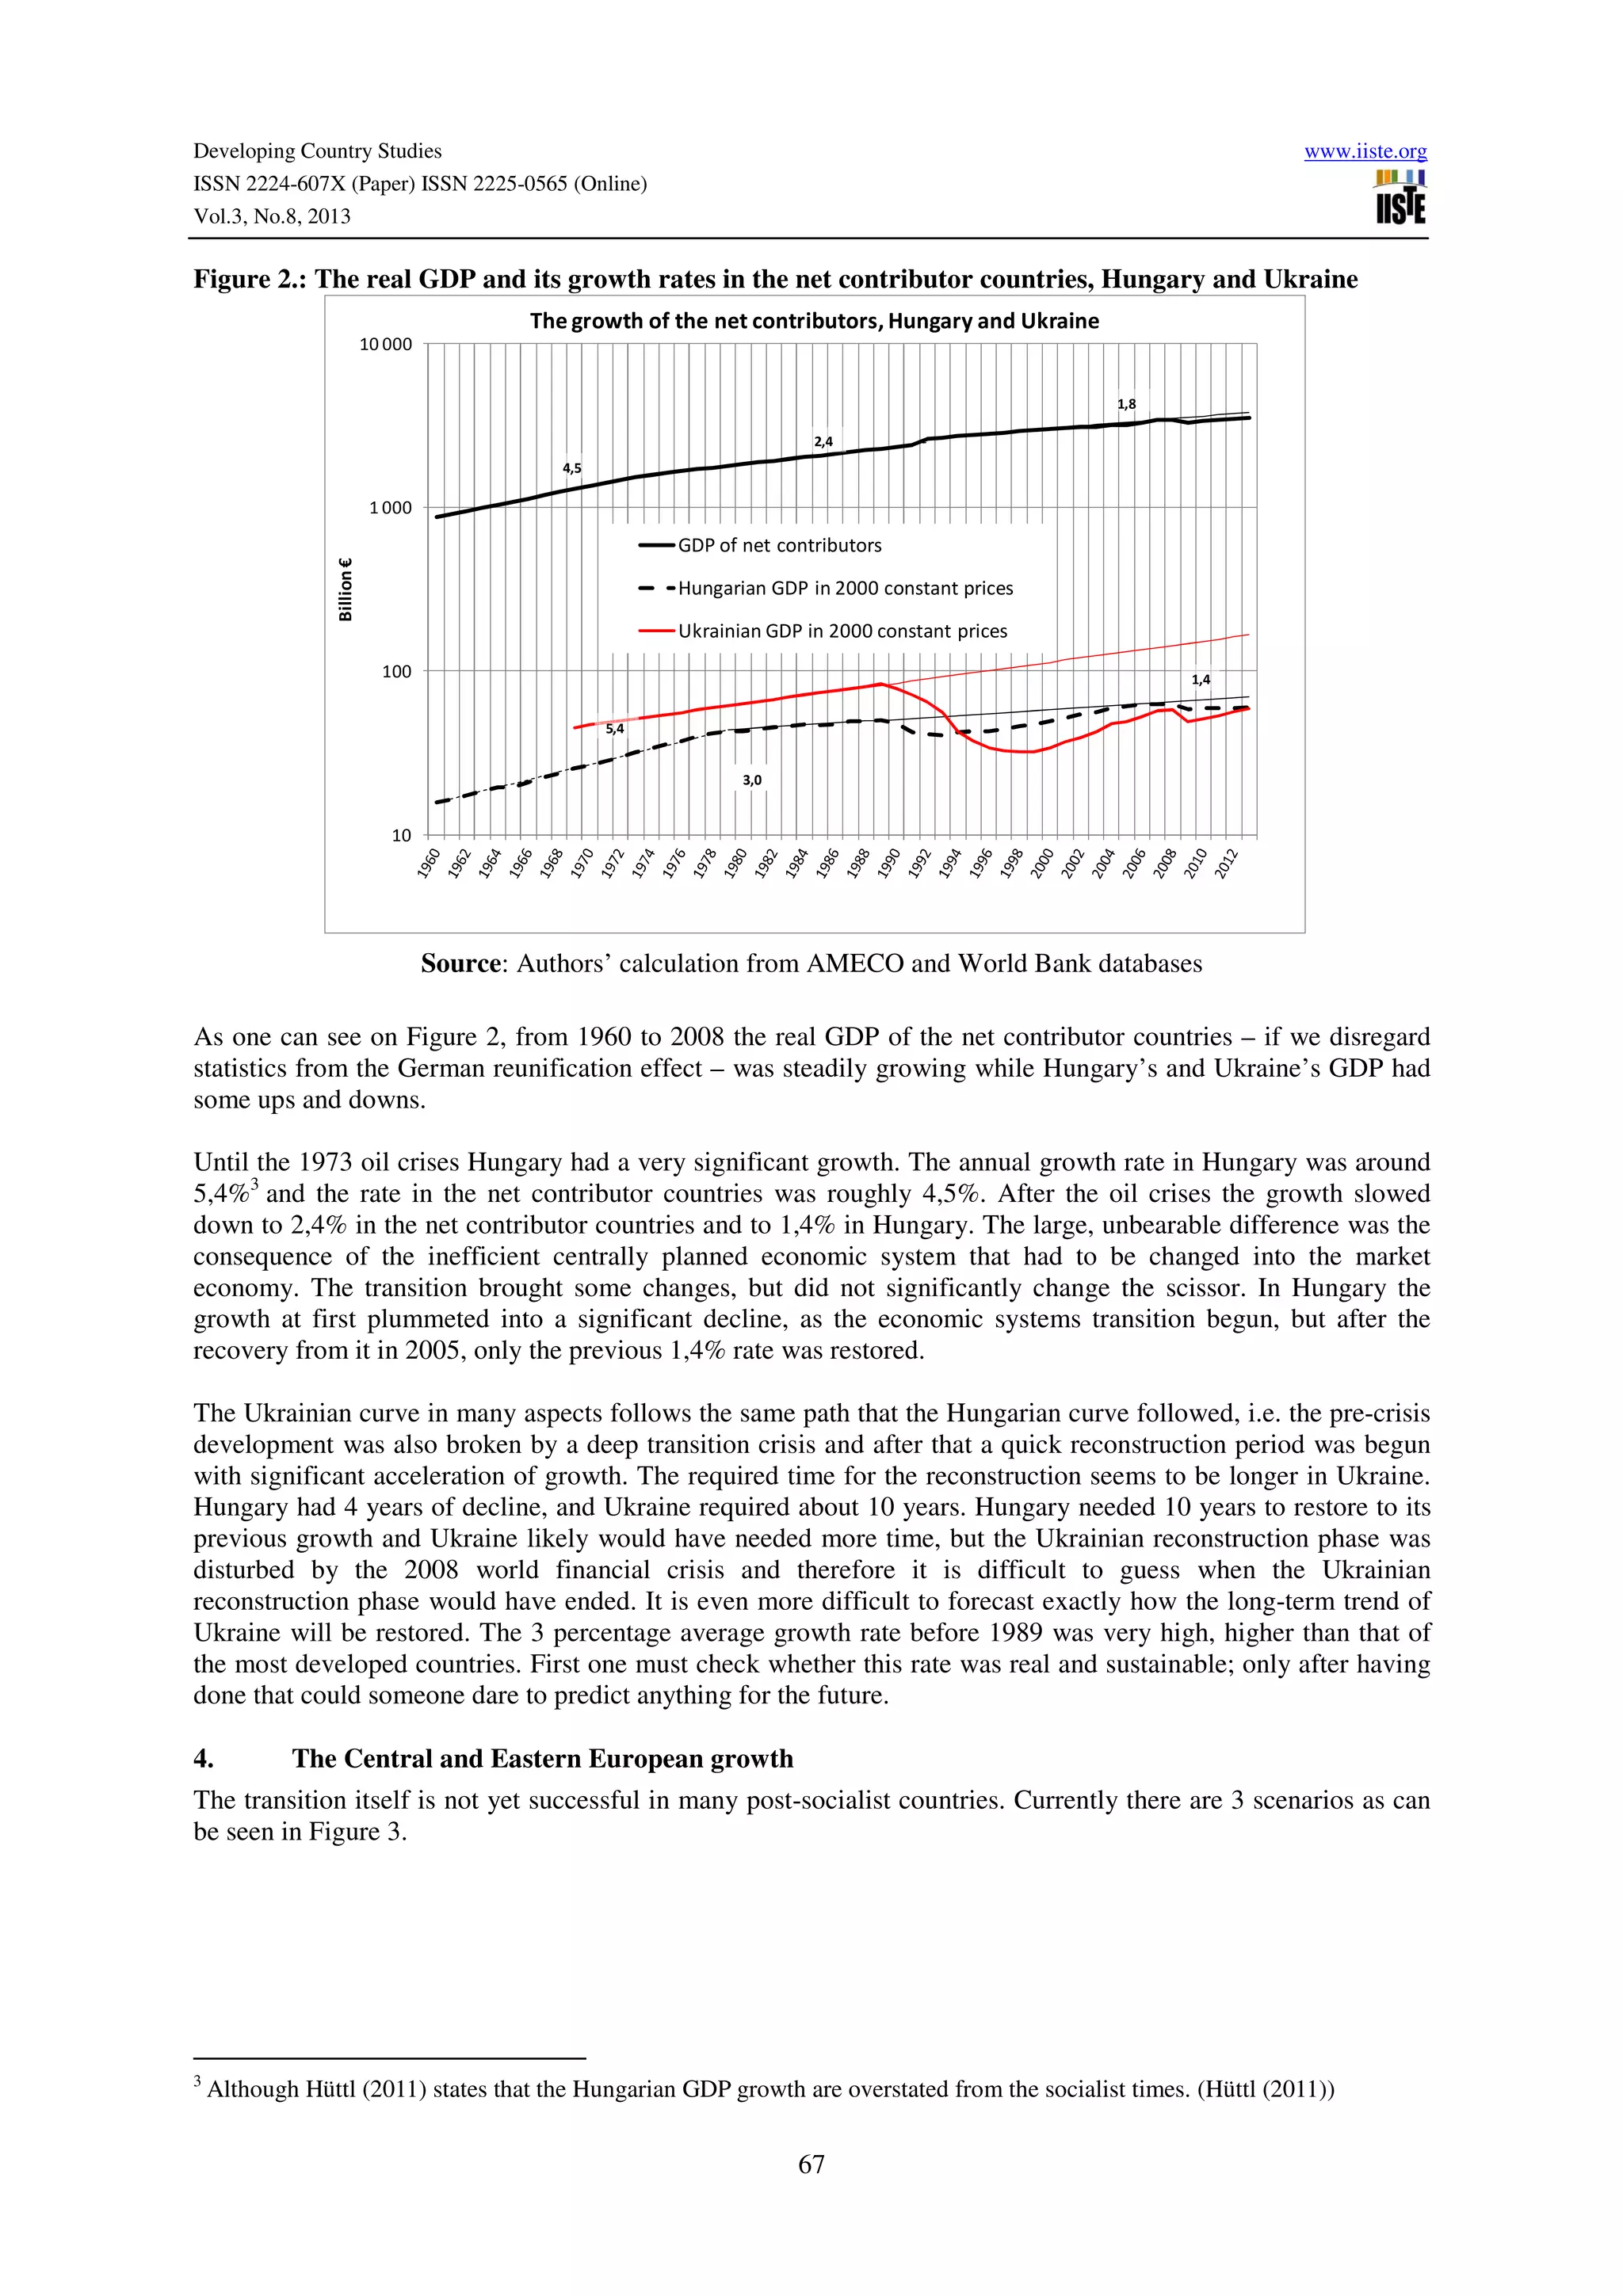
The central message of the study is that we are behind a painful, but unavoidable structural change that in many
respects has corrected the former distorted development and the achieved one mostly corresponds to the present
economic development level of our countries. However we cannot be satisfied with the evolved status quo. To
get a positive balance we must continue the transition and we must make further investments, especially there,
where our weakest point is, into our knowledge capital.
This statement is somewhat of a paradox. The Central and Eastern European countries are not wrong in
knowledge indicators. Their education system, their scientific life each stands in international comparison;
notwithstanding, it does not appear in their economic performance. In this article we try to find some facts that
could partially explain this paradox.
There is one phenomenon that makes the picture more complex and more difficult to explain: the present
worldwide economic crisis that erupted in 2008. Nevertheless, we are convinced that the main bottlenecks that
are restraining our growth are not of short-term character. So, in this study, we will focus on those long-term
factors that already worked prior to the present world crisis and which will determine our development in the
future when the crisis is over. The present crisis only magnifies the difficulties that are the result of those
determining factors that we will reveal.
The structure of our article is the following: first we will describe the growth that has evolved during the
transition; then we will summarize those factors that determine the growth; next we will examine those factors in
detail, which we regard as bottlenecks of our growth; after that we will analyse those structural changes that can
dissolve these bottlenecks and finally solve our paradox. In our analysis we will focus mainly on Hungary and
Ukraine, but we will try to generalize the results obtained this way for all of Central and Eastern Europe.
2. The European growth
Economic growth could be measured in many ways, but we will apply the traditional GDP based measurement,
even though we are well aware of its shortages. We accept the message of the Stiglitz-Sen-Fitoussi report, i.e.
GDP growth reflects acceptable growth only, if the resulting assets are grown at a sustainable way. (Stiglitz-Sen-
Fitoussi [2009]) In addition to GDP measurements we rely on WEF and IMD competitiveness data to overcome
the above-mentioned imperfection of GDP data.
To get an overview about the European Growth we aggregated the EU countries into four country groups and
compiled a non EU country group of Russia, Ukraine and Serbia. The growth of these country groups are shown
on Figure 1.
3. Developing Country Studies www.iiste.org
ISSN 2224-607X (Paper) ISSN 2225-0565 (Online)
Vol.3, No.8, 2013
66
Figure 1.: The real GDP of the main European country groups at 2000 constant prices
100
1 000
10 000Milliard€
The growth of the most important country groups in Europe
Other centrum countries
GDP of net contributors
Southern peripheral countries
Central-Eastern European
Countries
Russia, Ukraine, Serbia
4,4
2,5
1,8
4,2
2,4
5,6
3,9
2,4
2,2
1,7
3,1
3,0
3,8
3,0
Source: Authors’ calculation from AMECO and World Bank databases. Other central countries: Belgium,
Denmark, France, Ireland, UK; Net contributors 1 : Austria, Finland, Germany, Luxemburg, Netherlands,
Sweden; Southern Peripheral countries: Cyprus, Greece, Italy, Malta, Portugal, Spain; Central-Eastern European
countries: Bulgaria, Czech Republic, Hungary, Poland, Rumania, Slovakia, Slovenia, Croatia, and the Baltic
states.
Since the magnitude of the compared aggregates is very different, instead of an arithmetical scale on the vertical
axis, we used a logarithmic scale. The logarithmic scale not only shows the different aggregates in a comparable
way, but also makes their growth comparable. The slope of the curves in a given period is rather constant and is
proportional to the average growth of those years. The figures above the curves indicate the exact average
growth rate of that period. Important restriction: in this study we do not deal with the last decline due to the
world financial crisis in 2008 that is observable in each curve.
There are some very characteristic tendencies in the European Growth. If we disregard the present economic
crisis, whose general outcome we do not yet know, we will witness a long-term growth scissor: the net
contributors and the other central countries had a relatively quick, 2,5 percentage average growth, while the
growth of the peripheral countries gradually slowed down. This delay was relatively gradual in the countries of
the Southern European Periphery, while in countries of Central-Eastern European periphery it was rather
dramatic and accompanied by a transition from the centrally planned economic system into a market economy2
.
In the focus of our research we shall concentrate on the growth of the later country group in a more detailed
manner.
3. The Hungarian and Ukrainian growth
The Central and Eastern European growth can be well characterized by the description of the Hungarian and the
Ukrainian growth.
1
These countries are the most advanced in the European Union and they are quasi cross-financing the southern EU countries and the
central-eastern countries.
2
There is a slow down in the growth rate of the net contributors as well, but it is a consequence of the German reunification. If there were
no reunification, the growth rate of this country group would have remained around 2.5 percentage averagely instead of 1.8.
4. Developing Country Studies www.iiste.org
ISSN 2224-607X (Paper) ISSN 2225-0565 (Online)
Vol.3, No.8, 2013
67
Figure 2.: The real GDP and its growth rates in the net contributor countries, Hungary and Ukraine
10
100
1 000
10 000Billion€
The growth of the net contributors, Hungary and Ukraine
GDP of net contributors
Hungarian GDP in 2000 constant prices
Ukrainian GDP in 2000 constant prices
4,5
2,4
1,8
5,4
1,4
3,0
Source: Authors’ calculation from AMECO and World Bank databases
As one can see on Figure 2, from 1960 to 2008 the real GDP of the net contributor countries – if we disregard
statistics from the German reunification effect – was steadily growing while Hungary’s and Ukraine’s GDP had
some ups and downs.
Until the 1973 oil crises Hungary had a very significant growth. The annual growth rate in Hungary was around
5,4%3
and the rate in the net contributor countries was roughly 4,5%. After the oil crises the growth slowed
down to 2,4% in the net contributor countries and to 1,4% in Hungary. The large, unbearable difference was the
consequence of the inefficient centrally planned economic system that had to be changed into the market
economy. The transition brought some changes, but did not significantly change the scissor. In Hungary the
growth at first plummeted into a significant decline, as the economic systems transition begun, but after the
recovery from it in 2005, only the previous 1,4% rate was restored.
The Ukrainian curve in many aspects follows the same path that the Hungarian curve followed, i.e. the pre-crisis
development was also broken by a deep transition crisis and after that a quick reconstruction period was begun
with significant acceleration of growth. The required time for the reconstruction seems to be longer in Ukraine.
Hungary had 4 years of decline, and Ukraine required about 10 years. Hungary needed 10 years to restore to its
previous growth and Ukraine likely would have needed more time, but the Ukrainian reconstruction phase was
disturbed by the 2008 world financial crisis and therefore it is difficult to guess when the Ukrainian
reconstruction phase would have ended. It is even more difficult to forecast exactly how the long-term trend of
Ukraine will be restored. The 3 percentage average growth rate before 1989 was very high, higher than that of
the most developed countries. First one must check whether this rate was real and sustainable; only after having
done that could someone dare to predict anything for the future.
4. The Central and Eastern European growth
The transition itself is not yet successful in many post-socialist countries. Currently there are 3 scenarios as can
be seen in Figure 3.
3
Although Hüttl (2011) states that the Hungarian GDP growth are overstated from the socialist times. (Hüttl (2011))
5. Developing Country Studies www.iiste.org
ISSN 2224-607X (Paper) ISSN 2225-0565 (Online)
Vol.3, No.8, 2013
68
Figure 3.: Transition scenarios of post-socialist countries
Declinedue to
transition
Small Significant Big
Restorationof long
term growth
Done Done Not yet done
Acceleratinglomg
term growth rate
Done Not done Unknown
Magnitudeof long
term growth rate
Big Small Unknown
Poland
Slovenia
Serbia
Czech R.
Slovakia
Hungary
Russia
Ukraine
Romania
Bulgaria Croatia
Source: Authors’ calculation from Hungarian Statistical Office, AMECO and World Bank databases with the
methodology of Jánossy (1975)
There are the countries that could accelerate their former long-term GDP growth – Poland, Slovenia and Serbia
or the accelerator countries. These countries experienced only a minor transitional decline, they have restored
the decline already, and they could even accelerate their growth. The ratekeeper countries had a completely
different scenario, as their transitional decline was significant – what they could restore, but they could not yet
accelerate their long-term growth. These countries are Hungary, Czech Republic and Slovakia. The third group
of countries are the restorers, who had a major transitional decline, which they have not yet restored and as we
do not have the information as to when they will restore it and it is unknown whether they can accelerate their
growth or not.
Regardless, if we accept the assumption that the better economic performance measured in larger GDP means a
better life, we should tackle the issue of how to fall in line with the net contributor and other central countries. In
the beginning of the transition the post-socialist countries had high hopes of closing up, but most of their hopes
were dashed. The transition did not meet their expectations and the net contributors are now cruising away. We
should analyze the reasons behind the not so successful transition to gain some insight as to why the growth
failed to accelerate and whether there are some bottlenecks that could be treated to help in a leap to a better
growth course.
5. The production factors behind the growth
These economic trends raise two very important questions:
• What really determines the new value of creation?
• Where should we intervene to avoid further crisis in the Central European Periphery?
To answer these questions we rely on a new production function illustrated in figure 4.
6. Developing Country Studies www.iiste.org
ISSN 2224-607X (Paper) ISSN 2225-0565 (Online)
Vol.3, No.8, 2013
69
Figure 4: The new production function
I1
E
External
immaterial
assets
(customers,
brands, image,
suppliers, etc)
Y = F1 ( T, I1, I2, L , N )
New value
Income
distribution
Knowledge assets
/ knowledge capital
H = F2 (E)
Innovation
Engagement
of
employees
I2
M
I1
I
Internal
immaterial
assets (level of
being organised,
strategies, docus.,
pprocesses,
organization,
norms and values)
Competency
not alienable from people
Source: Boda – Virág (2010), Bacsur – Boda – Virág (2010)
New value cannot be produced without assets or capital! To produce new value we need real estates, buildings,
machines, equipments, working capital, etc. Let us call this group of assets the tangible production factors.
Then we shall denote this group of assets by T. However, these assets only represent a fragment of those
production factors that are needed for a successful value creation. What kinds of production factors are still
required?
First we need relationship assets or capital. Here the asset side refers to our customers, brand, and suppliers.
Investments are required in order to have reliable and working relations with our customers, with the authorities
and organisations in our environment, and with society. For that system of relationships to occur, somebody
must invest. This way an asset will be created and it will be owned by the investor. This asset works exactly as
the tangible assets do. Henceforth this asset group, our relationships or our customers, will be denoted by I1
E
.
The denotation shows that these assets do not have material forms, they are immaterial assets; therefore is the
letter I used. The letter E as an upper case letter indicates their external content. Namely these assets are ours,
but are carried by people outside of our domain (physical or psychic). The meaning of the under case index 1
will be explained later.
In order to produce new value we need strategy, know-how, databases, well-organized working processes,
organization structures, values, and expected norms, i.e. organisational assets or capital. This also is an asset
that requires investment from somebody, i.e. it is a capital of somebody. This asset group, our being organized,
we shall denote by I1
I
. The upper case I expresses the internal character of these assets. These assets do not
belong to those we would like to sell our products and services to, but to us.
Each of the listed assets – T, I1
E
, I1
I
–- can be owned unambiguously. The ownership rights are transferable,
sellable, and can be determined. This common characteristic is denoted by the under case index 1.
However, this is not the case with the further assets that are also needed. The further assets that we also need are
personal knowledge (I2
K
), skill (I2
S
), and engagement (motivation - I2
M
). These assets we shall call as human
assets. When denoting them, I indicates that they are all immaterial, K means personal knowledge, S means skill
and M means engagements (motivation). Here the under case index is 2. It indicates an essential difference. It
indicates the fact that, these particular assets, can only be owned by the human beings who carry them. The K, S,
and M are each strictly bound to the physical body of the owners. At the same time these asset items could be
less dependent from each other. Somebody can have personal knowledge without also having serious skill. It is
7. Developing Country Studies www.iiste.org
ISSN 2224-607X (Paper) ISSN 2225-0565 (Online)
Vol.3, No.8, 2013
70
also possible that something destroys someone’s motivation, although he still has both the personal knowledge
and the skill. These elements are the product of different investments that are done by different actors. The
investor may be the firm, or the carrying person, or the society. The ownership right of the investment is given to
whoever the investor is, it is non-transferable and it is under the control of the carrying individual.
N denotes those assets that cannot be identified exactly, because we do not know precisely how they work or
what kind of nature they have; so these are the non-identified elements. At the same time they could be very
coincidental in a certain production situation in which the social capital elements mainly belong. These factors
are necessary in grasping the totality.
With the help of Figure 1 we can further define the asset/capital items. Elements T-I1
E
-I1
I
together create the
enterprise assets / enterprise capital. Elements I2
K
-I2
S
-I2
M
-L together create the human assets / human
capital. As one can see, the human assets are not equal to the headcount, but to the headcount plus the
knowledge assets / knowledge capital carried by it. Where the human capital is significant, the carrier is also
beyond its flesh and blood nature, carrying a significant amount of knowledge capital. In this case, for the
carrier, the wage is not enough. The carrier, as capital owner, would like to have the appropriate share from the
produced new value as capital income; the larger the role of human capital, the grander the role of the
distribution of the produced new value. In other words, the wages must shift to capital incomes. These laws are
denoted by the arrows starting from the eclipse of income distribution.
Finally, let us define the knowledge assets / knowledge capital, as the sum of the immaterial asset / immaterial
capital elements. This is the item that we will call intellectual capital.
The production function on Figure 1 has a serious background. Its scientific origins are rooted in the Cobb-
Douglas production function of literature and in its renewal by Solow and others.4
Additionally, it also has a
serious practical background. This function has been tested in several enterprise projects. The experience of this
testing has led to the second equation that also can be seen at the bottom on Figure 1. During our enterprise
testing we had to come to the conclusion that the factors in the above production factors are not independent.
Among them serious interrelationships exist and the new value production declines if these additional
interrelationships are hurt. This second equation is the H = F2 (E) equation. It says that maximal new value can
be produced only, if H corresponds in both magnitude and structure to requirements defined by E. If the real
human capital is smaller or greater than the technically required one, then the new value is below the
optimal value. If people of inadequate competency, skill, motivation, and number produce a product or a
service, then either the cost level of production increases or, for quality problems, the turnover declines. Both are
currently leading to the decrease of new value. This point will be crucial to solve our paradox later.
There is still one factor we must speak about – innovation. Innovation literature and the vastly used innovation
manuals differentiate among product innovation, process innovation, and many other kinds of innovation.
According to our opinion, the innovation is equal to the change that increases the efficiency of one or several
production factors. This can happen if an employer increases the efficiency of the production factors that are
under her or his control alone. The innovation spark is ignited when a company with a new combination of the
elements of the enterprise and human capital increases the total efficiency of the production factors; from the
enterprise and national economy viewpoint, the latter is more important. In our view, the most likely place
where the innovation may evolve is the organizational capital. However, it is not the only place where it
could evolve and therefore we never would regard it as a separate production factor. Nevertheless, although the
innovation can be sparked at every production factor, its impact must have its footprint on the organization
capital, i.e. on internal immaterial assets, because it determines the final combination of assets as a result of
successful innovation. To inspire innovation one needs a huge amount of common knowledge, more common
work, a receptive environment, and a big dose of coincidence. All these will come together in the internal
structure, i.e. within the internal immaterial assets.
4
About the origins see the summary in the world bank edition (Aubert, 2010). Also an important summary can be found at Pirjo Ståhle and
Sten Ståhle: We regard their research as one of the most advanced proceedings the famous Skandia school has developed under the
supervision of its big guru, Leif Edvinsson. we regard ourselves also as followers of this famous school.
8. Developing Country Studies www.iiste.org
ISSN 2224-607X (Paper) ISSN 2225-0565 (Online)
Vol.3, No.8, 2013
71
The economic development is like a caravan in the fact that its speed is determined by the slowest camel
(Jánossy 1971; 1975). We have identified the “camels of the caravan” with the new production function and the
“caravan” which can be seen in figure 5. The slowest camel actually means the bottleneck(s) of growth.
Figure 5. The bottlenecks of the Central and Eastern European development
Tangible
assets
T I1
E I1
I I2
K I2
S I2
M
HeadcountMotivationSkill
Personal
knowledge
Organization,
institutions
Customers,
suppliers
L
The speed of the caravan is determinedby the speed of the lowest camel.
Nonreplaceable,
but cheatablecamel
(on the short run)
Replaceablecamels
Bottleneck 2Bottleneck 1
Nonreplaceable
camels
The transition The real change
Source: Authors’ source
What would a caravan owner do if he were unsatisfied with the speed of his caravan? He would change the
slowest camel of course! The problem with this solution is that the camels are not equally changeable. The
changeable and so replaceable camels are equivalent with the tangible and relationship assets. By the way, the
Central and Eastern European countries have changed the majority of their tangible assets and markets. The
personal knowledge, the skill, and the headcount are each partially replaceable on the enterprise level, but not
replaceable on the national level. The organizational capital (organizations, institutions, etc.) is only partly
replaceable, because it is seriously interrelated with the human capital. Motivation can be influenced on the short
run, but not on the long run. Based on these characteristics it is obvious that the weakest points of the caravan are
the non-replaceable or the partly replaceable production factors, i.e. the organizational capital and the human
capital.
According to our hypothesis in the development of central and eastern European countries, there are two major
bottlenecks, i.e. the internal immaterial assets and the personal knowledge and the skills nowadays. Within the
internal immaterial assets however, the management capabilities and the strategic partnerships are not utilized
enough. The personal knowledge and skills are more problematic. Although, in the transitional countries, the
education system has changed a lot, these changes have not yet met the criteria of the long-term needs of these
countries. The skills and knowledge have both adapted to the requirements of multinational companies, but it
seems they have failed to create any cutting edge in creating new industries or establishing new domestic
multinational companies.
6. The production factors in Hungary and in Ukraine
As we mentioned earlier, the GDP does not express everything. Therefore, we completed the GDP analysis with
an analysis of the WEF and IMD measurements.
The rank of Ukraine in 2011-2012 Global Competitiveness Index rankings, computed by World Economic
Forum (WEF), is 82 with a score of 4.00. It’s important to note that it is currently 7 points better then the last
years ranking which is considered great progress after the steep decline of many countries. By using the WEF
methodology behind the rapidly increasing Ukrainian GDP, we can see the well-educated population, flexible
and efficient labour markets, large market size as Ukraine’s competitive strength and base for future growth
9. Developing Country Studies www.iiste.org
ISSN 2224-607X (Paper) ISSN 2225-0565 (Online)
Vol.3, No.8, 2013
72
performance (Figure 6). However, weak institutional framework (131st place), highly inefficient market for
goods and services (129th), and undeveloped financial sectors (116th) were not improved regardless of declared
reforms and caused the weak position of Ukraine in this ranking.
Figure 6. Global Competitiveness Index 2011-2012 of Hungary and Ukraine
0
1
2
3
4
5
6
Institutions
Infrastructure
Macroeconomic stability
Health and primary
education
Higher education and
training
Goods market and
efficiency
Labor market efficiency
Financial market
sophistication
Technological readiness
Market size
Business sophistication
Innovation
Hungary Ukraine
Source: WEF (2012)
For comparison, Hungary is ranked at 48 with score 4.36. In 2010-2011, Hungary’s GCI5
rank was 52, so the
country improved its position by 4 points during the last year (WEF, 2012). We’d like to stress that Hungary’s
competitive strong factors are almost the same as Ukrainian ones – health and primary education, higher
education and training, and macroeconomic stability. So, both countries are competitive in terms of human
capital development factors according to the WEF Global Competitiveness Index. At the same time, the weakest
factors are almost the same for both Hungary and Ukraine: institutions, financial market sophistication, business
sophistication, and innovation (see the bright gray cells, in table 1., where both county is good compared to their
scores, and the dark grey cells in table 1., where both countries are weak compared to their scores).
5
Global Competitiveness Index
10. Developing Country Studies www.iiste.org
ISSN 2224-607X (Paper) ISSN 2225-0565 (Online)
Vol.3, No.8, 2013
73
Table 1.:Hungary’s and Ukraine’s performance in the WEF measurements
Hungary Ukraine Hungary Ukraine
Institutions 3,8 3 -0,56 -1,00
Infrastructure 4,5 3,9 0,14 -0,10
Macroeconomic stability 4,8 4,3 0,44 0,30
Health and primary education 5,8 5,6 1,44 1,60
Higher education and training 4,7 4,6 0,34 0,60
Goods market and efficiency 4,3 3,6 -0,06 -0,40
Labor market efficiency 4,4 4,4 0,04 0,40
Financial market sophistication 4,1 3,4 -0,26 -0,60
Technological readiness 4,6 3,5 0,24 -0,50
Market size 4,2 4,5 -0,16 0,50
Business sophistication 3,9 3,5 -0,46 -0,50
Innovation 3,6 3,1 -0,76 -0,90
Score 4,36 4
Pilar values
Deviation form
score
So according to WEB measurements both countries are relatively strong in human capital related factors
while relatively weak in organizational knowledge capital related factors.
Table 2. Competitiveness Indicators Rankings of Hungary and Ukraine in 2007-2011
Country Indicators Rank
2007 2008 2009 2010 2011
HUNGARY
Overall Competitiveness 35 38 45 42 47
Economic Performance 38 39 33 40 44
Government Efficiency 40 47 50 51 52
Business Efficiency 41 45 52 47 50
Infrastructure 25 27 33 35 35
UKRAINE
Overall Competitiveness 46 54 56 57 57
Economic Performance 43 50 55 55 45
Government Efficiency 48 52 56 56 58
Business Efficiency 46 52 53 54 55
Infrastructure 47 46 48 41 48
Source: IMD (2012)
The International Institute for Management Development (IMD) conducts another respected country
competitiveness ranking. Its report includes 16-year time series from the IMD World Competitiveness Yearbook
and covers 59 countries. It analyzes the facts and policies that shape the ability of a nation to create and maintain
an environment that sustains more value creation for its enterprises and more prosperity for its people (IMD,
2012). Table 2 demonstrates the Competitiveness Indicators Rankings of Hungary and Ukraine. Let’s pay
attention to Ukraine’s overall competitiveness decrease from the 46th position in 2007 to the 57th position in
2011. All competitiveness components also decreased during this period. The sharpest decrease was
demonstrated by government and business efficiency.
Figure 7 presents analyzed countries’ detailed competitiveness landscape (IMD, 2012). Numbers on this chart
show countries’ ranking in the specific sphere – so, “the higher hills the better the competitiveness ranking”.
According to this ranking, strong sides of Hungarian and Ukrainian competitiveness are international trade, labor
market, and education. Again the factors which influence human capital development level (for instance
education and labor market) are among strong points. From the other side, Ukraine has “the lowest hills”
11. Developing Country Studies www.iiste.org
ISSN 2224-607X (Paper) ISSN 2225-0565 (Online)
Vol.3, No.8, 2013
74
of health and environment, societal framework, and management practices which are also of great
importance for human capital development. Hungary is also relatively weak in these items.
Figure 7. Competitiveness Landscape of Hungary and Ukraine in 2011
48
17
28
50
37
51
55
49
26
44
41
36
52
45
58
30
38
42
39
27
49
24
45
32
48
50
44
56 56
58
53
41
55 55
50
53
45
43
59
33
0
10
20
30
40
50
60
70
DomesticEconomy
InternationalTrade
InternationalInvestment
Employment
Prices
PublicFinance
Fiscalpolicy
InstitutionalFramework
BusinessLegislation
SocietalFramework
Productivity&Efficiency
LabourMarket
Finance
ManagementPractices
AttitudesandValues
BasicInfrastructure
TechnicalInfrastructure
ScientificInfrastructure
HealthandEnvironment
Education
Hungary
Ukraine
Source: IMD (2012)
So, international competitiveness rankings indicate that human capital is an important factor of
competitiveness in both Hungary and Ukraine. The United Nations Development Program (UNDP) collects
international human development indicators and calculates Human Development Index (HDI) provided in table
3. HDI is an alternative indicator of countries’ developments which also demonstrates a broader understanding
of peoples well-being and includes three basic dimensions of human development: health, education, and
income. From table 3 we can see that Hungary's HDI is 0.816, which gives the country a rank of 38 out of 187
countries (UNDP, 2012).
Table 3 International Human Development Indicators of Hungary and Ukraine in 2011
Area Indicator Hungary Ukraine
Human development HDI, rank 38 76
Human development HDI, score 0.816 0.729
Health Life expectancy at birth (years) 74.4 68.5
Education Education index
(expected and mean years of schooling)
0.866 0.858
Income GNI per capita in PPP terms
(constant 2005 international $)
16 582 6 175
Inequality Inequality-adjusted HDI 0.759 0.662
Poverty Multidimensional poverty index (%) 0.016 0.008
Gender Gender Inequality Index 0.237 0.335
Sustainability Adjusted net savings (% of GNI) 4.5 5.6
Demography Population (thousands) 9 966 45 190
Source: UNDP (2012)
Ukraine takes 76th place out of 187 countries with the score 0.729. It is considered to be high in the human
development level as the as world average HDI score was 0.682 in 2011. So, high levels of development
characterize the human capital of both countries. Again we can see that the education index of these countries
is almost the same and is actually rather high when compared with the other countries of the world.
12. Developing Country Studies www.iiste.org
ISSN 2224-607X (Paper) ISSN 2225-0565 (Online)
Vol.3, No.8, 2013
75
Let us now summarize the messages of the non-GDP measurements! They have validated our preliminary
assumptions about bottlenecks only in the case of organizational capital! Hungary and Ukraine:
• have achieved remarkably good relative ranking positions regarding education, i.e. in the building of
knowledge capital,
• while regarding their institutions, or organizational capitals, they have obtained their relatively weakest
appraisal.
According to formal measurements, both countries have high intellectual capital performances that do not
correspond to their economic and social performances. The question is why. That is what we would call an
intellectual capital development paradox. But one cannot forget how we defined intellectual capital in our
production function. In it, the organisational capital, i.e. the internal immaterial assets or capital is also the part
of the intellectual assets or capital. So, one element of it seems to be positive, while the other one appears as a
serious bottleneck. Behind the paradox the real question is how to implement this potential in practice; how to
turn this bottleneck into the mainstream and a key development force of the countries’ competitiveness.
7. Obstacles making knowledge capital ineffective, or idle
The social transformation of Central-Eastern European countries was extremely deep and almost addressed each
element of these societies, to examine all of them is impossible. Only through the analysis of the most important
units and processes can success be promised. Relying on our production function, we think that the first units
that should be examined are operated according to our production function. These units are the enterprises.
We could significantly reduce the task without endangering satisfactory results if we concentrate only on the
competitive sphere, i.e. the enterprises that are the driving force of the market economy. The manufacturing, the
energy producing industries, the construction, the trade, and the so-called economic services all belong to this
sphere6
. This sphere does not contain the agriculture, the financial enterprises, the households, the non-profit
institutions helping households, or the government institutions. This sphere produces around 60-70 percent of the
GDP. The less developed a country, the larger this share. For this group of enterprises we downloaded an EU
database which contained various data, such as the number of enterprises, the number of employed persons
within these enterprises, the value added at factor cost produced by them, and much more.7
6
According to EU statistics the following industries are parts of the competitive sphere: Mining and quarrying (NACE Rev.1.1 C),
Manufacturing (NACE Rev.1.1 D), Electricity, gas and water (NACE Rev.1.1 E), Construction (NACE Rev. 1.1 F), Distributive trades
(NACE Rev. 1.1 G), Hotels & catering (NACE Rev. 1.1 H), Transport, storage & communications (NACE Rev. 1.1 I), Real estate, renting
& business activity (NACE Rev. 1.1 K).
7
The database is as follows: ANNUAL REPORT ON EUROPEAN SMEs : DATA, Exact definitions for the indicators can be found at
http://epp.eurostat.ec.europa.eu/cache/ITY_SDDS/EN/sbs_esms.htm and in the below box.
13. Developing Country Studies www.iiste.org
ISSN 2224-607X (Paper) ISSN 2225-0565 (Online)
Vol.3, No.8, 2013
76
Figure 8: The per capita GDP (PPP) and the average enterprise size
Netherlands
Ireland
Austria
Sweden
Denmark
Belgium
UK
Germany
France
Finland
Greece
Spain
Italy
Cyprus
Slovenia
Czech Republic
Malta
Portugal
Slovakia
HUngary
Poland
Estonia
Lithuania
Latvia
Romania
BulgariaUkraine
0,0
2,0
4,0
6,0
8,0
10,0
12,0
14,0
16,0
5 000 10 000 15 000 20 000 25 000 30 000 35 000 40 000 45 000
Head/enterprise-in2011
GDP per capita (PPP = at purchasing power parity, USA dollar / head) - in 2009
The per capita GDP (PPP) and the average enterprise size
measured in employed persons
Source: Authors’ calculation from Hungarian Statistical Office and AMECO databases
The first indicator that we would like to analyse for each European country and for Ukraine is the average
enterprise size. The average enterprise size as a function of the per capita GDP (PPP) can be seen in figure 8.
The picture is striking. The assumption, the larger the enterprise size the more efficient the country only
partly stands true. As can be seen in the figure, when developed countries have a larger average enterprise size
the productivity is better, but in post-socialist countries it is opposite, the larger the average enterprise size, the
less the productivity.
The rationale behind this phenomenon can be found in the transition from the centrally planned economic model
to the market economy. In the previous socialist countries unemployment did not exist, which meant large state
owned companies employed everyone regardless of skills, competencies, or motivation. At the same time
economic activities in small private firms were constrained. This resulted in highly inefficient companies as
efficiency was only ad hoc and not a system requirement. This enterprise structure we call as quasi developed
enterprise structure. This structure seemed to be developed only in its artificial enterprises size because in
its performance it was quite underdeveloped. Therefore we will use the ‘quasi’ adjective.
If we put ownership, rivalry and competition into play, efficiency becomes a requirement. In the transition period
the post socialist countries wear in the process of tearing down their inefficient large companies. Only those
competitive units where the efficiency has increased remained alive. So this restructuring resulted in less
large companies in number, but each of them became more efficient. At the same time the tearing down resulted
in a significant decrease of average enterprise size. This is the reason why the Czech Republic, Hungary, Poland,
and Slovenia are at the bottom of the U trend and this is also the way that the quasi-developed enterprise
structure was broken down.
The different enterprise characteristics of Germany, the Netherlands, Hungary, Ukraine, and some other counties
of the Visegrád cooperation show the different components behind the aggregated enterprise size (table 4.).
According to economic strength Germany could be the role model country, but, according to size and added
value, the Netherlands should actually be the role model country for the smaller central European post-socialist
countries.
According to the data of Hungary, Ukraine, and Slovakia we see the different alternatives as to how the
transition was realized. Slovakia did not tear down the large company size structure. On the other hand, Hungary
14. Developing Country Studies www.iiste.org
ISSN 2224-607X (Paper) ISSN 2225-0565 (Online)
Vol.3, No.8, 2013
77
and Ukraine downsized their large companies. Ukraine is moving the same way that Hungary did. In 1991 the
average company size in Ukraine was 25 employees per firm. In 2010 this figure reduced to 5.8
Each international comparison is a timely comparison as well. The less developed countries depict the past and
the most developed ones indicate the future. The middle developed Slovakia, by it’s extreme development path,
also depicts the past. The U trend curve shows that the transition process probably stands somewhere in the
middle. Past quasi-developed structures have been broken down in the majority of the post socialist
countries and it is clear that these countries should devlop more large companies, which employ more
people who can then add more value. The future development should increase the average enterprise size
once again.
Table 4.: Enterprise characteristics of several European countries
Germany Netherl. Hungary Poland Czech R. Ukraine Slovakia
0-9 head 83,3% 89,7% 94,2% 96,1% 95,6% 71,3%
10-49 head 13,8% 8,6% 4,8% 2,7% 3,5% 25,3%
0-49 head 97,1% 98,2% 99,0% 98,8% 99,1% 93,7% 96,7%
50-249 head 2,4% 1,5% 0,8% 1,0% 0,7% 5,7% 2,6%
SMEs total 99,5% 99,7% 99,9% 99,8% 99,8% 99,4% 99,3%
Above 250 heads 0,5% 0,3% 0,1% 0,2% 0,2% 0,6% 0,7%
Enterprises total 100,0% 100,0% 100,0% 100,0% 100,0% 100,0% 100,0%
0-9 head 2,8 3,1 1,8 2,2 1,1 2,8
10-49 head 18,9 23,8 19,0 22,6 19,8 12,6
0-49 head 5,0 4,9 2,6 2,8 1,8 2,3 5,3
50-249 head 100,0 97,5 96,9 105,5 103,4 105,5 106,5
SMEs total 7,3 6,3 3,4 3,8 2,5 3,1 8,0
Above 250 heads 935,4 1057,2 920,1 862,4 796,0 1086,0 841,9
Enterprises total 11,9 9,2 4,7 5,7 3,8 4,9 13,8
0-9 head 133 127 16 28 19 86
10-49 head 845 1 360 287 542 439 282
0-49 head 234 235 29 43 34 12 137
50-249 head 5 731 8 695 2 075 2 787 2 472 1 201 2 402
SMEs total 366 362 46 70 52 41 197
Above 250 heads 63 327 79 998 26 389 27 147 27 162 15 110 25 664
Enterprises total 678 581 84 128 94 94 374
0-9 head 48 41 9 13 17 31
10-49 head 45 57 15 24 22 22
0-49 head 46 48 11 15 19 5 26
50-249 head 57 89 21 26 24 11 23
SMEs total 50 58 14 18 21 13 25
Above 250 heads 68 76 29 31 34 14 30
Enterprises total 57 63 18 23 25 19 27
Labour productivity (1000€ / head )
Number of enterprises in total number of enterprises (%)
Number of persons employed / number of enterprises (Head per enterprise)
Value-added at factor costs / number of enterprises (1000€ / enterprise)
Source: Authors’ calculation from Hungarian Statistical Office and AMECO databases
8
Iaroslava Stollachuk’s own estimates derived from enterprise databases of the Ukrainian CSO.
15. Developing Country Studies www.iiste.org
ISSN 2224-607X (Paper) ISSN 2225-0565 (Online)
Vol.3, No.8, 2013
78
Figure 9.: Employment and Added Value in EU countries
Source: Authors’ calculation from Hungarian Statistical Office and AMECO databases
In figure 9, it can be seen to what point the transition countries could fare so far and what kind of typical
performance groups exists in the EU. The net contributor countries have the highest performance in all aspects,
namely in the average number of persons employed, in the added value per enterprise and in the GDP per capita.
Other central countries (Belgium, Denmark, France, Ireland, and the UK) are only a little bit behind the net
contributors in every aspect, which clearly shows that this should be the path for development.
The problem becomes visual when we look at the Southern European Periphery (Cyprus, Greece, Italy, Malta,
Portugal, Spain) and the Central Eastern European Periphery (Bulgaria, Czech Republic, Hungary, Poland,
Romania, Slovakia, Slovenia). This problem appears to be twofold, first the Southern European Periphery’s
performance is so low in respect of added value, average employment, and per capita GDP, that they can not
solve the problems of the crisis, as it can be seen in the current news; secondly, the Central Eastern European
Periphery in its transition is clearly headed to the point where the Southern European Periphery is right now. For
the time being, it is difficult to see how the Central-Eastern European Periphery will make a shift in its transition
and move toward the central countries or towards the net contributors to avoid the crisis of the Southern
Periphery from its own strength.
It is quite obvious that the average enterprise size is proportional with the average value added producing ability
of enterprises. The addition of more value can be produced only by bigger enterprises, because only the bigger
enterprises are able to make the investments necessary for higher efficiency and higher volume. The profitability
is strictly determined by the enterprise size. If the rejuvenation of the competitive sphere in Central and Eastern
Europe has led to the decrease of the enterprise size, then the slowdown of the increase of income producing
ability is inevitable. So, the rejuvenation had two effects: the structural change broke down the quasi-
developed structure and has increased the productivity this way, but at the same time it decreased the
average enterprise size and through it withheld the increase of the income producing ability.
The solution to this trap could be that the Central and Eastern European countries could strengthen their
enterprise structure in the middle (increase the shares of small and medium companies) and slightly increase the
share of their large companies. That would then produce a shift towards the German and Dutch enterprise
structure. Then the larger enterprises could employ relatively more people and produce more value added, this
shift could also improve the employment and accelerate the GDP growth (see the share data and the employment
and productivity coefficients in table 4). Of course, a shift of this kind produces serious capital, especially
knowledge capital requirements.
By suggesting this kind of structural shift we are not going against smaller businesses. The micro and small
enterprises, and the medium and large enterprises are equally important workshops of development of
knowledge capital. The Slovakian economic policy, which does not take seriously enough the proper
development of SMEs, is very risky. If the pressure for higher efficiency will drive a significant part of large
companies into lower wage countries, then Slovakia will lack a serious amount of important knowledge that
could be obtained only in the practice of micro and small enterprises. The larger companies need the innovations
of micro and small enterprises are like the hungry man a slice of bread. At the same time the real innovations of
the micro and small enterprises can be tested and turned into true inventions only in medium and large
companies. As the German and Dutch structures show, there must be an equilibrium among the different
company types. Small and large companies should live in harmonic, organic unity.
Net
contributors
Centrum
Other
centrum
countries
EU total
Southern
European
periphery
Periphery
Central-
Eastern
European
periphery
0,0
2,0
4,0
6,0
8,0
10,0
12,0
15 000 20 000 25 000 30 000 35 000 40 000
Head/enterprise-in2011
GDP per capita (PPP = at purchasing power parity, USA dollar / head) - in 2009
The per capita GDP (PPP) and the average enterprise size
measured in employed persons
Net
contributors
Centrum
Other
centrum
countriesEU total
Southern-
European
periphery
Periphery
Central-
Eastern
European
periphery
0,000
0,100
0,200
0,300
0,400
0,500
0,600
0,700
15 000 20 000 25 000 30 000 35 000 40 000
MillionEuro/enterprisein2011
Per capita GDP (PPP = at purchasing power parity, in US dollars) - in 2009
Per capita GDP (PPP) and the average enterperise size
measured in produced VA at factor cost
16. Developing Country Studies www.iiste.org
ISSN 2224-607X (Paper) ISSN 2225-0565 (Online)
Vol.3, No.8, 2013
79
This relationship has obviously been distorted in Hungary in the direction of the so called necessity
entrepreneurship (look at the very high share and very low productivity of micro companies in the Hungarian
column of table 4). We regard an enterprise as a necessary enterprise if the struggle for survival is the reason
why the enterprise was created and not only for the profit. If a society is unable to organize an efficient division
of labour, then its citizens are forced to look for some money earning activities in the legal and illegal economy
and this will never result in efficient companies. If people will only extrude into necessary entrepreneurships and
nobody cares whether they will be able to exist in the niches of the larger ones, then their knowledge capital will
degenerate, and turn back to the natural economy and to the lower level of division of labour. This will cause the
development of the knowledge capital of a nation to unfold it into certain fields, but will detain it as a whole. So
in Hungary, there is still a reserve to improve its distorted enterprise structure. When the share and the number of
small, medium, and large companies increase, the necessary entrepreneurs will flow back into them.
Ukraine should not only increase the average size of enterprises, but should also enhance their capacity to the
European level through cardinal changes of entrepreneurship climate as well as through the improvement of
national policy in the field of industrial innovation through development of breakthrough industries of national
economy. This will allow the creation of essentially new conditions for SMEs development, which will orient
their activities in line with the technical, technological, and managerial potential formed by the large enterprises
and which are adequate to meet the world competitive challenge. In the world today, large enterprises continue
to occupy a leading role in the general entrepreneurial system, as they became a key organizational form of
production within which the radical innovations evolved and spread, which in turn allowed the transition to the
new technological organization of extended creation of social production.
If the enterprise structure is distorted, then the accumulated knowledge capital could be parallelized, and
could remain idle. It is not enough to accumulate knowledge capital; it must be mobilized by an appropriate
enterprise structure. This is a mutual relationship. A given structure requires appropriate knowledge capital,
while given knowledge capital only allows the creation of a structure that corresponds to it. If an engineer cannot
find a well-equipped job in a modern enterprise and must rather tinker around in a lean-to workshop, then the
country’s good education performance indicators are in vain. The knowledge capital will remain idle and the
economic performance will fall back. This problem will be magnified by the presence of the multinational firms.
Having too large a share of necessary entrepreneurship has actually become a hindrance in taking part in the
development of top products and technologies and has left this terrain to multinationals.
If, in the life of a nation the most developed products and the state of the art technologies are mainly in the hand
of the multinational capital, then one of the most important elements of knowledge capital, the spreading of
innovations, their transformation into products, services, and procedures, disappears from the life of the country
and only the knowledge necessary to the supplier role and the repetitive and non-innovative knowledge will be
developed. That country that gives up the self-reliant development of top products and top technologies in mass
production falls behind and leaves this terrain for others. If a country gives up this endeavour, then the average
enterprise size could remain low. If not, this is what will happen, the country will, at all circumstances, create its
pulling with large and medium enterprises that will increase the average enterprise size.
What we said about multinationals does not mean that we are against multinationals! It is very important to note
that the endeavour to get into the centre of development of top products and technologies does not mean that the
country doing it could create only pure domestic enterprise types. The domestic capital will have less of a chance
if it only tries to accomplish these goals alone, in complete competition with the multinational capital. Here those
joint solutions will have a very serious role in which the share of domestic capital grows compared to the shares
of the past, but the nature of the relationship remains within the borders of partnership.
Conclusion
We have analyzed the economic growth and its determining factors in countries of the European Union,
particularly in Hungary and Ukraine. We have found that the Central-Eastern European Periphery has not
finished its transition, and that this change is heading in the direction of the Southern Periphery of the European
Union. As the Southern Periphery is the area of economic crises right now, it is obvious that something should
be done in order to avoid falling to the same fate for the Central-Eastern European Periphery. We introduced a
new production function and with its help we identified the bottlenecks of growth in Hungary and Ukraine,
namely the organizational and human capital that, in its present development stage, do not correspond to the
needs of creating state of the art larger companies. The present crisis pushes both countries to postpone long-
17. Developing Country Studies www.iiste.org
ISSN 2224-607X (Paper) ISSN 2225-0565 (Online)
Vol.3, No.8, 2013
80
term developments, such as investments into human capital, and in this way makes the solution of the crisis more
difficult.
References
Aubert, Jean-Eric and his co-authors (2010): Innovation Policy, A Guide for Developing Countries, The World
Bank, Washington, D.C.,
Ádler Judit – Stocker Miklós (2012): Kompetencia alapú, outputorientált oktatás az ideális foglalkoztathatóság
érdekében, Budapesti Corvinus Egyetem, Műhelytanulmány
Bacsur Kálmán, Boda György és Virág Imre (2010): Értékteremtő emberi erőforrás menedzsment, Kézirat
Boda György – Virág Imre (2010): Ütemvakság, Közgazdasági Szemle, 2010, X. szám
Czakó Erzsébet (2009): A közszféra és a gazdaság versenyképessége, a hazai vállalatszerkezetből fakadó
következmények, Tanulmány „A közszféra és a gazdaság versenyképessége” cím_ kutatás II. szakasza (ÁSZ-FEMI − VTOA
128/08 sz. szerződés alapján) BUDAPEST, 2009. február
Edvinsson, L - Malone M.S (1997): Intellectual Capital, Harper Business, 1997
Hüttl Antónia (2011): Milyen fejlődést érhetett el a magyar gazdaság a tervgazdálkodás korában? Kézirat, 14 o.
Jánossy Ferenc (1971): The end of the economic miracle, appearance and reality, International Arts and Sciences
Press, Inc., White Plains, N.Y.
Jánossy Ferenc (1975): A gazdasági fejlődés trendvonala és a helyreállítási periódusok, Magvető Könyvkiadó,
Budapest.
Pitti Zoltán (2010a): Gazdasági teljesítmények kontra társadalmi elvárások 20 év után, Napvilág kiadó, Budapest,
2010
Pitti Zoltán (2010b): Gazdasági kórkép alulnézetből, VEZETÉSTUDOMÁNY 2 XLI. ÉVF. 2010. 6. és 9. SZÁM /
ISSN 0133-0179
Stiglitz, J. E. - Sen, A. - Fitoussi, J.P., IEP (2009): Report by the Commission on the Measurement of Economic
Performance and Social Progress, 291 pages. www.stiglitz-sen-fitoussi.fr
Ståhle, Pirjo – Ståhle, Sten (2011): Countries in Comparison Intellectual Capital Development 2001-2010, Lecture
on the TEKES conference in November 2011.
Ståhle, Pirjo – Ståhle, Sten (2012) "Towards measures of national intellectual capital: an analysis of the CHS
model", Journal of Intellectual Capital, Vol. 13 Iss: 2, pp.164 – 177
Vecsenyi János (2009): Kisvállalkozások indítása és működtetése, Budapest, 2009
Vecsenyi János (2010): A kis- és középvállalatok növekedési kihívásai. In: Harvard Business Review, 12. évf.
2010. 12.sz p. 32-41.
Virág Imre (2012): A Cobb-Douglas termelési függvény tényezőinek függetlensége, Kézirat
Databases
AMECO database [2009]:
http://ec.europa.eu/economy_finance/db_indicators/db_indicators8646_en.htm
Downloaded: the 1st of December, 2009.
GOSZKOMSZTAT HOMEPAGE, GDP data (www.gks.ru). Dowloaded the 22nd of December, 2009.
Hungarian Statistical Yearbook, 2009, Központi Statisztikai Hivatal, 2010
National Accounts of Hungary 2008-2010, Központi Statisztikai Hivatal, Budapest, 2011
In edition of Sík Endre and Szép Katalin: A háztartási termelés értéke a mai Magyarországon, Központi
Statisztikai Hivatal, Budapest, 2003
Are EU SMEs recovering from the crisis? Annual Report on EU Small and Medium sized Enterprises 2010/2011,
Rotterdam, Cambridge, 2011
ANNUAL REPORT ON EUROPEAN SMEs: DATA 2005-2012. Note: Data from 2008 onwards are estimates.
Data up to 2007 are from Eurostat's Structural Business Statistics database: Home page:
http://epp.eurostat.ec.europa.eu/portal/page/portal/european_business/special_sbs_topics/small_medium_sized_enterprises_S
MEs
Downlowded in june, 2011
http://data.worldbank.org/indicator/NY.GDP.MKTP.KD
IMD (2012) World Competitiveness Online [Online]. Available online from:
https://www.worldcompetitiveness.com/OnLine/App/Index.htm [Last access on June 29, 2012]
18. Developing Country Studies www.iiste.org
ISSN 2224-607X (Paper) ISSN 2225-0565 (Online)
Vol.3, No.8, 2013
81
UNDP (2012) International Human Development Indicators [Online]. Available online from:
http://hdr.undp.org/en/countries/ [Last access on June 30, 2012]
World Economic Forum (2012) Global Competitiveness Index 2011-2012 rankings [Online]. Available online
from: www.weforum.org/gcr [Last access on June 20, 2012]
World Economic Forum (2012) The Global Competitiveness Report 2011-2012. 554 pp. [Online]. Available
online from: http://www3.weforum.org/docs/WEF_GCR_Report_2011-12.pdf [Last access on June 29, 2012]
19. This academic article was published by The International Institute for Science,
Technology and Education (IISTE). The IISTE is a pioneer in the Open Access
Publishing service based in the U.S. and Europe. The aim of the institute is
Accelerating Global Knowledge Sharing.
More information about the publisher can be found in the IISTE’s homepage:
http://www.iiste.org
CALL FOR JOURNAL PAPERS
The IISTE is currently hosting more than 30 peer-reviewed academic journals and
collaborating with academic institutions around the world. There’s no deadline for
submission. Prospective authors of IISTE journals can find the submission
instruction on the following page: http://www.iiste.org/journals/ The IISTE
editorial team promises to the review and publish all the qualified submissions in a
fast manner. All the journals articles are available online to the readers all over the
world without financial, legal, or technical barriers other than those inseparable from
gaining access to the internet itself. Printed version of the journals is also available
upon request of readers and authors.
MORE RESOURCES
Book publication information: http://www.iiste.org/book/
Recent conferences: http://www.iiste.org/conference/
IISTE Knowledge Sharing Partners
EBSCO, Index Copernicus, Ulrich's Periodicals Directory, JournalTOCS, PKP Open
Archives Harvester, Bielefeld Academic Search Engine, Elektronische
Zeitschriftenbibliothek EZB, Open J-Gate, OCLC WorldCat, Universe Digtial
Library , NewJour, Google Scholar