The document discusses the University of Dayton's use of ikeGPS devices for geological mapping field courses. Key points:
- ikeGPS devices allow students to efficiently and accurately collect geological data in rugged environments, replacing manual methods.
- Students learn important digital skills and the technology will prepare them for industry work.
- The integrated GPS, camera, and laser rangefinder allow automatic geotagging of photos and remote data collection from safe distances.
- Data captured on ikeGPS can be automatically integrated into ArcGIS software, saving significant processing time.
Shallow Water Depth Mapping Using Single Band and Band Ratio on High-Resoluti...Luhur Moekti Prayogo
This document summarizes a study that compares the accuracy of single band and band ratio methods for shallow water depth mapping using Worldview-3 satellite imagery of the Karimunjawa Islands, Indonesia. Depth data was collected via field surveys and corrected for tides. The study found that the band ratio method, specifically the blue/green ratio, produced more accurate depth estimates with a root mean square error of 1.669 meters compared to 2.373 meters for the best single band method. Therefore, the band ratio method is concluded to provide better shallow water depth estimates than the single band method for this study area and image dataset.
This document contains a summary of Dr. Yogi N. Trivedi's work experience and qualifications. He has over 9 years of experience working on remote sensing, GIS, glaciology, and geology projects for ISRO. Currently, he works as an Executive GIS at Torrent Power in Ahmedabad, where he leads teams to update electrical network data in their GIS and SAP systems. He has a Ph.D. in Geology and has managed multiple projects involving remote sensing data analysis and GIS mapping.
IRJET - Study on Generation of Urban Heat Island with Increasing Urban Sprawl...IRJET Journal
This document summarizes a study on the generation of urban heat islands with increasing urban sprawl in Gautam Buddha Nagar district of Uttar Pradesh, India from 2014 to 2018. The study used Landsat 8 satellite data to estimate land surface temperature (LST) and analyze changes over time. LST was retrieved from brightness temperature values and land surface emissivity, which was calculated using the Normalized Difference Vegetation Index (NDVI). The results showed that continuous increase in urban sprawl from 2014 to 2018 led to higher LST over the study area, indicating the formation of urban heat islands due to loss of vegetation and expansion of built-up surfaces.
A Review of Change Detection Techniques of LandCover Using Remote Sensing Dataiosrjce
IOSR Journal of Computer Engineering (IOSR-JCE) is a double blind peer reviewed International Journal that provides rapid publication (within a month) of articles in all areas of computer engineering and its applications. The journal welcomes publications of high quality papers on theoretical developments and practical applications in computer technology. Original research papers, state-of-the-art reviews, and high quality technical notes are invited for publications.
INTEGRATION OF REMOTE SENSING DATA WITH GEOGRAPHIC INFORMATION SYSTEM (GIS): ...ijmpict
Remote Sensing and Geographic information System together comprise of Geographic Information Science (GIScience) which is a core research field that tries to emphasis on advanced geographic concepts in Geographic Information System and examines the impact of GIS on individuals and society as a whole and re-examines the themes with incorporation of most recent cognitive and Information Science. The Geographic Information System can be defined as a Computer based system and a tool, both hardware,
software and procedures, which manages geospatial data, solves spatial problems, and supports collection,
storage, transformation, analyzing, retrieving and display of data in a well desired manner. The integration
of GIS and Remote Sensing is a field of research and several implementations have been developed to gain
the maximum throughput out of these collective fields as these techniques have their own data analysis and
data representation methods. The application domain of remote sensing is from a base layer for GIS to the
development of thematic datasets, obtaining and extracting data from imagery and generation of unique
spatial datasets. In my paper I have focused on the integration of both the fields along with its usage in
Analysis and Modelling and also some models of error sources due to the integration of interface of the two
techniques. The paper also describes some error sources while integration as GIS and remote sensing both
are subject to errors and uncertainty. The paper has discussed some Change Detection Techniques used in
the modern sciences with their comparison.
The 4STAR and Satellite Data Analysis project uses ground-based and airborne sun photometer instruments to measure aerosol and trace gases in the atmosphere. In 2014, the 4STAR instrument successfully flew on 60 science flights as part of the ARISE field campaign in the Arctic, measuring aerosol optical thickness. Analysis of this 4STAR data, along with comparisons to satellite observations, is improving understanding of thin cirrus clouds in the Arctic and their impact on Earth's radiation balance. The team also improved the calibration, algorithms and error reduction for the 4STAR instrument.
Landuse landcover and ndvi analysis for halia catchmentIAEME Publication
This document summarizes a study analyzing land use/land cover changes and normalized difference vegetation index (NDVI) for the Halia catchment area in India over several decades using remote sensing data. Medium to high resolution Landsat satellite imagery from 1975, 1989, and 2001 was processed to create land use/land cover maps and NDVI maps for the area. The objective was to examine changes in cropped area and land use/land cover patterns over time and understand the implications for the local environment.
Deriving environmental indicators from massive spatial time series using open...Markus Neteler
Geospatial Analytics Forum at North Carolina State University, 4 Sept 2014 - http://geospatial.ncsu.edu/about/geoforum/
See also: http://opensource.com/education/14/9/back-school-grass-gis
The document describes a pilot study that tested the effects of combining exercise and cognitive wayfinding tasks using Google Earth. Participants cycled on a NuStep machine while navigating through an unknown city in Google Earth using a joystick. Data was collected from accelerometers, ECG, the NuStep, Google Earth coordinates and joystick movements. Results showed average watts, paths taken in Google Earth, NuStep step counts and watts, and joystick data. Future analysis will include accelerometer data, Google Earth video recordings, ratings of perceived exertion and fatigue scales.
TWO-DIMENSIONAL INVERSION FINITE ELEMENT MODELING OF MAGNETOTELLURIC DATA: CA...AM Publications
Two-dimensional resistivity analysis of magnetotelluric data has been done at “Z” geothermal area which is located in southern part of Indonesia. The objective is to understand subsurface structure beneath reasearch area based on 2-D modeling of magnetotelluric data. The inversion finite element method were used for numerical simulations which requires discretization on the boundary of the modeling domain. The modeling results of magnetotelluric data shows relativity structure dissemination: 0-10 ohm.m in a thickness of 1 km (Clay Cap), 10-100 ohm.m with 1-2 km depth respectively (reservoir zone), and on a scale of 100-1000 ohm.m in a depth of 2-3 km (heat source zone). The result of relativity structure can be used to delineate an area with geothermal prospect around 12 km2.
This document describes a study that used remote sensing and GIS techniques to analyze land use/land cover change in Dehradun District, India over a 22-year period from 1994 to 2016. Landsat satellite images from 1994, 1999, and 2016 were classified into six land use/land cover classes: vegetation, agriculture, built-up, barren, sediment, and water. The results found increases in vegetation, built-up, barren and sediment areas, and decreases in agricultural land and water bodies. The approach demonstrated the potential of remote sensing and GIS for measuring and understanding land use/land cover change dynamics over time.
This study develops an artificial neural network model to upscale instantaneous evapotranspiration (ETi) retrieved from satellites to daily evapotranspiration (ETd). The model first predicts daily shortwave radiation (RSd) from instantaneous shortwave radiation (RSi) measured at flux tower sites. It then uses the ratio of RSd to RSi to convert ETi to ETd across different ecosystems. The neural network performs well, producing a significant correlation between upscaled and observed ETd with low bias and error. However, some overestimation occurs under cloudy conditions, which is reduced by including soil moisture and rainfall data in the neural network training. The method shows robust performance compared to existing upscaling methods.
This document describes the PEER NGA-West2 ground motion database, which expands the existing NGA database to include over 21,000 additional ground motion records from 600 small-to-moderate California earthquakes as well as data from major international earthquakes since 2003. The database contains seismological metadata, processed time series, and response spectra for magnitudes ranging from 3 to 7.9 and distances from 0.05 to 1533 km. It more than doubles the size of the previous NGA database for moderate-large quakes and will be used to update ground motion prediction equations.
Mapping of Flood Analysis using GIS in Mettur River BasinIRJET Journal
This document summarizes a study that used GIS to map flood risk zones in the Mettur River Basin in India. The researchers created digital maps of factors like soil, slope, geology and geomorphology from satellite imagery in ArcGIS. They analyzed and ranked these factors based on their contribution to flooding risk. The maps were then overlaid to determine composite flood risk zones - very low, low, medium, high and very high risk. This identified the areas most prone to flooding in the basin to help decision-makers implement effective flood response and hazard mitigation. The study demonstrated that GIS is a cost-effective tool for flood monitoring and management by producing risk maps from available spatial data.
This document discusses the use of geoinformatics techniques to map and identify wastelands in Chitradurga District, Karnataka, India. The study utilized geospatial tools including topographic maps, satellite imagery from IRS-1D PAN+LISS III, and Google Earth. Vegetation, forest cover, lithological formations, soil types, and land use/land cover maps were generated to identify and delineate different categories of wastelands. The mapping found that the major causes of wasteland formation were unscientific agricultural practices and deforestation. The wasteland database provides spatial information to aid in planning sustainable reclamation and development strategies.
Evaluation of Groundwater Resource Potential using GIS and Remote Sensing App...IJERA Editor
Environment and Development are the two wheels of the cart. However, they become antagonists at some
points. It has been witnessed many a times that development is done at the cost of environment. Analysis and
assessment tools like GIS along with Remote Sensing have proved to be very efficient and effective and hence
useful for management of natural resources. Groundwater is a precious resource of limited extent. In order to
ensure a judicious use of groundwater, proper evaluation is required. There is an urgent need of planned and
optimal development of water resources. An appropriate strategy is required to develop water resources with
planning based on conjunctive use of surface and subsurface water resources. Integrated remote sensing and GIS
can provide the appropriate platform for convergent analysis of diverse data sets for decision making in
groundwater management and planning. Sustainable water resources development and management necessarily
depends on proper planning, implementation, operation and maintenance. The interpretation of remote sensing
data in conjunction with conventional data and sufficient ground truth information makes it possible to identify
and outline various ground features such as geological structures, geomorphic features and their hydrologic
characters that may serve as direct or indirect indicators of the presence of ground and surface water. Remotely
sensed data provides unbiased information on geology, geomorphology, structural pattern and recharging
conditions, which logically define the groundwater regime of an area. Groundwater resource potential has been
evaluated in Pulivendula-Sanivaripalli, Kadapa district, Andhra Pradesh, India, using remote sensing and
Geographic information system. Under this study, three thematic maps viz. Geological map (Lithology and
Structure), Geomorphological map and Hydro morphological maps were prepared. These thematic maps have
been integrated with the help of GIS. Appropriate weightage has been assigned to various factors controlling
occurrence of groundwater to assess the groundwater potential in each segment of the study area. The area has
been classified into high potential, moderate potential, low potential and non-potential zones landforms ground
water development on the basis of hydromorphological studies. Some of the favorable locations have been
suggested to impound the excessive run off so as to augment the ground water resources of the area.
Measuring water from Sky: Basin-wide ET monitoring and applicationIwl Pcu
This document discusses using remote sensing to measure evapotranspiration (ET) at the basin scale. It introduces ETWatch, an operational remote sensing model for estimating ET. ETWatch uses inputs like net radiation, soil heat flux, aerodynamic roughness, and atmospheric boundary layer parameters derived from remote sensing data. The document outlines validation of ETWatch estimates against field measurements. It also describes applications of ETWatch for water balance studies and identifying target ET for sustainable water consumption in basins like the Hai Basin in China.
Identification Of Ground Water Potential Zones In Tamil Nadu By Remote Sensin...IJERA Editor
A case study was conducted to find out the groundwater potential zones in Salem, Erode and Namakkal districts, Tamil Nadu, India with an aerial extent of 360.60 km2. The thematic maps such as geology, geomorphology, soil hydrological group, land use / land cover and drainage map were prepared for the study area. The Digital Elevation Model (DEM) has been generated from the 10 m interval contour lines (which is derived from SOI, Toposheet 1:25000 scale) and obtained the slope (%) of the study area. The groundwater potential zones were obtained by overlaying all the thematic maps in terms of weighted overlay methods using the spatial analysis tool in Arc GIS 9.3. During weighted overlay analysis, the ranking has been given for each individual parameter of each thematic map and weights were assigned according to the influence such as soil −25%, geomorphology − 25%, land use/land cover −25%, slope − 15%, lineament − 5% and drainage / streams − 5% and find out the potential zones in terms of good, moderate and poor zones with the area of 49.70 km2, 261.61 km2 and 46.04 km2 respectively. The potential zone wise study area was overlaid with village boundary map and the village wise groundwater potential zones with three categories such as good, moderate and poor zones were obtained. This GIS based output result was validated by conducting field survey by randomly selecting wells in different villages using GPS instruments. The coordinates of each well location were obtained by GPS and plotted in the GIS platform and it was clearly shown that the well coordinates were exactly seated with the classified zones.
The document discusses the importance of spatial data integrity in oil and gas exploration. It provides examples of how failures in spatial data integrity, such as using incorrect coordinate reference systems, can lead to significant costs and issues. Spatial data is critical in exploration activities from seismic surveying and well positioning to infrastructure construction. The case study of the SIS A #1 gas discovery in South Sesulu, Indonesia illustrates how maintaining spatial data integrity from the beginning of exploration played a role in the project's success.
This document discusses how geographic information systems (GIS) can be used to plan and site solar energy projects. It describes Eolfi, a company that develops solar and wind projects. GIS tools like spatial analysis and elevation data are used to identify optimal locations based on slope, aspect, shadows, environmental constraints, and grid connectivity. The GIS model enables evaluation of potential sites and informs siting decisions to reduce costs and environmental impacts. In conclusion, the document states that GIS provides a practical and reliable way to map suitable areas and make more efficient siting decisions.
This infographic compares cardio (cardiovascular endurance training) exercise to P.A.C.E. (Progressively Accelerating Cardiopulmonary Exertion). It claims that over 70,000 people have adopted the "anti-cardio" lifestyle of P.A.C.E. P.A.C.E. is described as transforming the body and promoting lifelong health, leanness and activity, while cardio is said to be dangerous and misguided. Across multiple metrics of muscle mass, fat burning, lung and heart health, immunity, joints, biological age, fitness duration and sexual health, P.A.C.E. is claimed to be superior or less strenuous
The nervous system data report contains results from 6 trials measuring reaction times of the right and left hands to catch objects placed at different distances. The right hand averaged 13.3 cm for where caught and 12 seconds for reaction time. The left hand averaged 12.416 cm for where caught and 61 seconds for reaction time, demonstrating slower reaction times compared to the right hand.
Vega cp vs kath 33 deg covering remote villageCarlos Yañez
Vega CP12 Antenna Trial Report summarizes the results of replacing a traditional panel antenna with a Vega CP12 parabolic antenna to improve coverage for two outlying villages. Measurements found that the Vega CP12, with its high gain and narrow beam, increased signal levels by 10-20 dB in the target villages. It was able to cost-effectively provide coverage to the low-density, remote areas without significantly impacting neighboring sectors. The Vega CP12 demonstrated its ability to address coverage needs for small, distant communities with a single sector.
The document summarizes the key human body systems including:
1) The sensory organs (eyes, ears, nose, tongue, skin) and how they receive stimuli from the environment and transmit messages to the brain.
2) The nervous system, made up of the central nervous system (brain and spinal cord) and peripheral nervous system, which interprets sensory messages and coordinates responses.
3) The skeletal and muscular systems, with bones providing structure, joints allowing movement, and muscles enabling movement when signaled by the nervous system.
The document discusses an ELISA workshop where students learned about using enzyme linked immunosorbent assays to detect diseases. ELISA uses antibodies to identify antigens by attaching primary antibodies to antigens in a sample, and secondary antibodies attach to the primary antibodies to produce a color change indicating the presence of the antigen being tested for. The workshop involved using ELISA to identify which person was transporting a simulated infectious agent by detecting the antigen in their sample.
The document discusses the importance of metals in daily life. It notes that the discovery of metals marked an important milestone in human civilization, as metals allow for the creation of machines that reduce the work of humans and enable modern facilities. Some key metals discussed include iron, which is used in window bars, tools, nails, machine parts, and construction; aluminum for utensils, wiring, furniture, and packaging; and copper, zinc, chromium, nickel, tin, gold, silver, and lead, which each have various applications.
This document discusses different types of plants and their parts and uses. It explains that plants need water, air, and sun to grow and get water through their roots and air through their leaves. It describes trees, bushes, grass, deciduous and evergreen trees. It also discusses that woods and forests provide habitat for plants and animals and that some plants produce fruit, nuts, and seeds that can be eaten. Finally, it lists some uses of plants like making wood, paper, clothes, perfume, medicines, and food.
Tidelands Geophysical uses ikeGPSTM mobile GIS systems to efficiently map potential hazards for onshore seismic surveys. Field crews can record locations and photos of obstructions like houses from a distance without trespassing. This allows for more accurate mapping than older systems and less need for re-surveying lines. The ikeGPSTM also streamlines data transfer and processing, saving Tidelands both time and money over previous methods.
The US Army Corps of Engineers used ikeGPS to map buried infrastructure and ensure there were no explosive hazards at a former ammunition plant site in Joliet, Illinois that was being converted to a nature reserve. ikeGPS allowed efficient data collection from a safe distance and seamlessly integrated with ESRI software. Over 791 points were captured in four visits, helping produce comprehensive digital maps of the area. ikeGPS significantly reduced time in contaminated areas and its compatibility with ArcGIS and ArcPad allowed customized data collection.
Mangrove Vegetation Mapping Using Sentinel-2A Imagery Based on Google Earth E...Luhur Moekti Prayogo
Mangroves are trees whose habitat is affected by tides, and their presence has decreased from year to year. Today, mapping technology has undergone many developments, including the availability of images of various resolutions and cloud-based image processing. One of the popular platforms today is the Google Earth Engine. Google Earth Engine is a cloud-based platform that makes it easy to access high-performance computing resources for extensive processing. The advantage of using Google Earth Engine is that users do not have to be IT experts without experts in application development, WEB programming, and HTML. This study aims to conduct a study on mangrove mapping in Gili Genting District with Sentinel-2A imagery using a Google Earth Engine. This location was chosen since there are still many mangroves, especially on the Gili Raja and Gili Genting Islands. From this research, it can be concluded that cloud computing-based Sentinel-2A image processing shows that the vegetation value of NDVI results ranges from -0.923208 to 0.75579. The classification results show that mangrove forests' overall presence on Gili Genting Island is more expansive than Gili Raja Island with 16.74 ha and 14.75 ha. The use of the Google Earth Engine platform simplifies the analysis process because image processing can be done once with various scripts so that analysis becomes faster.
This document summarizes a study that evaluated the accuracy of GPS and automatic level instruments for topographic surveying. The study collected elevation data using both instruments at points in a study area in Iraq. The data was input into GIS software to create contour maps and digital elevation models (DEMs) from each dataset. The accuracy of the DEMs was then evaluated and compared. The results showed the effect that the source data, DEM resolution, and ground control point distribution had on accuracy. This allowed the study to assess the relative accuracy and effectiveness of GPS versus automatic leveling for topographic data collection and DEM generation.
This document summarizes a study that evaluated the accuracy of GPS and automatic level instruments for topographic surveying. Researchers collected elevation data for 25 points in the study area using both a GPS receiver and an automatic level. They then used ArcGIS to create contour maps and digital elevation models from each dataset. The results showed that the GPS data had lower standard deviation and was therefore more accurate than the automatic level data. However, automatic leveling remains a cost-effective method for small study areas. The integration of GPS and GIS techniques allows for efficient processing and analysis of spatial data to produce high accuracy topographic maps and DEMs.
This document summarizes a project comparing elevation data from GPS points collected in the field to elevation data from the Shuttle Radar Topography Mission (SRTM). The project involved 4 stages: 1) planning the project, 2) collecting GPS data on 3 occasions, 3) post-processing and comparing the GPS and SRTM data, and 4) creating a presentation. Maps were made showing the interpolated GPS surface and differences between GPS and SRTM elevations. On average, SRTM elevations differed from GPS by 4.35 meters with a standard deviation of 2.93 meters, consistent with other studies. The document also lists GIS labs and tools used in the project.
Plant City, Florida needed to inventory its infrastructure assets to support planning and emergency management. It selected the ikeGPS205 to quickly and safely capture data on stormwater, roads, and sewers. Using ikeGPS doubled the productivity of field inspectors and improved data accuracy and sharing across departments. The success of ikeGPS led other city departments to adopt the technology for their asset management needs.
This document discusses emerging lidar technologies for use in 3DEP, the USGS 3D Elevation Program. It provides an overview of 3DEP and its goals of providing high-quality topographic data. Emerging technologies discussed include Geiger-mode lidar and single photon lidar. Test projects using these technologies have been conducted in Illinois, South Dakota, and North Carolina to help advance the technologies. The document outlines guidelines for evaluating the quality and accuracy of data from these sensors.
This document compares three methods for mapping land cover of Vaderahalli Village, India: analysis of satellite imagery using GIS software MapInfo, analysis of Google Earth images using Google Pro software, and analysis of Google Earth images using MATLAB software. Land cover features mapped included green cover, water bodies, open spaces, paved surfaces and built-up areas. Results from each method were verified on-site using GPS. Analysis with MapInfo using satellite imagery provided the most accurate results but was more expensive and complex. Google Pro analysis was less accurate but simpler and cheaper. MATLAB analysis was least accurate and most complex and time-consuming. Overall, remote sensing with GIS provided the most effective land cover mapping approach.
This document describes an integrated teaching approach between an university earth sciences department and an industry partner. Students conducted a senior geophysics project that involved acquiring seismic and electrical field data. The project provided students experience with industrial-grade equipment and standards. It also helped the university meet industry's needs for qualified graduates and gave the industry exposure to potential hires. Overall, the project enhanced student learning through real-world experience in data acquisition while also strengthening university-industry cooperation.
Satria Yudha Pratama is a geophysicist with 7 years of experience in seismic data processing and acquisition. He has skills in acquisition, basic and advanced processing using various software, and subsurface data analysis. He is dynamic, a fast learner, hard worker, and able to perform well as part of a team or individually.
The document introduces GeoEverything, which uses location-aware devices and geotagging to determine the physical location of people, places, and objects. This allows content to be mapped and searched by location. Examples of how GeoEverything could be used in higher education include mashups that combine map data with educational content to create interactive lessons, and simulated games using handheld GPS devices. Some issues with GeoEverything include privacy, intellectual property, data storage, and file size.
This document analyzes stereoscopic 3D geological mapping methods using Cardinal and Esri software systems. It discusses how the Utah Geological Survey and some colleges use the VrOne and VrTwo 3D software from Cardinal Systems to explore, map, and edit areas of geological interest in stereoscopic 3D. This allows for unique observation of elevation and features. The maps are then digitized in 3D, edited, and finished in ArcMap to create 2D geological maps. These maps are field checked and compared to other maps created through different methods to evaluate their accuracy and precision. The document outlines the procedures, field and editing methods, and results of using the Cardinal 3D system for mapping, including both benefits like extensive pre-
This article discusses how geomatics engineers can shape the future of geospatial information in Nepal to support sustainable development. Geospatial technologies have great potential to inform policymaking, planning, infrastructure development, and resource management. However, Nepal has not fully utilized geospatial information due to a lack of quality data, techniques, and methods. The author argues that geomatics engineers should work with government, businesses, producers, and users to develop geospatial information and apply it towards sustainable development goals in Nepal. International geospatial organizations should also support these efforts.
This article discusses the evolution of GIS towards web-based systems enabled by advances in internet and communication technologies. It defines web GIS as the process of designing, implementing, generating and delivering maps on the world wide web. Both open source and commercial web GIS technologies are now available, allowing for distributed, heterogeneous systems where data is stored on servers and accessed by clients via the internet. Web GIS has increased public access to maps and demonstrated strong growth. Its ability to combine data sources and perform GIS functions remotely makes it a robust system for group participation and decision making.
This document provides an overview of geospatial technology and its applications. It defines geospatial technology as a suite of technologies including GIS, remote sensing, and GPS that help capture, store, process and display spatially-referenced data. It describes new courses and an A.A.S. in Geospatial Technology offered at BCC, as well as internship opportunities with various organizations. It also discusses how geospatial technology is an emerging high-growth field and how the BCC Geospatial Center provides students opportunities to learn skills for careers in this field.
Fr1-T104-Ramdani-LECTURING ON SATELLITE IMAGERY PROCESSING AND GIS.pptxgrssieee
This document summarizes lectures on satellite imagery processing and GIS using open source software over the internet. It discusses using ILWIS and MapWindow GIS software to teach remote sensing and GIS concepts to students. A case study showed that 90 minute lectures were most effective for teaching materials and getting student feedback. Example applications demonstrated using the software for environmental monitoring, urban planning, and land use/land cover mapping in Indonesia. The document concludes that open source software is recommended for instruction due to low cost and ease of use, but may have stability issues on low-spec computers.
University department chair promotes the value the surveying profession provides society, by Don Talend, brand storytelling, content strategy and demand generation expert. Geospatial industry
Land use land cover mapping for smart village using gisSumit Yeole
This document summarizes a presentation on land use and land cover mapping for a smart village in India using GIS. The objectives were to understand GIS and remote sensing technologies and their applications in precision agriculture. The presenter described collecting satellite imagery, classifying land use types, and mapping them for the village of Kundewadi to identify agriculture, settlements, vegetation, water bodies and other land types. Pie charts showed the results, which found people primarily used the land for agriculture and suggested ways to improve wastewater, groundwater, solid waste management and increase agriculture land and trees.
This document summarizes three case studies that used remote sensing and GIS techniques to analyze land use and land cover change over time. The first case study analyzed changes from 1990-2010 in Hawalbagh, India using Landsat imagery. It found increases in built-up land and decreases in barren land. The second studied coastal Egypt from 1987-2001 using Landsat, identifying 8 land cover classes. The third examined Simly watershed, Pakistan from 1992-2012 using Landsat and SPOT data, finding increases in agriculture and decreases in vegetation. All three used supervised classification and post-classification comparison to analyze land use/cover changes.
Programming Foundation Models with DSPy - Meetup SlidesZilliz
Prompting language models is hard, while programming language models is easy. In this talk, I will discuss the state-of-the-art framework DSPy for programming foundation models with its powerful optimizers and runtime constraint system.
AI 101: An Introduction to the Basics and Impact of Artificial IntelligenceIndexBug
Imagine a world where machines not only perform tasks but also learn, adapt, and make decisions. This is the promise of Artificial Intelligence (AI), a technology that's not just enhancing our lives but revolutionizing entire industries.
Threats to mobile devices are more prevalent and increasing in scope and complexity. Users of mobile devices desire to take full advantage of the features
available on those devices, but many of the features provide convenience and capability but sacrifice security. This best practices guide outlines steps the users can take to better protect personal devices and information.
Let's Integrate MuleSoft RPA, COMPOSER, APM with AWS IDP along with Slackshyamraj55
Discover the seamless integration of RPA (Robotic Process Automation), COMPOSER, and APM with AWS IDP enhanced with Slack notifications. Explore how these technologies converge to streamline workflows, optimize performance, and ensure secure access, all while leveraging the power of AWS IDP and real-time communication via Slack notifications.
Best 20 SEO Techniques To Improve Website Visibility In SERPPixlogix Infotech
Boost your website's visibility with proven SEO techniques! Our latest blog dives into essential strategies to enhance your online presence, increase traffic, and rank higher on search engines. From keyword optimization to quality content creation, learn how to make your site stand out in the crowded digital landscape. Discover actionable tips and expert insights to elevate your SEO game.
How to Interpret Trends in the Kalyan Rajdhani Mix Chart.pdfChart Kalyan
A Mix Chart displays historical data of numbers in a graphical or tabular form. The Kalyan Rajdhani Mix Chart specifically shows the results of a sequence of numbers over different periods.
Digital Marketing Trends in 2024 | Guide for Staying AheadWask
https://www.wask.co/ebooks/digital-marketing-trends-in-2024
Feeling lost in the digital marketing whirlwind of 2024? Technology is changing, consumer habits are evolving, and staying ahead of the curve feels like a never-ending pursuit. This e-book is your compass. Dive into actionable insights to handle the complexities of modern marketing. From hyper-personalization to the power of user-generated content, learn how to build long-term relationships with your audience and unlock the secrets to success in the ever-shifting digital landscape.
Cosa hanno in comune un mattoncino Lego e la backdoor XZ?Speck&Tech
ABSTRACT: A prima vista, un mattoncino Lego e la backdoor XZ potrebbero avere in comune il fatto di essere entrambi blocchi di costruzione, o dipendenze di progetti creativi e software. La realtà è che un mattoncino Lego e il caso della backdoor XZ hanno molto di più di tutto ciò in comune.
Partecipate alla presentazione per immergervi in una storia di interoperabilità, standard e formati aperti, per poi discutere del ruolo importante che i contributori hanno in una comunità open source sostenibile.
BIO: Sostenitrice del software libero e dei formati standard e aperti. È stata un membro attivo dei progetti Fedora e openSUSE e ha co-fondato l'Associazione LibreItalia dove è stata coinvolta in diversi eventi, migrazioni e formazione relativi a LibreOffice. In precedenza ha lavorato a migrazioni e corsi di formazione su LibreOffice per diverse amministrazioni pubbliche e privati. Da gennaio 2020 lavora in SUSE come Software Release Engineer per Uyuni e SUSE Manager e quando non segue la sua passione per i computer e per Geeko coltiva la sua curiosità per l'astronomia (da cui deriva il suo nickname deneb_alpha).
HCL Notes und Domino Lizenzkostenreduzierung in der Welt von DLAUpanagenda
Webinar Recording: https://www.panagenda.com/webinars/hcl-notes-und-domino-lizenzkostenreduzierung-in-der-welt-von-dlau/
DLAU und die Lizenzen nach dem CCB- und CCX-Modell sind für viele in der HCL-Community seit letztem Jahr ein heißes Thema. Als Notes- oder Domino-Kunde haben Sie vielleicht mit unerwartet hohen Benutzerzahlen und Lizenzgebühren zu kämpfen. Sie fragen sich vielleicht, wie diese neue Art der Lizenzierung funktioniert und welchen Nutzen sie Ihnen bringt. Vor allem wollen Sie sicherlich Ihr Budget einhalten und Kosten sparen, wo immer möglich. Das verstehen wir und wir möchten Ihnen dabei helfen!
Wir erklären Ihnen, wie Sie häufige Konfigurationsprobleme lösen können, die dazu führen können, dass mehr Benutzer gezählt werden als nötig, und wie Sie überflüssige oder ungenutzte Konten identifizieren und entfernen können, um Geld zu sparen. Es gibt auch einige Ansätze, die zu unnötigen Ausgaben führen können, z. B. wenn ein Personendokument anstelle eines Mail-Ins für geteilte Mailboxen verwendet wird. Wir zeigen Ihnen solche Fälle und deren Lösungen. Und natürlich erklären wir Ihnen das neue Lizenzmodell.
Nehmen Sie an diesem Webinar teil, bei dem HCL-Ambassador Marc Thomas und Gastredner Franz Walder Ihnen diese neue Welt näherbringen. Es vermittelt Ihnen die Tools und das Know-how, um den Überblick zu bewahren. Sie werden in der Lage sein, Ihre Kosten durch eine optimierte Domino-Konfiguration zu reduzieren und auch in Zukunft gering zu halten.
Diese Themen werden behandelt
- Reduzierung der Lizenzkosten durch Auffinden und Beheben von Fehlkonfigurationen und überflüssigen Konten
- Wie funktionieren CCB- und CCX-Lizenzen wirklich?
- Verstehen des DLAU-Tools und wie man es am besten nutzt
- Tipps für häufige Problembereiche, wie z. B. Team-Postfächer, Funktions-/Testbenutzer usw.
- Praxisbeispiele und Best Practices zum sofortigen Umsetzen
Taking AI to the Next Level in Manufacturing.pdfssuserfac0301
Read Taking AI to the Next Level in Manufacturing to gain insights on AI adoption in the manufacturing industry, such as:
1. How quickly AI is being implemented in manufacturing.
2. Which barriers stand in the way of AI adoption.
3. How data quality and governance form the backbone of AI.
4. Organizational processes and structures that may inhibit effective AI adoption.
6. Ideas and approaches to help build your organization's AI strategy.
Unlock the Future of Search with MongoDB Atlas_ Vector Search Unleashed.pdfMalak Abu Hammad
Discover how MongoDB Atlas and vector search technology can revolutionize your application's search capabilities. This comprehensive presentation covers:
* What is Vector Search?
* Importance and benefits of vector search
* Practical use cases across various industries
* Step-by-step implementation guide
* Live demos with code snippets
* Enhancing LLM capabilities with vector search
* Best practices and optimization strategies
Perfect for developers, AI enthusiasts, and tech leaders. Learn how to leverage MongoDB Atlas to deliver highly relevant, context-aware search results, transforming your data retrieval process. Stay ahead in tech innovation and maximize the potential of your applications.
#MongoDB #VectorSearch #AI #SemanticSearch #TechInnovation #DataScience #LLM #MachineLearning #SearchTechnology
TrustArc Webinar - 2024 Global Privacy SurveyTrustArc
How does your privacy program stack up against your peers? What challenges are privacy teams tackling and prioritizing in 2024?
In the fifth annual Global Privacy Benchmarks Survey, we asked over 1,800 global privacy professionals and business executives to share their perspectives on the current state of privacy inside and outside of their organizations. This year’s report focused on emerging areas of importance for privacy and compliance professionals, including considerations and implications of Artificial Intelligence (AI) technologies, building brand trust, and different approaches for achieving higher privacy competence scores.
See how organizational priorities and strategic approaches to data security and privacy are evolving around the globe.
This webinar will review:
- The top 10 privacy insights from the fifth annual Global Privacy Benchmarks Survey
- The top challenges for privacy leaders, practitioners, and organizations in 2024
- Key themes to consider in developing and maintaining your privacy program
Skybuffer SAM4U tool for SAP license adoptionTatiana Kojar
Manage and optimize your license adoption and consumption with SAM4U, an SAP free customer software asset management tool.
SAM4U, an SAP complimentary software asset management tool for customers, delivers a detailed and well-structured overview of license inventory and usage with a user-friendly interface. We offer a hosted, cost-effective, and performance-optimized SAM4U setup in the Skybuffer Cloud environment. You retain ownership of the system and data, while we manage the ABAP 7.58 infrastructure, ensuring fixed Total Cost of Ownership (TCO) and exceptional services through the SAP Fiori interface.
Fueling AI with Great Data with Airbyte WebinarZilliz
This talk will focus on how to collect data from a variety of sources, leveraging this data for RAG and other GenAI use cases, and finally charting your course to productionalization.
In the rapidly evolving landscape of technologies, XML continues to play a vital role in structuring, storing, and transporting data across diverse systems. The recent advancements in artificial intelligence (AI) present new methodologies for enhancing XML development workflows, introducing efficiency, automation, and intelligent capabilities. This presentation will outline the scope and perspective of utilizing AI in XML development. The potential benefits and the possible pitfalls will be highlighted, providing a balanced view of the subject.
We will explore the capabilities of AI in understanding XML markup languages and autonomously creating structured XML content. Additionally, we will examine the capacity of AI to enrich plain text with appropriate XML markup. Practical examples and methodological guidelines will be provided to elucidate how AI can be effectively prompted to interpret and generate accurate XML markup.
Further emphasis will be placed on the role of AI in developing XSLT, or schemas such as XSD and Schematron. We will address the techniques and strategies adopted to create prompts for generating code, explaining code, or refactoring the code, and the results achieved.
The discussion will extend to how AI can be used to transform XML content. In particular, the focus will be on the use of AI XPath extension functions in XSLT, Schematron, Schematron Quick Fixes, or for XML content refactoring.
The presentation aims to deliver a comprehensive overview of AI usage in XML development, providing attendees with the necessary knowledge to make informed decisions. Whether you’re at the early stages of adopting AI or considering integrating it in advanced XML development, this presentation will cover all levels of expertise.
By highlighting the potential advantages and challenges of integrating AI with XML development tools and languages, the presentation seeks to inspire thoughtful conversation around the future of XML development. We’ll not only delve into the technical aspects of AI-powered XML development but also discuss practical implications and possible future directions.
1. Surveylab Case Study
Industry: Environmental – Geologic Mapping
ikeGPS solution: ikeGPS205
User: Department of Geology, University of Dayton, Ohio, USA
Safe and easy geological mapping in challenging
environments now part of University of Dayton
Geology curriculum
Dr. Allen McGrew, Chair of the Geology Department at the University of Dayton in New Zealand, recording geologic data in the field using a handheld ikeGPS205 unit
(image courtesy Brian Joyce).
Over are the days of manual calculations, wet notebooks and wandering in precarious weather and
locations on geology field trips. With today’s advances in field mapping technology, only one rugged
handheld GPS system is required to map geological features, take field notes and efficiently link the
captured data to an office master database. The University of Dayton in Ohio, USA, has been successfully
trialling and using ikeGPS205 for field and course work since 2009. The remarkably integrated and
simple-to-use features of Surveylab’s ikeGPS and its remote data capture capabilities from a single
location have contributed to help students visualize geologic processes, while speeding the fieldwork data
post-processing and mapping stages. ikeGPS assists in consistently collecting reliable field data in rugged
environments. By teaching students the latest field mapping technologies, the University of Dayton is
preparing more and more students to the workforce each year.
Integrating new GPS technologies in the Department of Geology curriculum
Field trips have always been the highlight of any Earth Science course. Students can see for themselves
evolving landscapes and how the underlying geology shapes and influences the surface environment.
At university level, geology students are taught how to identify different geologic formations, measure
and record how and where they occur.
Traditional data collection of surface and sub-surface geologic formations and capturing standard
structural geologic data such as pitch, strike and dip is still mostly carried out with analog instruments
such as the Brunton compass. And, as with most manual procedures, errors can and do enter into
the equation.
ikeGPS website - CS Geological Final Ex Comments 1|6 January 2011
2. Surveylab Case Study
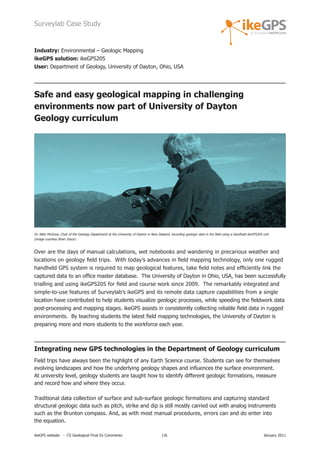
Dr. Allen McGrew, Chair of the Geology Department at the University of Dayton, was wanting to bank
on new GPS technology to enable faster and accurate methods for capturing precise location data on
geology fieldtrips. This was also to better train and equip students for a new era in field studies through
the linking of a newly developed graduate certificate program in Geographic Information Systems
(GIS) and majors in geology and environmental geology offered by the Department of Geology
at the University of Dayton.
“We like students to know exactly what they are doing when they take field measurements with
analog instruments. But once they understand the process, it is much faster to use a digital data
capture device…. And, of course, once they graduate and start working in the industry, they’ll be
using digital units. It is essential that we train them on the most up-to-date technology.”
“We acquired our first ikeGPS205 units primarily for field research,” says Dr. McGrew, “but we quickly
saw their potential as a teaching tool. We are presently in the process of upgrading to the ikeGPS1000”.
Data integration is key for understanding an area’s geology
After experimenting with the ikeGPS for fieldwork in Nevada and Colorado during the summer of
2009, Dr. McGrew worked with University of Dayton colleagues Dan Goldman and Umesh Haritashya
to organise a New Zealand field course in May 2010 with 11 students. Not only would they employ
ikeGPS to train students in field data capture techniques, but they would also meet the Wellington-
based Surveylab developers of ikeGPS to receive advanced training and expert advice on how to
get the most out of the units.
The ikeGPS205 units trialled in New Zealand included a built-in digital compass-inclinometer, a 3.2
megapixel digital camera that can geo-tag digital images as well as a laser range finder for capturing
precise location data for features up to 1000 meters away. ikeGPS units are also optimized for fast
data capture and pre-processing in the field.
“In addition to [ikeGPS] being an all-purpose geological field mapping tool for locating the position of rock
units in the field, we can also collect geo-referenced field photographs, field notes on our observations
at the sites of interest and use the compass-inclinometer to measure and record orientations of linear
or planar features in the rocks (such as bedding planes, fold hingelines, fault surfaces, etc). The data is
then imported automatically into ArcGIS, thus building our geologic map as we work and allowing us to
visualize and interpret the results. We also use ikeGPS to document the field context of localities where
we collect samples,” says Dr McGrew.
“We expect to use ikeGPS to measure and photograph complete, georeferenced stratigraphic sequences
in sedimentary rocks,” continues Dr. McGrew. “These are all basic aspects of the practice of field geology.
The basic raw data can be utilized in a wide variety of ways depending on the situation - to build a
geologic history of an area, to delineate the large-scale structure of an area (which may be important in
hydrocarbon exploration or even geothermal prospecting), to map ore bodies or to evaluate geohazards
such as landslides, etc.”
“Being able to take digital maps into the field and then correlate the data that we capture to those maps
helps students to visualize the processes,” says Anthony Asher, a recent graduate and a teaching assistant
for the New Zealand field course, as well as one of the first students to pursue the new GIS certificate
program. “Plus the ability to capture images of particular formations and outcrops and place them
digitally on the map is a big bonus.”
ikeGPS website - CS Geological Final Ex Comments 2|6 January 2011
3. Surveylab Case Study
ESRI’s ArcGIS system integration facilitates field data post-processing
The ArcPad Application Builder integrated in ikeGPS gives users the opportunity to develop their
own specialized field data capture applications and customise data entry forms to suit their purpose.
Surveylab, as an ESRI Business Partner, worked closely with ESRI’s New Zealand’s distributor Eagle
Technology Group, to ensure the ikeGPS series would be 100% compatible with ArcPad. “We immediately
saw the value of Surveylab’s vision,” says Matt Lythe, GIS Sales Manager at Eagle Technology Group.
“We advised Surveylab’s developers as they customized the APIs between ArcPad and their firmware
so ArcPad would run seamlessly on the units. In addition we helped them develop methodologies to
help their clients use ArcPad Application Builder to create forms for faster, more accurate attribute
data capture in the field.”
Having ArcPad running natively on GPS units facilitates the time-consuming tasks of uploading
and downloading data. “Being able to synchronise the data directly from ArcPad into ArcGIS saves
tremendous amounts of time back in the office by eliminating the manual digitizing of line work and
the transcription of field data and notations,” says McGrew. “Again, we like the students to know the
background processes, but once they understand the basics, we can focus on teaching geology instead
of spending time manually capturing and transcribing field notations.”
Upon their return from the New Zealand field trip, the University of Dayton glaciologist, Dr. Haritashya,
created an exercise using satellite imagery compiled in ArcGIS to document the glaciers’ rapid retreat
in historical times. “When we return in the future we will be able to overlay our own newly-captured
geo-referenced images to document exactly how much the glaciers have receded. It is this type of
real-time graphic display that really makes geology come alive for students,” says McGrew.
ikeGPS website - CS Geological Final Ex Comments 3|6 January 2011
4. Surveylab Case Study
University of Dayton students on a field trip around Mt Cook in New Zealand. ikeGPS205 was used in constantly changing weather conditions and dangerous environments.
The users obtained consistent data capture results, enjoyed continuous GPS signals and remained safe at all times.
Consistent unit performance in rugged environments
During a one-month geology field course, ikeGPS units were trialled in typical New Zealand conditions.
“We had warm sunshine, mist, rain, sleet and snow,” notes Dr. McGrew, “and that was just in one
morning! One of the challenges we expected in such weather was losing the GPS signal, but at Mt.
Cook, I hiked up to Sealy Tarns, high above both the Mueller and Hooker Glaciers in heavy snow and
densely overcast conditions and never lost the GPS signal once. On another occasion, Dr. Haritashya
and I were able to map a terminal moraine position using the laser range finder. I was surprised at how
well the range finder worked, even under misty conditions, returning data – including images - on many
different features from a single location. We also appreciated the fact that we didn’t have to write down
field notes in the cold rain.”
Fast and safe data capture in potentially dangerous locations
Another advantage of using the ikeGPS units in the field is the ability of the laser rangefinder to capture
data under overhangs or in heavy foliage. “In the field we follow rock exposures up hills, down slopes and
under overhangs,” says Dr. McGrew. “With ikeGPS, we can stand near the bottom of a cliff and capture
stratigraphic contacts without climbing. Not only is this faster but safer. In addition, cliffs sometimes block
the GPS signal. With ikeGPS, we can step back to obtain a signal and then use the laser rangefinder to
locate the position we are interested in at the base of the cliff.”
ikeGPS website - CS Geological Final Ex Comments 4|6 January 2011
5. Surveylab Case Study
More students will benefit from using ikeGPS
Dr McGrew plans to incorporate ikeGPS into more and more of the Department’s coursework as they gain
more experience. “It is very exciting to be able to incorporate the benefits of the ikeGPS unit into our
teaching,” he says. “Learning how to capture geologic data in the field is a crucial aspect of our student’s
training. Any technology we can apply that makes it faster, easier, safer and more accurate will be a big
help in our fieldwork. We’ll take some of the data we captured on our New Zealand field trip and process
it during the upcoming semesters. And, if all goes well, we’ll capture even more data next summer.
I myself plan to take the units into the field for my research and expect to train even more students
on how to operate the ikeGPS alongside ArcPad.”
“I think that the ikeGPS1000 is going to be an extremely useful piece of equipment for geological field
mapping,” concludes McGrew. “I still have some questions and problems to resolve, but it performs
much better than any other handheld GPS unit we’ve used. I’m looking forward to using it on more
sustained projects.”
Dr. Allen McGrew reviews geo-referenced photos in the field at the historic Chaffey Hut in the Cobb Valley (image courtesy Dan Goldman).
AT A GLANCE
Key reasons Department of Geology at University of Dayton selected the ikeGPS205 unit
• Ease-of-use and integrated features into a single handheld rugged device
• Laser rangefinder allowing data capture for multiple points from a distance, from a single and safe location
• Compatibility and seamless integration with ESRI’s ArcGIS and ArcPad
• Knowledgeable staff and expert support
Key benefits
• Enhanced GPS field capture capabilities to help students visualize geologic processes
• Teaching students with the latest technology to prepare them for the workforce
• Integration between ikeGPS205 and ArcGIS speeds up the geologic mapping process and data post-processing
• Consistent unit performance in rugged environments
• Fast and safe data capture in potentially dangerous locations
ikeGPS website - CS Geological Final Ex Comments 5|6 January 2011
6. Surveylab Case Study
Technology used
• ikeGPS205 series GPS data collection unit from Surveylab
• ESRI ArcGIS
• ArcPad Mobile GIS software
Customer quote:
“We acquired our first ike205 units primarily for field research,” says Dr. McGrew, “but we quickly saw
their potential as a teaching tool. We are presently in the process of upgrading to the ikeGPS1000…
It performs much better than any other handheld GPS unit we’ve used”.
- Dr. Allen McGrew, Chair of the Geology Department at the University of Dayton
For more information please contact:
Richard Taylor
Vice President - ikeGPS Americas
richard.taylor@ikegps.com
office: (281) 681 0356
fax: (281) 681 9252
www.ikeGPS.com
Dr. Allen J. McGrew, Chair
Department of Geology
The University of Dayton
(397) 229-3455
Allen.mcgrew@notes.udayton.edu
Matt Lythe
GIS Sales Manager
Eagle Technology Group
Wellington, NZ
+64-4-802-1400 / Matt_lythe@eagle.co.nz
www.eagle.co.nz
ikeGPS website - CS Geological Final Ex Comments 6|6 January 2011