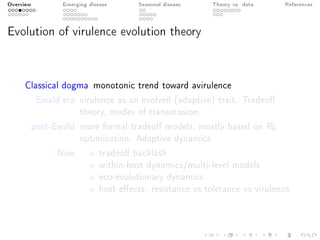
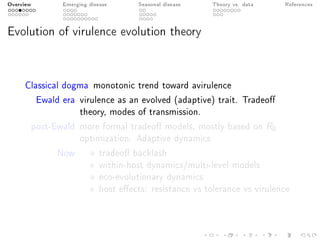
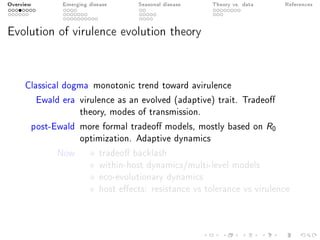
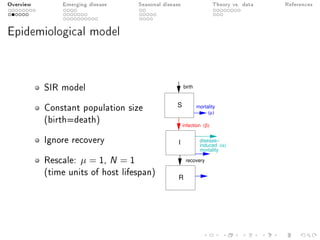
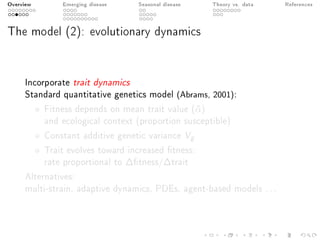
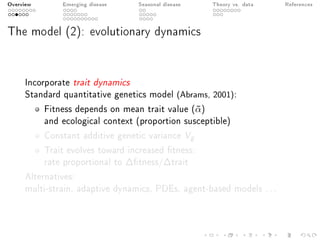
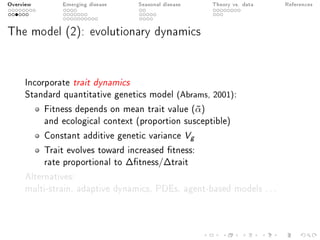
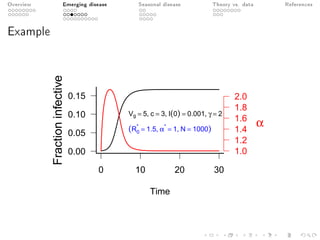
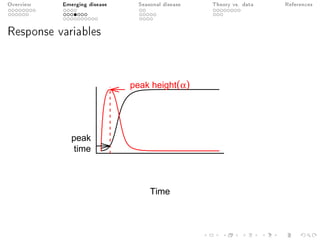
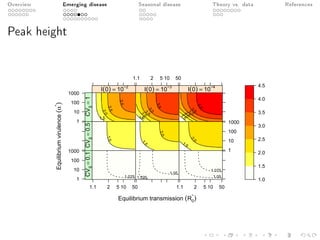
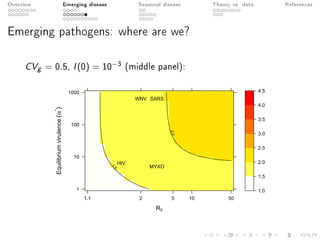
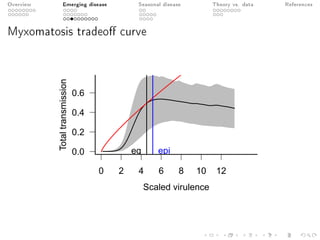
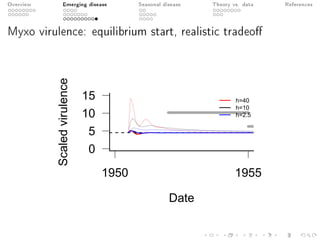
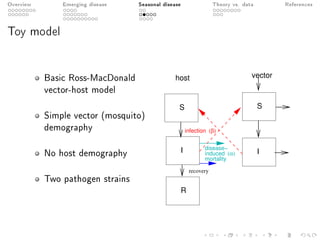
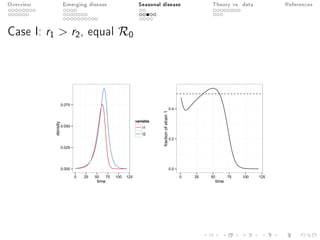
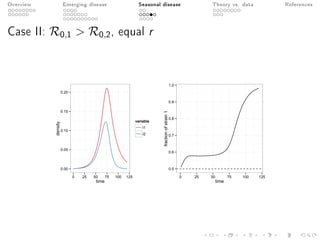
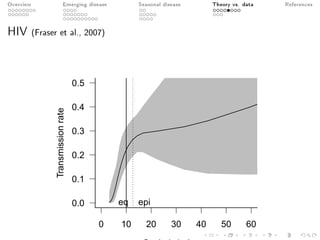
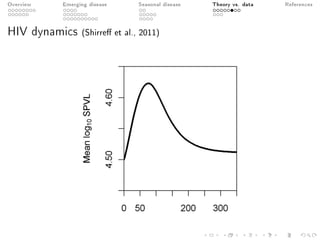
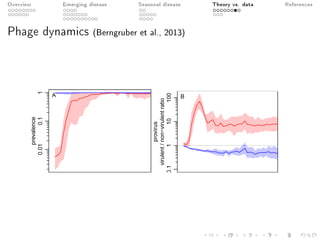
Overview Emerging disease Seasonal disease Theory vs. data References
Eco-evolutionary virulence of pathogens:
models and speculations
Ben Bolker, McMaster University
Departments of Mathematics & Statistics and Biology
IGERT symposium
25 April 2014
Overview Emerging disease Seasonal disease Theory vs. data References
Outline
1 Overview
The evolution of host-pathogen theory
Toy models
2 Transient virulence and emerging diseases
Overview
Toy model
Myxomatosis data
3 Transient virulence and seasonality
Overview
Toy model
WNV data
4 More on theory vs. data
Tradeo curves
Conclusions
Overview Emerging disease Seasonal disease Theory vs. data References
Acknowledgements
People Arjun Nanda and Dharmini Shah; Christophe Fraser;
Marm Kilpatrick; Anson Wong
Support NSF IRCEB grant 9977063; QSE3 IGERT; NSERC
Discovery grant
Overview Emerging disease Seasonal disease Theory vs. data References
Outline
1 Overview
The evolution of host-pathogen theory
Toy models
2 Transient virulence and emerging diseases
Overview
Toy model
Myxomatosis data
3 Transient virulence and seasonality
Overview
Toy model
WNV data
4 More on theory vs. data
Tradeo curves
Conclusions
Overview Emerging disease Seasonal disease Theory vs. data References
Host-pathogen evolutionary biology
Why is it interesting?
Intellectual merit
Coevolutionary loops
Cryptic eects
Eco-evolutionary dynamics (Luo and Koelle, 2013)
Cool stories
Lots of data (sometimes)
Broader applications
Medical
Conservation and management
Outreach
Overview Emerging disease Seasonal disease Theory vs. data References
Virulence: denitions
General public: badness
Plant biologists: infectivity
Evolutionists: loss of host tness
Theoreticians: rate of host mortality
(mortality rate vs. case mortality vs. clearance)
Overview Emerging disease Seasonal disease Theory vs. data References
Evolution of virulence evolution theory
Classical dogma monotonic trend toward avirulence
Ewald era virulence as an evolved (adaptive) trait. Tradeo
theory, modes of transmission.
post-Ewald more formal tradeo models, mostly based on R0
optimization. Adaptive dynamics
Now tradeo backlash
within-host dynamics/multi-level models
eco-evolutionary dynamics
host eects: resistance vs tolerance vs virulence
Overview Emerging disease Seasonal disease Theory vs. data References
Basic tradeo theory: assumptions
Homogeneous, non-evolving hosts
No superinfection/coinfection
Horizontal, direct transmission
Tradeo between rate of transmission
and length of infectious period
Infectious period ∝ 1/clearance
(= recovery+disease-induced mortality+natural mortality)
Overview Emerging disease Seasonal disease Theory vs. data References
Tradeos, R0, and r
Clearance+disease−induced mort.
Transmission
rate
mu 0 1 2 3 4 5
Overview Emerging disease Seasonal disease Theory vs. data References
Tradeos, R0, and r
Clearance+disease−induced mort.
Transmission
rate
mu 0 1 2 3 4 5
Overview Emerging disease Seasonal disease Theory vs. data References
Tradeos, R0, and r
Clearance+disease−induced mort.
Transmission
rate
mu 0 1 2 3 4 5
Overview Emerging disease Seasonal disease Theory vs. data References
Outline
1 Overview
The evolution of host-pathogen theory
Toy models
2 Transient virulence and emerging diseases
Overview
Toy model
Myxomatosis data
3 Transient virulence and seasonality
Overview
Toy model
WNV data
4 More on theory vs. data
Tradeo curves
Conclusions
Overview Emerging disease Seasonal disease Theory vs. data References
Epidemiological model
SIR model
Constant population size
(birth=death)
Ignore recovery
Rescale: µ = 1, N = 1
(time units of host lifespan)
I
S
disease−
mortality
(α)induced
mortality
(µ)
birth
R
infection (β)
recovery
Overview Emerging disease Seasonal disease Theory vs. data References
Epidemiological model
SIR model
Constant population size
(birth=death)
Ignore recovery
Rescale: µ = 1, N = 1
(time units of host lifespan)
I
S
disease−
mortality
(α)induced
mortality
(µ)
birth
R
infection (β)
recovery
Overview Emerging disease Seasonal disease Theory vs. data References
Epidemiological model
SIR model
Constant population size
(birth=death)
Ignore recovery
Rescale: µ = 1, N = 1
(time units of host lifespan)
I
S
disease−
mortality
(α)induced
mortality
(µ)
birth
R
infection (β)
recovery
Overview Emerging disease Seasonal disease Theory vs. data References
Epidemiological model
SIR model
Constant population size
(birth=death)
Ignore recovery
Rescale: µ = 1, N = 1
(time units of host lifespan)
I
S
disease−
mortality
(α)induced
mortality
(µ)
birth
R
infection (β)
recovery
Overview Emerging disease Seasonal disease Theory vs. data References
The model (2): evolutionary dynamics
Incorporate trait dynamics
Standard quantitative genetics model (Abrams, 2001):
Fitness depends on mean trait value (¯α)
and ecological context (proportion susceptible)
Constant additive genetic variance Vg
Trait evolves toward increased tness:
rate proportional to ∆tness/∆trait
Alternatives:
multi-strain, adaptive dynamics, PDEs, agent-based models ...
Overview Emerging disease Seasonal disease Theory vs. data References
Evolutionary dynamics, cont.
Virulence
Fitness(w)
frac inf=0.1
Overview Emerging disease Seasonal disease Theory vs. data References
Evolutionary dynamics, cont.
Virulence
Fitness(w)
frac inf=0.1
frac inf=0.3
Overview Emerging disease Seasonal disease Theory vs. data References
Power-law tradeo curves
Virulence
Transmission β(α) = cα1 γ
c = 2, γ = 2
c = 1, γ = 2
c = 1, γ = 3
Overview Emerging disease Seasonal disease Theory vs. data References
Outline
1 Overview
The evolution of host-pathogen theory
Toy models
2 Transient virulence and emerging diseases
Overview
Toy model
Myxomatosis data
3 Transient virulence and seasonality
Overview
Toy model
WNV data
4 More on theory vs. data
Tradeo curves
Conclusions
Overview Emerging disease Seasonal disease Theory vs. data References
(Why) are emerging pathogens more virulent?
What might explain initially high, but rapidly decreasing, virulence
of emerging pathogens?
Pathogens with low virulence go unnoticed
Hosts less resistant to / tolerant of novel parasites
High transmission → frequent coinfection → selection for
virulence
Disease-induced drop in population density decreases selection
for virulence (Lenski and May, 1994)
Overview Emerging disease Seasonal disease Theory vs. data References
Transient virulence
Selection diers between the epidemic and endemic phases of an
outbreak (Frank, 1996; Day and Proulx, 2004)
endemic phase selection for per-generation ospring production:
maximize R0, βN/(α + µ)
epidemic phase selection for per-unit-time ospring production:
maximize r, βN − (α + µ)
Overview Emerging disease Seasonal disease Theory vs. data References
Transient emerging virulence
When a parasite previously in eco-evolutionary equilibrium
emerges in a new host population (at low density) it will show
a transient peak in virulence as it spreads
How big is the peak? Does it matter?
Overview Emerging disease Seasonal disease Theory vs. data References
Outline
1 Overview
The evolution of host-pathogen theory
Toy models
2 Transient virulence and emerging diseases
Overview
Toy model
Myxomatosis data
3 Transient virulence and seasonality
Overview
Toy model
WNV data
4 More on theory vs. data
Tradeo curves
Conclusions
Overview Emerging disease Seasonal disease Theory vs. data References
Model parameters
Parameter
c Transmission
scale
γ Transmission
curvature
I(0) Initial
epidemic size
Vg Genetic variance
Alternative
R∗
0 Equilibrium R0
α∗ Equilibrium
virulence
1/N0 Inverse
population size
Overview Emerging disease Seasonal disease Theory vs. data References
Example
Time
Fractioninfective
0.00
0.05
0.10
0.15
0 10 20 30
Vg = 5, c = 3, I(0) = 0.001, γ = 2
(R0
*
= 1.5, α*
= 1, N = 1000)
1.0
1.2
1.4
1.6
1.8
2.0
α
Overview Emerging disease Seasonal disease Theory vs. data References
Response variables
Time
peak
time
peak height(α)
Overview Emerging disease Seasonal disease Theory vs. data References
Peak height
Equilibrium transmission (R0
*
)
Equilibriumvirulence(α*
)
1
10
100
1000
1.1 2 5 10 50
1.025
I(0) = 10−2
CVg=0.1
1.025
1.05
I(0) = 10−3
CVg=0.1
1.1 2 5 10 50
1.05
1.075
I(0) = 10−4
CVg=0.1
1.5
I(0) = 10−2
CVg=0.5
1.5
2.0
I(0) = 10−3
CVg=0.5
1
10
100
1000
1.5
2.0
I(0) = 10−4
CVg=0.5
1
10
100
1000
1.5
2.0
2.5
3.0
I(0) = 10−2CVg=1
1.1 2 5 10 50
1.5
2.0
2.5
3.0
3.5
I(0) = 10−3
CVg=1
1.5
2.0
2.5
3.0
3.5
4.0
I(0) = 10−4
CVg=1 1.0
1.5
2.0
2.5
3.0
3.5
4.0
4.5
Overview Emerging disease Seasonal disease Theory vs. data References
Estimates for emerging pathogens
Order of magnitude estimates for some emerging high-virulence
pathogens:
Pathogen R∗
0 α∗
Reference
SARS 3 640 Anderson et al. (2004)
HIV 1.43 6.36 Velasco-Hernandez et al. (2002)
West Nile 1.613.24 639 Wonham et al. (2004)
myxomatosis 3 5 Dwyer et al. (1990)
Overview Emerging disease Seasonal disease Theory vs. data References
Emerging pathogens: where are we?
CVg = 0.5, I(0) = 10−3 (middle panel):
R0
Equilibriumvirulence(α*
)
1
10
100
1000
1.1 2 5 10 50
1.5
2.0
SARS
HIV
WNV
MYXO
1.0
1.5
2.0
2.5
3.0
3.5
4.0
4.5
Overview Emerging disease Seasonal disease Theory vs. data References
Outline
1 Overview
The evolution of host-pathogen theory
Toy models
2 Transient virulence and emerging diseases
Overview
Toy model
Myxomatosis data
3 Transient virulence and seasonality
Overview
Toy model
WNV data
4 More on theory vs. data
Tradeo curves
Conclusions
Overview Emerging disease Seasonal disease Theory vs. data References
Overview
Mosquito-borne viral disease of rabbits
Benign in South American rabbits,
quickly fatal in European rabbits
Well characterized (Fenner et al., 1956; Dwyer et al., 1990)
Overview Emerging disease Seasonal disease Theory vs. data References
Myxomatosis tradeo curve
Scaled virulence
Totaltransmission
0 2 4 6 8 10 12
0.0
0.2
0.4
0.6
eq epi
Overview Emerging disease Seasonal disease Theory vs. data References
Estimating evolvability (Vg)
Key parameter: genetic variance in virulence (evolvability)
Despite case studies of rapid pathogen evolution:
myxomatosis (Dwyer et al., 1990)
syphilis (Knell, 2004)
serial passage experiments (Ebert, 1998)
Plasmodium chabaudi (Mackinnon and Read, 1999a)
we rarely have enough information to estimate Vg
Only (?) for myxomatosis do we know the variation in
virulence among circulating strains
Overview Emerging disease Seasonal disease Theory vs. data References
Myxomatosis grades vs. time
1950 1954 1956 1961 1965 1968 1972 1978
Proportion
0.0
0.2
0.4
0.6
0.8
1.0
Virulence grade
I II III IV V
Overview Emerging disease Seasonal disease Theory vs. data References
Myxomatosis variance vs. time
Date
Geneticvariance(Vg)
0
10
20
30
40
1950 1960 1970
Vg= 10
Vg= 2.5
Vg= 40
Overview Emerging disease Seasonal disease Theory vs. data References
Myxomatosis virulence dynamics: power-law tradeo
Date
Scaledvirulence
0
5
10
15
20
25
1950 1960 1970
h=2.5
h=10
h=40
Overview Emerging disease Seasonal disease Theory vs. data References
Myxomatosis virulence dynamics: realistic tradeo
Date
Scaledvirulence
0
5
10
15
20
25
1950 1960 1970
h=40
h=10
h=2.5
Overview Emerging disease Seasonal disease Theory vs. data References
Myxo virulence: equilibrium start, power-law tradeo
Date
Scaledvirulence
0
5
10
15
1950 1955
h=40
h=10
h=2.5
Overview Emerging disease Seasonal disease Theory vs. data References
Myxo virulence: equilibrium start, realistic tradeo
Date
Scaledvirulence
0
5
10
15
1950 1955
h=40
h=10
h=2.5
Overview Emerging disease Seasonal disease Theory vs. data References
Outline
1 Overview
The evolution of host-pathogen theory
Toy models
2 Transient virulence and emerging diseases
Overview
Toy model
Myxomatosis data
3 Transient virulence and seasonality
Overview
Toy model
WNV data
4 More on theory vs. data
Tradeo curves
Conclusions
Overview Emerging disease Seasonal disease Theory vs. data References
Seasonality
Many pathogens uctuate annually
Host contact/aggregation patterns
Host (or vector) demography
Climatic eects on transmissibility
Fluctuating incidence = uctuating selection
Seasonal variation or latitudinal variation?
Overview Emerging disease Seasonal disease Theory vs. data References
Outline
1 Overview
The evolution of host-pathogen theory
Toy models
2 Transient virulence and emerging diseases
Overview
Toy model
Myxomatosis data
3 Transient virulence and seasonality
Overview
Toy model
WNV data
4 More on theory vs. data
Tradeo curves
Conclusions
Overview Emerging disease Seasonal disease Theory vs. data References
Toy model
Basic Ross-MacDonald
vector-host model
Simple vector (mosquito)
demography
No host demography
Two pathogen strains
I disease−
mortality
(α)induced
S
I
infection (β)
recovery
S
R
host vector
Overview Emerging disease Seasonal disease Theory vs. data References
Case I: r1  r2, equal R0
0.000
0.025
0.050
0.075
0 25 50 75 100 125
time
density
variable
I1
I2
0.0
0.2
0.4
0 25 50 75 100 125
time
fractionofstrain1
Overview Emerging disease Seasonal disease Theory vs. data References
Case II: R0,1  R0,2, equal r
0.00
0.05
0.10
0.15
0.20
0 25 50 75 100 125
time
density
variable
I1
I2
0.5
0.6
0.7
0.8
0.9
1.0
0 25 50 75 100 125
time
fractionofstrain1
Overview Emerging disease Seasonal disease Theory vs. data References
Case III: R0,1  R0,2, r2  r1
0.00
0.05
0.10
0.15
0 25 50 75 100 125
time
density
variable
I1
I2
0.5
0.6
0.7
0.8
0.9
1.0
0 25 50 75 100 125
time
fractionofstrain1
Overview Emerging disease Seasonal disease Theory vs. data References
Outline
1 Overview
The evolution of host-pathogen theory
Toy models
2 Transient virulence and emerging diseases
Overview
Toy model
Myxomatosis data
3 Transient virulence and seasonality
Overview
Toy model
WNV data
4 More on theory vs. data
Tradeo curves
Conclusions
Overview Emerging disease Seasonal disease Theory vs. data References
Titer vs infectiousness
q q q
q
q
q
q
q
q
q
q
q
q
q
q
q
0.0
0.2
0.4
0.6
4 6 8
titer
Transmissionprobability
source
q
q
q
q
Dohm
Tiawsirisup_2005_VBZD
Turell_altjmh
Turell_JME
Overview Emerging disease Seasonal disease Theory vs. data References
Titer curves (American crows)
1e−04
1e−02
1e+00
2 4 6 8
day
transmissionprobability
strain
BIRD1153
KEN
KENsub
NY99
P991
P991sub
TM171−03−pp5
TM173−03−pp1
TWN301
Overview Emerging disease Seasonal disease Theory vs. data References
Transmission vs clearance for WNV
BIRD1153
BIRD1461
NY99
TM171−03−pp5
BIRD1153
KEN
KENsub
NY99P991
TM171−03−pp5
TWN301
0.0
0.2
0.4
0.6
0.00 0.25 0.50 0.75 1.00
Clearance rate (1/infectious period)
Averagetransmissionrate
species
a
a
sparrow
amcrow
Overview Emerging disease Seasonal disease Theory vs. data References
Outline
1 Overview
The evolution of host-pathogen theory
Toy models
2 Transient virulence and emerging diseases
Overview
Toy model
Myxomatosis data
3 Transient virulence and seasonality
Overview
Toy model
WNV data
4 More on theory vs. data
Tradeo curves
Conclusions
Overview Emerging disease Seasonal disease Theory vs. data References
Estimating tradeo curves
Usually assume a tradeo between virulence and transmission
Positive correlation virulence and transmissibility (or proxies)
known from many systems (Lipsitch and Moxon, 1997)
the shape of tradeo curves is largely unknown
Overview Emerging disease Seasonal disease Theory vs. data References
Malaria (Mackinnon and Read, 1999b; Paul et al., 2004)
q
q
qq
0 500 1000 1500
0
20
40
60
80
100
Scaled virulence
%mosquitoesinfected
Plasmodium gallinaceum
q
low−dose mixed
high−dose mixed
SL
Thai
q
q
q
q
qq
q
q
10 15 20 25
10
15
20
25
Maximum parasitemia
Overallinfection(%)
Plasmodium chabaudi
Overview Emerging disease Seasonal disease Theory vs. data References
Pasteuria ramosa (Jensen et al., 2006)
qqqqq
q
q
q
qq
q
q
q
qqq
qq
q
q
q
q
q
qq
qq
q
q
q
q
0 1 2 3 4 5
0.00
0.02
0.04
0.06
0.08
0.10
0.12
Scaled virulence
Spores/day(×106
)
qqqqq
q
q
q
qq
q
q
q
qqq
qq
q
q
q
q
q
qq
qq
q
q
q
q
Overview Emerging disease Seasonal disease Theory vs. data References
HIV (Fraser et al., 2007)
0 10 20 30 40 50 60
0.0
0.1
0.2
0.3
0.4
0.5
Transmissionrate
eq epi
Overview Emerging disease Seasonal disease Theory vs. data References
HIV dynamics (Shirre et al., 2011)
Overview Emerging disease Seasonal disease Theory vs. data References
Phage dynamics (Berngruber et al., 2013)
Overview Emerging disease Seasonal disease Theory vs. data References
What about space?
Theory: spatial structure
should select for decreased
virulence
Experiment: viscosity
decreases infectivity in
Plodia (Boots and Mealor,
2007)
Are we ready for space?
Overview Emerging disease Seasonal disease Theory vs. data References
Outline
1 Overview
The evolution of host-pathogen theory
Toy models
2 Transient virulence and emerging diseases
Overview
Toy model
Myxomatosis data
3 Transient virulence and seasonality
Overview
Toy model
WNV data
4 More on theory vs. data
Tradeo curves
Conclusions
Overview Emerging disease Seasonal disease Theory vs. data References
Conclusions
Eco-evolutionary dynamics of virulence are still plausible
(Alizon et al., 2009; Luo and Koelle, 2013)
Sensitive to genetic variance and shape of tradeo curve
Theory meets molecular biology:
mutations of large eect vs. quantitative variability
Overview Emerging disease Seasonal disease Theory vs. data References
Crome (1997) on theory
When we regard theories as tight, real entities and devote
ourselves to their analysis, we can limit our horizons and,
worse, attempt to make the world t them. A lot of
ecological discussion is not about nature, but about
theories, generalizations, or models supposed to represent
nature . . .
Overview Emerging disease Seasonal disease Theory vs. data References
References
Abrams, P.A., 2001. Ecol Lett, 4:166175.
Alizon, S., Hurford, A., et al., 2009. J. Evol. Biol., 22:245259.
doi:10.1111/j.1420-9101.2008.01658.x.
Anderson, R.M., Fraser, C., et al., 2004. Phil Trans R Soc London B, 359(1447):10911105.
Berngruber, T.W., Froissart, R., et al., 2013. PLoS Pathog, 9(3):e1003209.
doi:10.1371/journal.ppat.1003209.
Boots, M. and Mealor, M., 2007. Science, 315(5816):12841286.
Crome, F.H.J., 1997. In W.F. Laurance and J. Richard O. Bierregard, editors, Tropical Forest
Remnants: Ecology, Management and Conservation of Fragmented Communities, chapter 31, pages
485501. University of Chicago Press, Chicago.
Day, T. and Proulx, S.R., 2004. Amer Nat, 163(4):E40E63.
Dwyer, G., Levin, S., and Buttel, L., 1990. Ecol Monog, 60:423447.
Ebert, D., 1998. Science, 282(5393):14321435.
Fenner, F., Day, M.F., and Woodroofe, G.M., 1956. J Hyg (London), 54(2):284302.
Frank, S.A., 1996. Q Rev Biol, 71(1):3778.
Fraser, C., Hollingsworth, T.D., et al., 2007. PNAS, 104:1744117446.
Jensen, K.H., Little, T., et al., 2006. PLoS Biology, 4(7):e197.
Knell, R.J., 2004. Proc R Soc London B, 271:S174S176.
Lenski, R.E. and May, R.M., 1994. J Theor Biol, 169:253265.
Lipsitch, M. and Moxon, E.R., 1997. Trends Microbiol, 5(1):3137.
Luo, S. and Koelle, K., 2013. The American Naturalist, 181(S1):S58S75. ISSN 0003-0147.
doi:10.1086/669952.
Mackinnon, M.J. and Read, A.F., 1999a. Evolution, 53(3):689703.
, 1999b. Proc R Soc London B, 266(1420):741748.
Paul, R.E.L., Lafond, T., et al., 2004. BMC Evol Biol, 4:30.
Shirre, G., Pellis, L., et al., 2011. PLoS Computational Biology, 7(10). ISSN 1553-734X.
doi:10.1371/journal.pcbi.1002185. WOS:000297262700019.
Velasco-Hernandez, J.X., Gershgorn, H.B., and Blower, S.M., 2002. Lancet, 2:487493.
Wonham, M.J., de Camino-Beck, T., and Lewis, M.A., 2004. Proc R Soc London B, 271:501507.

virulence evolution (IGERT symposium)

  • 1.
    Overview Emerging diseaseSeasonal disease Theory vs. data References Eco-evolutionary virulence of pathogens: models and speculations Ben Bolker, McMaster University Departments of Mathematics & Statistics and Biology IGERT symposium 25 April 2014
  • 2.
    Overview Emerging diseaseSeasonal disease Theory vs. data References Outline 1 Overview The evolution of host-pathogen theory Toy models 2 Transient virulence and emerging diseases Overview Toy model Myxomatosis data 3 Transient virulence and seasonality Overview Toy model WNV data 4 More on theory vs. data Tradeo curves Conclusions
  • 3.
    Overview Emerging diseaseSeasonal disease Theory vs. data References Acknowledgements People Arjun Nanda and Dharmini Shah; Christophe Fraser; Marm Kilpatrick; Anson Wong Support NSF IRCEB grant 9977063; QSE3 IGERT; NSERC Discovery grant
  • 4.
    Overview Emerging diseaseSeasonal disease Theory vs. data References Outline 1 Overview The evolution of host-pathogen theory Toy models 2 Transient virulence and emerging diseases Overview Toy model Myxomatosis data 3 Transient virulence and seasonality Overview Toy model WNV data 4 More on theory vs. data Tradeo curves Conclusions
  • 5.
    Overview Emerging diseaseSeasonal disease Theory vs. data References Host-pathogen evolutionary biology Why is it interesting? Intellectual merit Coevolutionary loops Cryptic eects Eco-evolutionary dynamics (Luo and Koelle, 2013) Cool stories Lots of data (sometimes) Broader applications Medical Conservation and management Outreach
  • 6.
    Overview Emerging diseaseSeasonal disease Theory vs. data References Host-pathogen evolutionary biology Why is it interesting? Intellectual merit Coevolutionary loops Cryptic eects Eco-evolutionary dynamics (Luo and Koelle, 2013) Cool stories Lots of data (sometimes) Broader applications Medical Conservation and management Outreach
  • 7.
    Overview Emerging diseaseSeasonal disease Theory vs. data References Virulence: denitions General public: badness Plant biologists: infectivity Evolutionists: loss of host tness Theoreticians: rate of host mortality (mortality rate vs. case mortality vs. clearance)
  • 8.
    Overview Emerging diseaseSeasonal disease Theory vs. data References Evolution of virulence evolution theory Classical dogma monotonic trend toward avirulence Ewald era virulence as an evolved (adaptive) trait. Tradeo theory, modes of transmission. post-Ewald more formal tradeo models, mostly based on R0 optimization. Adaptive dynamics Now tradeo backlash within-host dynamics/multi-level models eco-evolutionary dynamics host eects: resistance vs tolerance vs virulence
  • 9.
    Overview Emerging diseaseSeasonal disease Theory vs. data References Evolution of virulence evolution theory Classical dogma monotonic trend toward avirulence Ewald era virulence as an evolved (adaptive) trait. Tradeo theory, modes of transmission. post-Ewald more formal tradeo models, mostly based on R0 optimization. Adaptive dynamics Now tradeo backlash within-host dynamics/multi-level models eco-evolutionary dynamics host eects: resistance vs tolerance vs virulence
  • 10.
    Overview Emerging diseaseSeasonal disease Theory vs. data References Evolution of virulence evolution theory Classical dogma monotonic trend toward avirulence Ewald era virulence as an evolved (adaptive) trait. Tradeo theory, modes of transmission. post-Ewald more formal tradeo models, mostly based on R0 optimization. Adaptive dynamics Now tradeo backlash within-host dynamics/multi-level models eco-evolutionary dynamics host eects: resistance vs tolerance vs virulence
  • 11.
    Overview Emerging diseaseSeasonal disease Theory vs. data References Evolution of virulence evolution theory Classical dogma monotonic trend toward avirulence Ewald era virulence as an evolved (adaptive) trait. Tradeo theory, modes of transmission. post-Ewald more formal tradeo models, mostly based on R0 optimization. Adaptive dynamics Now tradeo backlash within-host dynamics/multi-level models eco-evolutionary dynamics host eects: resistance vs tolerance vs virulence
  • 12.
    Overview Emerging diseaseSeasonal disease Theory vs. data References Basic tradeo theory: assumptions Homogeneous, non-evolving hosts No superinfection/coinfection Horizontal, direct transmission Tradeo between rate of transmission and length of infectious period Infectious period ∝ 1/clearance (= recovery+disease-induced mortality+natural mortality)
  • 13.
    Overview Emerging diseaseSeasonal disease Theory vs. data References Tradeos, R0, and r Clearance+disease−induced mort. Transmission rate mu 0 1 2 3 4 5
  • 14.
    Overview Emerging diseaseSeasonal disease Theory vs. data References Tradeos, R0, and r Clearance+disease−induced mort. Transmission rate mu 0 1 2 3 4 5
  • 15.
    Overview Emerging diseaseSeasonal disease Theory vs. data References Tradeos, R0, and r Clearance+disease−induced mort. Transmission rate mu 0 1 2 3 4 5
  • 16.
    Overview Emerging diseaseSeasonal disease Theory vs. data References Outline 1 Overview The evolution of host-pathogen theory Toy models 2 Transient virulence and emerging diseases Overview Toy model Myxomatosis data 3 Transient virulence and seasonality Overview Toy model WNV data 4 More on theory vs. data Tradeo curves Conclusions
  • 17.
    Overview Emerging diseaseSeasonal disease Theory vs. data References Epidemiological model SIR model Constant population size (birth=death) Ignore recovery Rescale: µ = 1, N = 1 (time units of host lifespan) I S disease− mortality (α)induced mortality (µ) birth R infection (β) recovery
  • 18.
    Overview Emerging diseaseSeasonal disease Theory vs. data References Epidemiological model SIR model Constant population size (birth=death) Ignore recovery Rescale: µ = 1, N = 1 (time units of host lifespan) I S disease− mortality (α)induced mortality (µ) birth R infection (β) recovery
  • 19.
    Overview Emerging diseaseSeasonal disease Theory vs. data References Epidemiological model SIR model Constant population size (birth=death) Ignore recovery Rescale: µ = 1, N = 1 (time units of host lifespan) I S disease− mortality (α)induced mortality (µ) birth R infection (β) recovery
  • 20.
    Overview Emerging diseaseSeasonal disease Theory vs. data References Epidemiological model SIR model Constant population size (birth=death) Ignore recovery Rescale: µ = 1, N = 1 (time units of host lifespan) I S disease− mortality (α)induced mortality (µ) birth R infection (β) recovery
  • 21.
    Overview Emerging diseaseSeasonal disease Theory vs. data References The model (2): evolutionary dynamics Incorporate trait dynamics Standard quantitative genetics model (Abrams, 2001): Fitness depends on mean trait value (¯α) and ecological context (proportion susceptible) Constant additive genetic variance Vg Trait evolves toward increased tness: rate proportional to ∆tness/∆trait Alternatives: multi-strain, adaptive dynamics, PDEs, agent-based models ...
  • 22.
    Overview Emerging diseaseSeasonal disease Theory vs. data References The model (2): evolutionary dynamics Incorporate trait dynamics Standard quantitative genetics model (Abrams, 2001): Fitness depends on mean trait value (¯α) and ecological context (proportion susceptible) Constant additive genetic variance Vg Trait evolves toward increased tness: rate proportional to ∆tness/∆trait Alternatives: multi-strain, adaptive dynamics, PDEs, agent-based models ...
  • 23.
    Overview Emerging diseaseSeasonal disease Theory vs. data References The model (2): evolutionary dynamics Incorporate trait dynamics Standard quantitative genetics model (Abrams, 2001): Fitness depends on mean trait value (¯α) and ecological context (proportion susceptible) Constant additive genetic variance Vg Trait evolves toward increased tness: rate proportional to ∆tness/∆trait Alternatives: multi-strain, adaptive dynamics, PDEs, agent-based models ...
  • 24.
    Overview Emerging diseaseSeasonal disease Theory vs. data References The model (2): evolutionary dynamics Incorporate trait dynamics Standard quantitative genetics model (Abrams, 2001): Fitness depends on mean trait value (¯α) and ecological context (proportion susceptible) Constant additive genetic variance Vg Trait evolves toward increased tness: rate proportional to ∆tness/∆trait Alternatives: multi-strain, adaptive dynamics, PDEs, agent-based models ...
  • 25.
    Overview Emerging diseaseSeasonal disease Theory vs. data References The model (2): evolutionary dynamics Incorporate trait dynamics Standard quantitative genetics model (Abrams, 2001): Fitness depends on mean trait value (¯α) and ecological context (proportion susceptible) Constant additive genetic variance Vg Trait evolves toward increased tness: rate proportional to ∆tness/∆trait Alternatives: multi-strain, adaptive dynamics, PDEs, agent-based models ...
  • 26.
    Overview Emerging diseaseSeasonal disease Theory vs. data References Evolutionary dynamics, cont. Virulence Fitness(w) frac inf=0.1
  • 27.
    Overview Emerging diseaseSeasonal disease Theory vs. data References Evolutionary dynamics, cont. Virulence Fitness(w) frac inf=0.1 frac inf=0.3
  • 28.
    Overview Emerging diseaseSeasonal disease Theory vs. data References Power-law tradeo curves Virulence Transmission β(α) = cα1 γ c = 2, γ = 2 c = 1, γ = 2 c = 1, γ = 3
  • 29.
    Overview Emerging diseaseSeasonal disease Theory vs. data References Outline 1 Overview The evolution of host-pathogen theory Toy models 2 Transient virulence and emerging diseases Overview Toy model Myxomatosis data 3 Transient virulence and seasonality Overview Toy model WNV data 4 More on theory vs. data Tradeo curves Conclusions
  • 30.
    Overview Emerging diseaseSeasonal disease Theory vs. data References (Why) are emerging pathogens more virulent? What might explain initially high, but rapidly decreasing, virulence of emerging pathogens? Pathogens with low virulence go unnoticed Hosts less resistant to / tolerant of novel parasites High transmission → frequent coinfection → selection for virulence Disease-induced drop in population density decreases selection for virulence (Lenski and May, 1994)
  • 31.
    Overview Emerging diseaseSeasonal disease Theory vs. data References (Why) are emerging pathogens more virulent? What might explain initially high, but rapidly decreasing, virulence of emerging pathogens? Pathogens with low virulence go unnoticed Hosts less resistant to / tolerant of novel parasites High transmission → frequent coinfection → selection for virulence Disease-induced drop in population density decreases selection for virulence (Lenski and May, 1994)
  • 32.
    Overview Emerging diseaseSeasonal disease Theory vs. data References (Why) are emerging pathogens more virulent? What might explain initially high, but rapidly decreasing, virulence of emerging pathogens? Pathogens with low virulence go unnoticed Hosts less resistant to / tolerant of novel parasites High transmission → frequent coinfection → selection for virulence Disease-induced drop in population density decreases selection for virulence (Lenski and May, 1994)
  • 33.
    Overview Emerging diseaseSeasonal disease Theory vs. data References (Why) are emerging pathogens more virulent? What might explain initially high, but rapidly decreasing, virulence of emerging pathogens? Pathogens with low virulence go unnoticed Hosts less resistant to / tolerant of novel parasites High transmission → frequent coinfection → selection for virulence Disease-induced drop in population density decreases selection for virulence (Lenski and May, 1994)
  • 34.
    Overview Emerging diseaseSeasonal disease Theory vs. data References Transient virulence Selection diers between the epidemic and endemic phases of an outbreak (Frank, 1996; Day and Proulx, 2004) endemic phase selection for per-generation ospring production: maximize R0, βN/(α + µ) epidemic phase selection for per-unit-time ospring production: maximize r, βN − (α + µ)
  • 35.
    Overview Emerging diseaseSeasonal disease Theory vs. data References Transient virulence Selection diers between the epidemic and endemic phases of an outbreak (Frank, 1996; Day and Proulx, 2004) endemic phase selection for per-generation ospring production: maximize R0, βN/(α + µ) epidemic phase selection for per-unit-time ospring production: maximize r, βN − (α + µ)
  • 36.
    Overview Emerging diseaseSeasonal disease Theory vs. data References Transient virulence Selection diers between the epidemic and endemic phases of an outbreak (Frank, 1996; Day and Proulx, 2004) endemic phase selection for per-generation ospring production: maximize R0, βN/(α + µ) epidemic phase selection for per-unit-time ospring production: maximize r, βN − (α + µ)
  • 37.
    Overview Emerging diseaseSeasonal disease Theory vs. data References Transient emerging virulence When a parasite previously in eco-evolutionary equilibrium emerges in a new host population (at low density) it will show a transient peak in virulence as it spreads How big is the peak? Does it matter?
  • 38.
    Overview Emerging diseaseSeasonal disease Theory vs. data References Outline 1 Overview The evolution of host-pathogen theory Toy models 2 Transient virulence and emerging diseases Overview Toy model Myxomatosis data 3 Transient virulence and seasonality Overview Toy model WNV data 4 More on theory vs. data Tradeo curves Conclusions
  • 39.
    Overview Emerging diseaseSeasonal disease Theory vs. data References Model parameters Parameter c Transmission scale γ Transmission curvature I(0) Initial epidemic size Vg Genetic variance Alternative R∗ 0 Equilibrium R0 α∗ Equilibrium virulence 1/N0 Inverse population size
  • 40.
    Overview Emerging diseaseSeasonal disease Theory vs. data References Example Time Fractioninfective 0.00 0.05 0.10 0.15 0 10 20 30 Vg = 5, c = 3, I(0) = 0.001, γ = 2 (R0 * = 1.5, α* = 1, N = 1000) 1.0 1.2 1.4 1.6 1.8 2.0 α
  • 41.
    Overview Emerging diseaseSeasonal disease Theory vs. data References Response variables Time peak time peak height(α)
  • 42.
    Overview Emerging diseaseSeasonal disease Theory vs. data References Peak height Equilibrium transmission (R0 * ) Equilibriumvirulence(α* ) 1 10 100 1000 1.1 2 5 10 50 1.025 I(0) = 10−2 CVg=0.1 1.025 1.05 I(0) = 10−3 CVg=0.1 1.1 2 5 10 50 1.05 1.075 I(0) = 10−4 CVg=0.1 1.5 I(0) = 10−2 CVg=0.5 1.5 2.0 I(0) = 10−3 CVg=0.5 1 10 100 1000 1.5 2.0 I(0) = 10−4 CVg=0.5 1 10 100 1000 1.5 2.0 2.5 3.0 I(0) = 10−2CVg=1 1.1 2 5 10 50 1.5 2.0 2.5 3.0 3.5 I(0) = 10−3 CVg=1 1.5 2.0 2.5 3.0 3.5 4.0 I(0) = 10−4 CVg=1 1.0 1.5 2.0 2.5 3.0 3.5 4.0 4.5
  • 43.
    Overview Emerging diseaseSeasonal disease Theory vs. data References Estimates for emerging pathogens Order of magnitude estimates for some emerging high-virulence pathogens: Pathogen R∗ 0 α∗ Reference SARS 3 640 Anderson et al. (2004) HIV 1.43 6.36 Velasco-Hernandez et al. (2002) West Nile 1.613.24 639 Wonham et al. (2004) myxomatosis 3 5 Dwyer et al. (1990)
  • 44.
    Overview Emerging diseaseSeasonal disease Theory vs. data References Emerging pathogens: where are we? CVg = 0.5, I(0) = 10−3 (middle panel): R0 Equilibriumvirulence(α* ) 1 10 100 1000 1.1 2 5 10 50 1.5 2.0 SARS HIV WNV MYXO 1.0 1.5 2.0 2.5 3.0 3.5 4.0 4.5
  • 45.
    Overview Emerging diseaseSeasonal disease Theory vs. data References Outline 1 Overview The evolution of host-pathogen theory Toy models 2 Transient virulence and emerging diseases Overview Toy model Myxomatosis data 3 Transient virulence and seasonality Overview Toy model WNV data 4 More on theory vs. data Tradeo curves Conclusions
  • 46.
    Overview Emerging diseaseSeasonal disease Theory vs. data References Overview Mosquito-borne viral disease of rabbits Benign in South American rabbits, quickly fatal in European rabbits Well characterized (Fenner et al., 1956; Dwyer et al., 1990)
  • 47.
    Overview Emerging diseaseSeasonal disease Theory vs. data References Myxomatosis tradeo curve Scaled virulence Totaltransmission 0 2 4 6 8 10 12 0.0 0.2 0.4 0.6 eq epi
  • 48.
    Overview Emerging diseaseSeasonal disease Theory vs. data References Estimating evolvability (Vg) Key parameter: genetic variance in virulence (evolvability) Despite case studies of rapid pathogen evolution: myxomatosis (Dwyer et al., 1990) syphilis (Knell, 2004) serial passage experiments (Ebert, 1998) Plasmodium chabaudi (Mackinnon and Read, 1999a) we rarely have enough information to estimate Vg Only (?) for myxomatosis do we know the variation in virulence among circulating strains
  • 49.
    Overview Emerging diseaseSeasonal disease Theory vs. data References Estimating evolvability (Vg) Key parameter: genetic variance in virulence (evolvability) Despite case studies of rapid pathogen evolution: myxomatosis (Dwyer et al., 1990) syphilis (Knell, 2004) serial passage experiments (Ebert, 1998) Plasmodium chabaudi (Mackinnon and Read, 1999a) we rarely have enough information to estimate Vg Only (?) for myxomatosis do we know the variation in virulence among circulating strains
  • 50.
    Overview Emerging diseaseSeasonal disease Theory vs. data References Estimating evolvability (Vg) Key parameter: genetic variance in virulence (evolvability) Despite case studies of rapid pathogen evolution: myxomatosis (Dwyer et al., 1990) syphilis (Knell, 2004) serial passage experiments (Ebert, 1998) Plasmodium chabaudi (Mackinnon and Read, 1999a) we rarely have enough information to estimate Vg Only (?) for myxomatosis do we know the variation in virulence among circulating strains
  • 51.
    Overview Emerging diseaseSeasonal disease Theory vs. data References Myxomatosis grades vs. time 1950 1954 1956 1961 1965 1968 1972 1978 Proportion 0.0 0.2 0.4 0.6 0.8 1.0 Virulence grade I II III IV V
  • 52.
    Overview Emerging diseaseSeasonal disease Theory vs. data References Myxomatosis variance vs. time Date Geneticvariance(Vg) 0 10 20 30 40 1950 1960 1970 Vg= 10 Vg= 2.5 Vg= 40
  • 53.
    Overview Emerging diseaseSeasonal disease Theory vs. data References Myxomatosis virulence dynamics: power-law tradeo Date Scaledvirulence 0 5 10 15 20 25 1950 1960 1970 h=2.5 h=10 h=40
  • 54.
    Overview Emerging diseaseSeasonal disease Theory vs. data References Myxomatosis virulence dynamics: realistic tradeo Date Scaledvirulence 0 5 10 15 20 25 1950 1960 1970 h=40 h=10 h=2.5
  • 55.
    Overview Emerging diseaseSeasonal disease Theory vs. data References Myxo virulence: equilibrium start, power-law tradeo Date Scaledvirulence 0 5 10 15 1950 1955 h=40 h=10 h=2.5
  • 56.
    Overview Emerging diseaseSeasonal disease Theory vs. data References Myxo virulence: equilibrium start, realistic tradeo Date Scaledvirulence 0 5 10 15 1950 1955 h=40 h=10 h=2.5
  • 57.
    Overview Emerging diseaseSeasonal disease Theory vs. data References Outline 1 Overview The evolution of host-pathogen theory Toy models 2 Transient virulence and emerging diseases Overview Toy model Myxomatosis data 3 Transient virulence and seasonality Overview Toy model WNV data 4 More on theory vs. data Tradeo curves Conclusions
  • 58.
    Overview Emerging diseaseSeasonal disease Theory vs. data References Seasonality Many pathogens uctuate annually Host contact/aggregation patterns Host (or vector) demography Climatic eects on transmissibility Fluctuating incidence = uctuating selection Seasonal variation or latitudinal variation?
  • 59.
    Overview Emerging diseaseSeasonal disease Theory vs. data References Outline 1 Overview The evolution of host-pathogen theory Toy models 2 Transient virulence and emerging diseases Overview Toy model Myxomatosis data 3 Transient virulence and seasonality Overview Toy model WNV data 4 More on theory vs. data Tradeo curves Conclusions
  • 60.
    Overview Emerging diseaseSeasonal disease Theory vs. data References Toy model Basic Ross-MacDonald vector-host model Simple vector (mosquito) demography No host demography Two pathogen strains I disease− mortality (α)induced S I infection (β) recovery S R host vector
  • 61.
    Overview Emerging diseaseSeasonal disease Theory vs. data References Case I: r1 r2, equal R0 0.000 0.025 0.050 0.075 0 25 50 75 100 125 time density variable I1 I2 0.0 0.2 0.4 0 25 50 75 100 125 time fractionofstrain1
  • 62.
    Overview Emerging diseaseSeasonal disease Theory vs. data References Case II: R0,1 R0,2, equal r 0.00 0.05 0.10 0.15 0.20 0 25 50 75 100 125 time density variable I1 I2 0.5 0.6 0.7 0.8 0.9 1.0 0 25 50 75 100 125 time fractionofstrain1
  • 63.
    Overview Emerging diseaseSeasonal disease Theory vs. data References Case III: R0,1 R0,2, r2 r1 0.00 0.05 0.10 0.15 0 25 50 75 100 125 time density variable I1 I2 0.5 0.6 0.7 0.8 0.9 1.0 0 25 50 75 100 125 time fractionofstrain1
  • 64.
    Overview Emerging diseaseSeasonal disease Theory vs. data References Outline 1 Overview The evolution of host-pathogen theory Toy models 2 Transient virulence and emerging diseases Overview Toy model Myxomatosis data 3 Transient virulence and seasonality Overview Toy model WNV data 4 More on theory vs. data Tradeo curves Conclusions
  • 65.
    Overview Emerging diseaseSeasonal disease Theory vs. data References Titer vs infectiousness q q q q q q q q q q q q q q q q 0.0 0.2 0.4 0.6 4 6 8 titer Transmissionprobability source q q q q Dohm Tiawsirisup_2005_VBZD Turell_altjmh Turell_JME
  • 66.
    Overview Emerging diseaseSeasonal disease Theory vs. data References Titer curves (American crows) 1e−04 1e−02 1e+00 2 4 6 8 day transmissionprobability strain BIRD1153 KEN KENsub NY99 P991 P991sub TM171−03−pp5 TM173−03−pp1 TWN301
  • 67.
    Overview Emerging diseaseSeasonal disease Theory vs. data References Transmission vs clearance for WNV BIRD1153 BIRD1461 NY99 TM171−03−pp5 BIRD1153 KEN KENsub NY99P991 TM171−03−pp5 TWN301 0.0 0.2 0.4 0.6 0.00 0.25 0.50 0.75 1.00 Clearance rate (1/infectious period) Averagetransmissionrate species a a sparrow amcrow
  • 68.
    Overview Emerging diseaseSeasonal disease Theory vs. data References Outline 1 Overview The evolution of host-pathogen theory Toy models 2 Transient virulence and emerging diseases Overview Toy model Myxomatosis data 3 Transient virulence and seasonality Overview Toy model WNV data 4 More on theory vs. data Tradeo curves Conclusions
  • 69.
    Overview Emerging diseaseSeasonal disease Theory vs. data References Estimating tradeo curves Usually assume a tradeo between virulence and transmission Positive correlation virulence and transmissibility (or proxies) known from many systems (Lipsitch and Moxon, 1997) the shape of tradeo curves is largely unknown
  • 70.
    Overview Emerging diseaseSeasonal disease Theory vs. data References Malaria (Mackinnon and Read, 1999b; Paul et al., 2004) q q qq 0 500 1000 1500 0 20 40 60 80 100 Scaled virulence %mosquitoesinfected Plasmodium gallinaceum q low−dose mixed high−dose mixed SL Thai q q q q qq q q 10 15 20 25 10 15 20 25 Maximum parasitemia Overallinfection(%) Plasmodium chabaudi
  • 71.
    Overview Emerging diseaseSeasonal disease Theory vs. data References Pasteuria ramosa (Jensen et al., 2006) qqqqq q q q qq q q q qqq qq q q q q q qq qq q q q q 0 1 2 3 4 5 0.00 0.02 0.04 0.06 0.08 0.10 0.12 Scaled virulence Spores/day(×106 ) qqqqq q q q qq q q q qqq qq q q q q q qq qq q q q q
  • 72.
    Overview Emerging diseaseSeasonal disease Theory vs. data References HIV (Fraser et al., 2007) 0 10 20 30 40 50 60 0.0 0.1 0.2 0.3 0.4 0.5 Transmissionrate eq epi
  • 73.
    Overview Emerging diseaseSeasonal disease Theory vs. data References HIV dynamics (Shirre et al., 2011)
  • 74.
    Overview Emerging diseaseSeasonal disease Theory vs. data References Phage dynamics (Berngruber et al., 2013)
  • 75.
    Overview Emerging diseaseSeasonal disease Theory vs. data References What about space? Theory: spatial structure should select for decreased virulence Experiment: viscosity decreases infectivity in Plodia (Boots and Mealor, 2007) Are we ready for space?
  • 76.
    Overview Emerging diseaseSeasonal disease Theory vs. data References Outline 1 Overview The evolution of host-pathogen theory Toy models 2 Transient virulence and emerging diseases Overview Toy model Myxomatosis data 3 Transient virulence and seasonality Overview Toy model WNV data 4 More on theory vs. data Tradeo curves Conclusions
  • 77.
    Overview Emerging diseaseSeasonal disease Theory vs. data References Conclusions Eco-evolutionary dynamics of virulence are still plausible (Alizon et al., 2009; Luo and Koelle, 2013) Sensitive to genetic variance and shape of tradeo curve Theory meets molecular biology: mutations of large eect vs. quantitative variability
  • 78.
    Overview Emerging diseaseSeasonal disease Theory vs. data References Conclusions Eco-evolutionary dynamics of virulence are still plausible (Alizon et al., 2009; Luo and Koelle, 2013) Sensitive to genetic variance and shape of tradeo curve Theory meets molecular biology: mutations of large eect vs. quantitative variability
  • 79.
    Overview Emerging diseaseSeasonal disease Theory vs. data References Crome (1997) on theory When we regard theories as tight, real entities and devote ourselves to their analysis, we can limit our horizons and, worse, attempt to make the world t them. A lot of ecological discussion is not about nature, but about theories, generalizations, or models supposed to represent nature . . .
  • 80.
    Overview Emerging diseaseSeasonal disease Theory vs. data References References Abrams, P.A., 2001. Ecol Lett, 4:166175. Alizon, S., Hurford, A., et al., 2009. J. Evol. Biol., 22:245259. doi:10.1111/j.1420-9101.2008.01658.x. Anderson, R.M., Fraser, C., et al., 2004. Phil Trans R Soc London B, 359(1447):10911105. Berngruber, T.W., Froissart, R., et al., 2013. PLoS Pathog, 9(3):e1003209. doi:10.1371/journal.ppat.1003209. Boots, M. and Mealor, M., 2007. Science, 315(5816):12841286. Crome, F.H.J., 1997. In W.F. Laurance and J. Richard O. Bierregard, editors, Tropical Forest Remnants: Ecology, Management and Conservation of Fragmented Communities, chapter 31, pages 485501. University of Chicago Press, Chicago. Day, T. and Proulx, S.R., 2004. Amer Nat, 163(4):E40E63. Dwyer, G., Levin, S., and Buttel, L., 1990. Ecol Monog, 60:423447. Ebert, D., 1998. Science, 282(5393):14321435. Fenner, F., Day, M.F., and Woodroofe, G.M., 1956. J Hyg (London), 54(2):284302. Frank, S.A., 1996. Q Rev Biol, 71(1):3778. Fraser, C., Hollingsworth, T.D., et al., 2007. PNAS, 104:1744117446. Jensen, K.H., Little, T., et al., 2006. PLoS Biology, 4(7):e197. Knell, R.J., 2004. Proc R Soc London B, 271:S174S176. Lenski, R.E. and May, R.M., 1994. J Theor Biol, 169:253265. Lipsitch, M. and Moxon, E.R., 1997. Trends Microbiol, 5(1):3137. Luo, S. and Koelle, K., 2013. The American Naturalist, 181(S1):S58S75. ISSN 0003-0147. doi:10.1086/669952. Mackinnon, M.J. and Read, A.F., 1999a. Evolution, 53(3):689703. , 1999b. Proc R Soc London B, 266(1420):741748. Paul, R.E.L., Lafond, T., et al., 2004. BMC Evol Biol, 4:30. Shirre, G., Pellis, L., et al., 2011. PLoS Computational Biology, 7(10). ISSN 1553-734X. doi:10.1371/journal.pcbi.1002185. WOS:000297262700019. Velasco-Hernandez, J.X., Gershgorn, H.B., and Blower, S.M., 2002. Lancet, 2:487493. Wonham, M.J., de Camino-Beck, T., and Lewis, M.A., 2004. Proc R Soc London B, 271:501507.