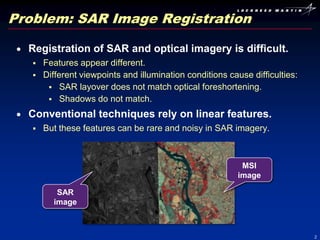
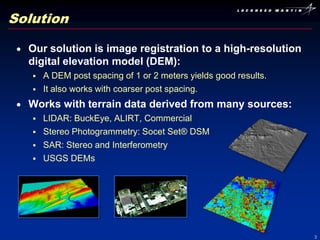
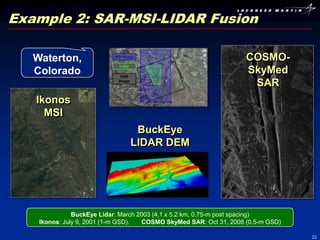
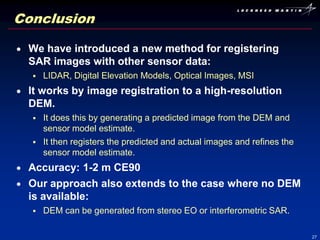
1) The document presents a new method for automatically registering synthetic aperture radar (SAR) imagery to light detection and ranging (LIDAR) data and optical images using digital elevation models (DEMs).
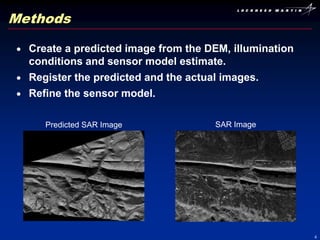
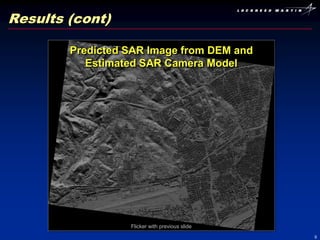
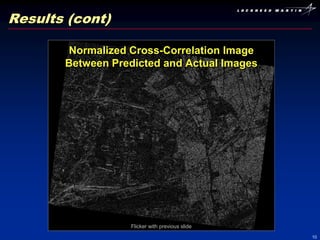
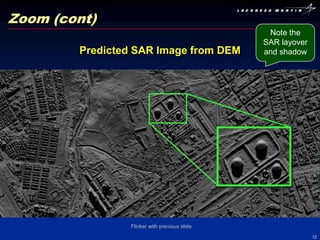
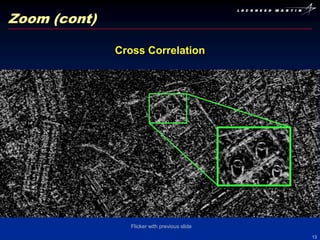
2) The method works by generating a predicted SAR image from the DEM and sensor model, registering this predicted image to the actual SAR image, and refining the sensor model.
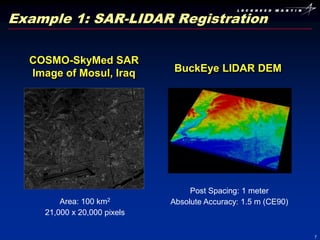
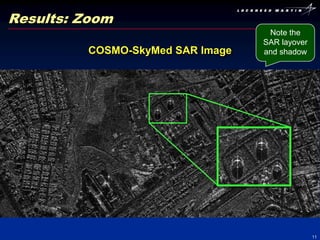
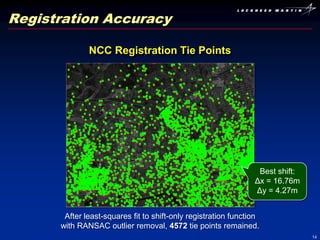
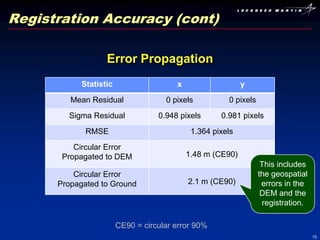
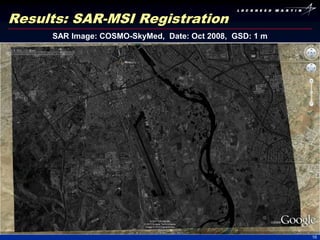
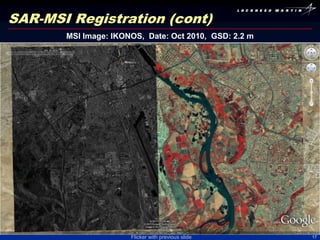
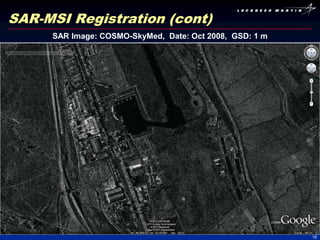
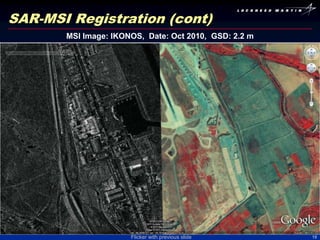
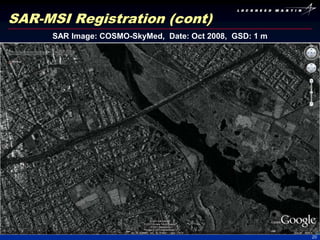
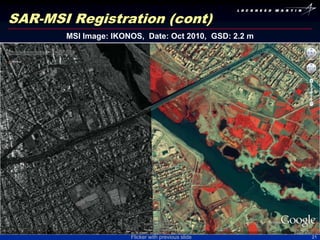
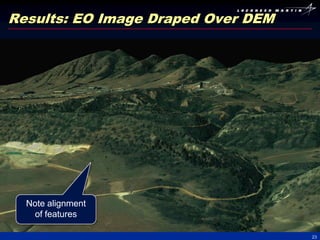
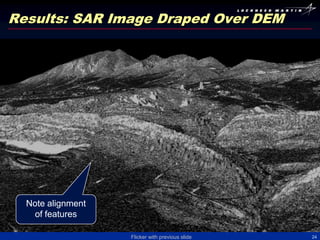
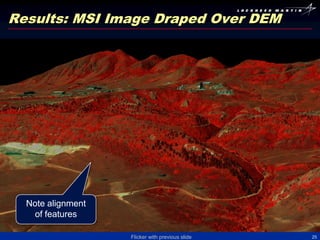
3) The results show accurate registration of SAR imagery to LIDAR DEMs and multispectral imagery, with registration errors of 1-2 meters.


![SSII2021 [OS3-01] 設備や環境の高品質計測点群取得と自動モデル化技術](https://cdn.slidesharecdn.com/ss_thumbnails/os3-02-210605062048-thumbnail.jpg?width=640&height=640&fit=bounds)
![2008 brokerage 03 scalable 3 d models [compatibility mode]](https://cdn.slidesharecdn.com/ss_thumbnails/2008brokerage03-scalable3dmodelscompatibilitymode-100413035231-phpapp01-thumbnail.jpg?width=640&height=640&fit=bounds)


![2008 brokerage 04 smart vision system [compatibility mode]](https://cdn.slidesharecdn.com/ss_thumbnails/2008brokerage04-smartvisionsystemcompatibilitymode-100413033730-phpapp01-thumbnail.jpg?width=640&height=640&fit=bounds)


![Getting Started with Apache Spark: Big Data Made Simple [Free Meetup]](https://cdn.slidesharecdn.com/ss_thumbnails/apachesparkgettingstarted-260203175547-8361bcc3-thumbnail.jpg?width=640&height=640&fit=bounds)


