Downloaded 428 times

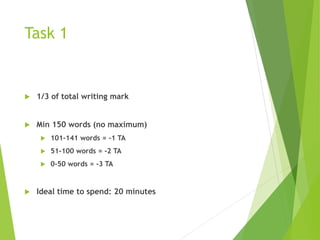
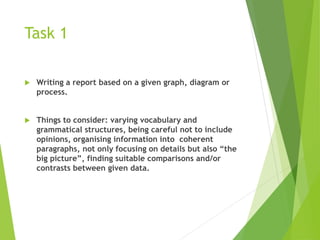
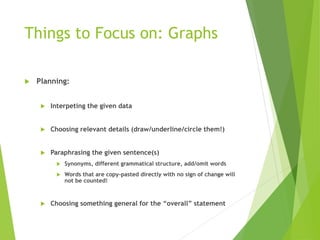
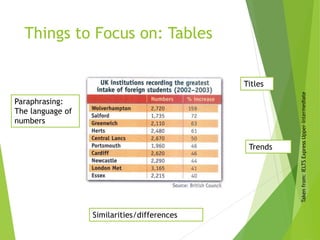
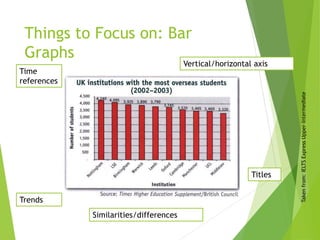
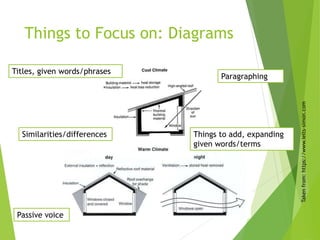
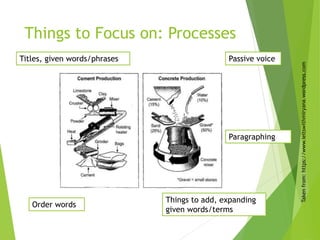
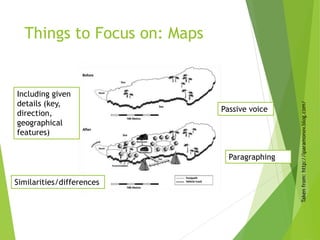

This document provides guidance on writing Task 1 of the IELTS Academic test. It discusses writing a report based on information presented in a graph, diagram, or other visual. Key points include spending 20 minutes on the task, writing between 150-279 words, focusing on interpreting details and finding comparisons or contrasts, and including an overall statement that captures the main trend shown. Tips are provided for writing about different visual formats like graphs, pie charts, tables, bar graphs, diagrams, processes, and maps. Important elements to discuss are trends over time, similarities and differences, and rephrasing numerical details.


