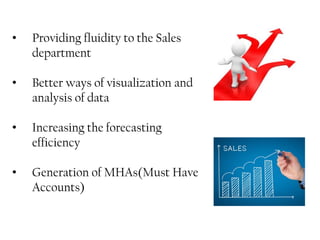
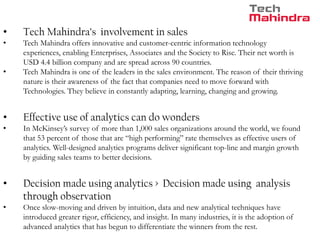
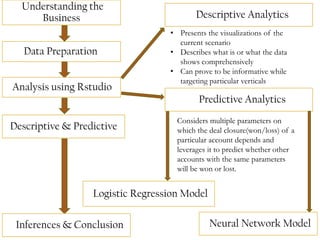
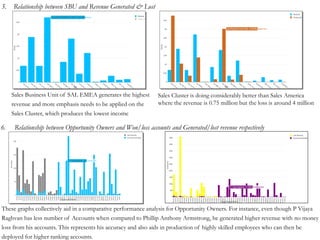
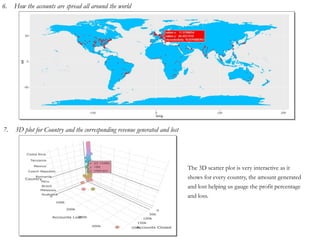
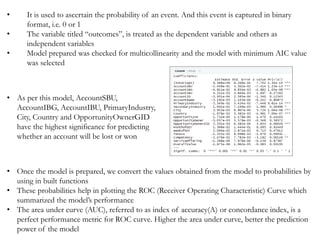
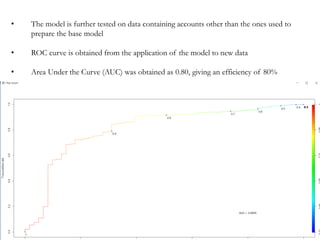
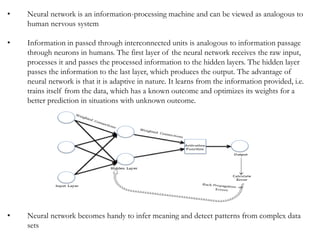
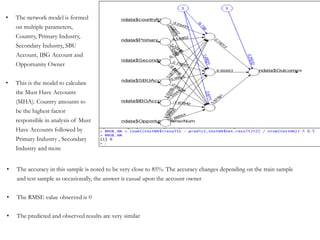
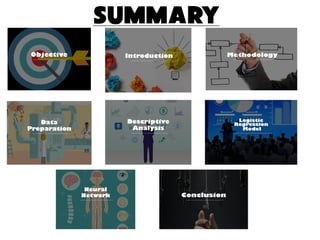
Leveraging data
analysis for
sales
Internship Project
Objective
• Providing fluidity to the Sales
department
• Better ways of visualization and
analysis of data
• Increasing the forecasting
efficiency
• Generation of MHAs(Must Have
Accounts)
Introduction
• Tech Mahindra’s involvement in sales
• Tech Mahindra offers innovative and customer-centric information technology
experiences, enabling Enterprises, Associates and the Society to Rise. Their net worth is
USD 4.4 billion company and are spread across 90 countries.
• Tech Mahindra is one of the leaders in the sales environment. The reason of their thriving
nature is their awareness of the fact that companies need to move forward with
Technologies. They believe in constantly adapting, learning, changing and growing.
• Effective use of analytics can do wonders
• In McKinsey’s survey of more than 1,000 sales organizations around the world, we found
that 53 percent of those that are “high performing” rate themselves as effective users of
analytics. Well-designed analytics programs deliver significant top-line and margin growth
by guiding sales teams to better decisions.
• Decision made using analytics > Decision made using analysis
through observation
• Once slow-moving and driven by intuition, data and new analytical techniques have
introduced greater rigor, efficiency, and insight. In many industries, it is the adoption of
advanced analytics that has begun to differentiate the winners from the rest.
Methodology
Understanding the
Business
Data Preparation
Analysis using Rstudio
Descriptive & Predictive
Descriptive Analytics
Predictive Analytics
Logistic Regression Model
Neural Network ModelInferences & Conclusion
• Presents the visualizations of the
current scenario
• Describes what is or what the data
shows comprehensively
• Can prove to be informative while
targeting particular verticals
Considers multiple parameters on
which the deal closure(won/loss) of a
particular account depends and
leverages it to predict whether other
accounts with the same parameters
will be won or lost.
Data
Preparation
• Data preparation is a process to ensure that
information being readied for analysis is
accurate and consistent
• Data is often created with missing values,
inaccuracies or other errors. Additionally,
data sets stored in separate files or databases
often have different formats that need to be
reconciled
• The process of correcting inaccuracies,
performing verification and joining data sets
constitutes a big part of the data preparation
process.
Parameter Meaning
AccountIBG Independent Business Group
AccountIBU Independent Business Unit
AccountID ID of the account
AccountName Name of the opportunity
AccountSBU Sales Business Unit of the Account
City City from where organization functions from
Competency Qualified in doing which task
Country Country from where organization functions from
Date Date when the Account was created
MonthofQtr Which Quarter it is in
OpportunityID ID assigned to the opportunity
OpportunityOwner Name of the Opportunity Owner
OpportunityOwner
GID
Reference Number of Opportunity Owner
Outcomes Account Closed or Lost
OverallValue Revenue Generated/Lost by that Account
PrimaryIndustry Organization involved in what kind of Industry
SecondaryIndustry Secondary Industry Involved in
ServiceOffering Overall division of Services
Tenure Time elapsed since the deal has been active
WeekofQtr Which week of that Quarter it is in
Descriptive
Analysis
1. Stacked Chart between Number of Accounts Lost/Committed Country Wise
2. Time Series Analysis on Number of Accounts created
The graph represents that
Maximum number of Accounts
were accomplished in United
States and Bolivia but the
highest win: lose ratio is evident
in Hungary.
The time series analysis pastes a
very pellucid picture, that most
years, whenever there was a raise
in the number of accounts
created, it was in the Fourth
Quarter, explaining that most
accounts opened in the last
quarter of a financial year.
3. Time Series Analysis on Number of Accounts created
In the year 2016-2017, it was observed
that the creation of accounts was
stagnant throughout the first half of the
whole year.
4. Distribution of Accounts according to their primary and secondary industries
5. Relationship between SBU and Revenue Generated & Lost
Sales Business Unit of SAL EMEA generates the highest
revenue and more emphasis needs to be applied on the
Sales Cluster, which produces the lowest income
Sales Cluster is doing considerably better than Sales America
where the revenue is 0.75 million but the loss is around 4 million
6. Relationship between Opportunity Owners and Won/loss accounts and Generated/lost revenue respectively
These graphs collectively aid in a comparative performance analysis for Opportunity Owners. For instance, even though P Vijaya
Raghvan has less number of Accounts when compared to Phillip Anthony Armstrong, he generated higher revenue with no money
loss from his accounts. This represents his accuracy and also aids in production of highly skilled employees who can then be
deployed for higher ranking accounts.
6. How the accounts are spread all around the world
7. 3D plot for Country and the corresponding revenue generated and lost
The 3D scatter plot is very interactive as it
shows for every country, the amount generated
and lost helping us gauge the profit percentage
and loss.
Logistic
Regression
Model
• Once the model is prepared, we convert the values obtained from the model to probabilities by
using in built functions
• These probabilities help in plotting the ROC (Receiver Operating Characteristic) Curve which
summarized the model’s performance
• The area under curve (AUC), referred to as index of accuracy(A) or concordance index, is a
perfect performance metric for ROC curve. Higher the area under curve, better the prediction
power of the model
• It is used to ascertain the probability of an event. And this event is captured in binary
format, i.e. 0 or 1
• The variable titled “outcomes”, is treated as the dependent variable and others as
independent variables
• Model prepared was checked for multicollinearity and the model with minimum AIC value
was selected
• As per this model, AccountSBU,
AccountIBG, AccountIBU, PrimaryIndustry,
City, Country and OpportunityOwnerGID
have the highest significance for predicting
whether an account will be lost or won
• The model is further tested on data containing accounts other than the ones used to
prepare the base model
• ROC curve is obtained from the application of the model to new data
• Area Under the Curve (AUC) was obtained as 0.80, giving an efficiency of 80%
Neural
Network
• Neural network is an information-processing machine and can be viewed as analogous to
human nervous system
• Information in passed through interconnected units is analogous to information passage
through neurons in humans. The first layer of the neural network receives the raw input,
processes it and passes the processed information to the hidden layers. The hidden layer
passes the information to the last layer, which produces the output. The advantage of
neural network is that it is adaptive in nature. It learns from the information provided, i.e.
trains itself from the data, which has a known outcome and optimizes its weights for a
better prediction in situations with unknown outcome.
• Neural network becomes handy to infer meaning and detect patterns from complex data
sets
• The network model is formed
on multiple parameters,
Country, Primary Industry,
Secondary Industry, SBU
Account, IBG Account and
Opportunity Owner
• This is the model to calculate
the Must Have Accounts
(MHA). Country amounts to
be the highest factor
responsible in analysis of Must
Have Accounts followed by
Primary Industry , Secondary
Industry and more
• The accuracy in this sample is noted to be very close to 85%. The accuracy changes depending on the train sample
and test sample as occasionally, the answer is casual upon the account owner
• The RMSE value observed is 0
• The predicted and observed results are very similar
Conclusion
• We have been able to formulate a palatable code which can be deployed on
versatile datasets. When the parameters are fulfilled i.e. data has all of them, the
code can be executed which will provide all the aspects mentioned in Result
Analysis. The goal of the project to allow the team to have more information
about the current scenario of sales on multiple verticals, was reached
• Descriptive Analysis – It exhibited multiple relationships between the
parameters of dataset. Analytics present the visualization providing the current
scenario of the company and where they need to move forward on the verticals
n industry acquisition, countries to be targeted, account segregation on product
levels
• Predictive Analysis – The two models focused on a more prospective analysis
which in turn can aid in the current scheduling. The achieved task here was the
generation of MHA i.e. the MUST HAVE ACCOUNTS. Models consider
multiple parameters involved in final decision on the accounts survival and
then leverages it to get an outcome on future accounts
• The significance of the project is to create new opportunities in terms of
accounts, ameliorating skills of Opportunity Owners by being more aware and
continue towards further advancement of the organization in the market
SUMMARY
THANK
YOU

Leveraging Data Analysis for Sales

  • 1.
  • 2.
  • 3.
    • Providing fluidityto the Sales department • Better ways of visualization and analysis of data • Increasing the forecasting efficiency • Generation of MHAs(Must Have Accounts)
  • 4.
  • 5.
    • Tech Mahindra’sinvolvement in sales • Tech Mahindra offers innovative and customer-centric information technology experiences, enabling Enterprises, Associates and the Society to Rise. Their net worth is USD 4.4 billion company and are spread across 90 countries. • Tech Mahindra is one of the leaders in the sales environment. The reason of their thriving nature is their awareness of the fact that companies need to move forward with Technologies. They believe in constantly adapting, learning, changing and growing. • Effective use of analytics can do wonders • In McKinsey’s survey of more than 1,000 sales organizations around the world, we found that 53 percent of those that are “high performing” rate themselves as effective users of analytics. Well-designed analytics programs deliver significant top-line and margin growth by guiding sales teams to better decisions. • Decision made using analytics > Decision made using analysis through observation • Once slow-moving and driven by intuition, data and new analytical techniques have introduced greater rigor, efficiency, and insight. In many industries, it is the adoption of advanced analytics that has begun to differentiate the winners from the rest.
  • 6.
  • 7.
    Understanding the Business Data Preparation Analysisusing Rstudio Descriptive & Predictive Descriptive Analytics Predictive Analytics Logistic Regression Model Neural Network ModelInferences & Conclusion • Presents the visualizations of the current scenario • Describes what is or what the data shows comprehensively • Can prove to be informative while targeting particular verticals Considers multiple parameters on which the deal closure(won/loss) of a particular account depends and leverages it to predict whether other accounts with the same parameters will be won or lost.
  • 8.
  • 9.
    • Data preparationis a process to ensure that information being readied for analysis is accurate and consistent • Data is often created with missing values, inaccuracies or other errors. Additionally, data sets stored in separate files or databases often have different formats that need to be reconciled • The process of correcting inaccuracies, performing verification and joining data sets constitutes a big part of the data preparation process. Parameter Meaning AccountIBG Independent Business Group AccountIBU Independent Business Unit AccountID ID of the account AccountName Name of the opportunity AccountSBU Sales Business Unit of the Account City City from where organization functions from Competency Qualified in doing which task Country Country from where organization functions from Date Date when the Account was created MonthofQtr Which Quarter it is in OpportunityID ID assigned to the opportunity OpportunityOwner Name of the Opportunity Owner OpportunityOwner GID Reference Number of Opportunity Owner Outcomes Account Closed or Lost OverallValue Revenue Generated/Lost by that Account PrimaryIndustry Organization involved in what kind of Industry SecondaryIndustry Secondary Industry Involved in ServiceOffering Overall division of Services Tenure Time elapsed since the deal has been active WeekofQtr Which week of that Quarter it is in
  • 10.
  • 11.
    1. Stacked Chartbetween Number of Accounts Lost/Committed Country Wise 2. Time Series Analysis on Number of Accounts created The graph represents that Maximum number of Accounts were accomplished in United States and Bolivia but the highest win: lose ratio is evident in Hungary. The time series analysis pastes a very pellucid picture, that most years, whenever there was a raise in the number of accounts created, it was in the Fourth Quarter, explaining that most accounts opened in the last quarter of a financial year.
  • 12.
    3. Time SeriesAnalysis on Number of Accounts created In the year 2016-2017, it was observed that the creation of accounts was stagnant throughout the first half of the whole year. 4. Distribution of Accounts according to their primary and secondary industries
  • 13.
    5. Relationship betweenSBU and Revenue Generated & Lost Sales Business Unit of SAL EMEA generates the highest revenue and more emphasis needs to be applied on the Sales Cluster, which produces the lowest income Sales Cluster is doing considerably better than Sales America where the revenue is 0.75 million but the loss is around 4 million 6. Relationship between Opportunity Owners and Won/loss accounts and Generated/lost revenue respectively These graphs collectively aid in a comparative performance analysis for Opportunity Owners. For instance, even though P Vijaya Raghvan has less number of Accounts when compared to Phillip Anthony Armstrong, he generated higher revenue with no money loss from his accounts. This represents his accuracy and also aids in production of highly skilled employees who can then be deployed for higher ranking accounts.
  • 14.
    6. How theaccounts are spread all around the world 7. 3D plot for Country and the corresponding revenue generated and lost The 3D scatter plot is very interactive as it shows for every country, the amount generated and lost helping us gauge the profit percentage and loss.
  • 15.
  • 16.
    • Once themodel is prepared, we convert the values obtained from the model to probabilities by using in built functions • These probabilities help in plotting the ROC (Receiver Operating Characteristic) Curve which summarized the model’s performance • The area under curve (AUC), referred to as index of accuracy(A) or concordance index, is a perfect performance metric for ROC curve. Higher the area under curve, better the prediction power of the model • It is used to ascertain the probability of an event. And this event is captured in binary format, i.e. 0 or 1 • The variable titled “outcomes”, is treated as the dependent variable and others as independent variables • Model prepared was checked for multicollinearity and the model with minimum AIC value was selected • As per this model, AccountSBU, AccountIBG, AccountIBU, PrimaryIndustry, City, Country and OpportunityOwnerGID have the highest significance for predicting whether an account will be lost or won
  • 17.
    • The modelis further tested on data containing accounts other than the ones used to prepare the base model • ROC curve is obtained from the application of the model to new data • Area Under the Curve (AUC) was obtained as 0.80, giving an efficiency of 80%
  • 18.
  • 19.
    • Neural networkis an information-processing machine and can be viewed as analogous to human nervous system • Information in passed through interconnected units is analogous to information passage through neurons in humans. The first layer of the neural network receives the raw input, processes it and passes the processed information to the hidden layers. The hidden layer passes the information to the last layer, which produces the output. The advantage of neural network is that it is adaptive in nature. It learns from the information provided, i.e. trains itself from the data, which has a known outcome and optimizes its weights for a better prediction in situations with unknown outcome. • Neural network becomes handy to infer meaning and detect patterns from complex data sets
  • 20.
    • The networkmodel is formed on multiple parameters, Country, Primary Industry, Secondary Industry, SBU Account, IBG Account and Opportunity Owner • This is the model to calculate the Must Have Accounts (MHA). Country amounts to be the highest factor responsible in analysis of Must Have Accounts followed by Primary Industry , Secondary Industry and more • The accuracy in this sample is noted to be very close to 85%. The accuracy changes depending on the train sample and test sample as occasionally, the answer is casual upon the account owner • The RMSE value observed is 0 • The predicted and observed results are very similar
  • 21.
  • 22.
    • We havebeen able to formulate a palatable code which can be deployed on versatile datasets. When the parameters are fulfilled i.e. data has all of them, the code can be executed which will provide all the aspects mentioned in Result Analysis. The goal of the project to allow the team to have more information about the current scenario of sales on multiple verticals, was reached • Descriptive Analysis – It exhibited multiple relationships between the parameters of dataset. Analytics present the visualization providing the current scenario of the company and where they need to move forward on the verticals n industry acquisition, countries to be targeted, account segregation on product levels • Predictive Analysis – The two models focused on a more prospective analysis which in turn can aid in the current scheduling. The achieved task here was the generation of MHA i.e. the MUST HAVE ACCOUNTS. Models consider multiple parameters involved in final decision on the accounts survival and then leverages it to get an outcome on future accounts • The significance of the project is to create new opportunities in terms of accounts, ameliorating skills of Opportunity Owners by being more aware and continue towards further advancement of the organization in the market
  • 23.
  • 24.