Statistics can provide valuable insights for businesses. Some key areas where statistical analysis can be applied include:
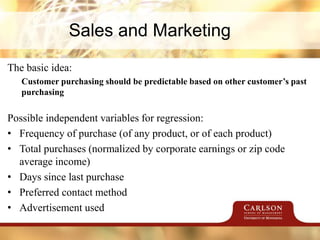
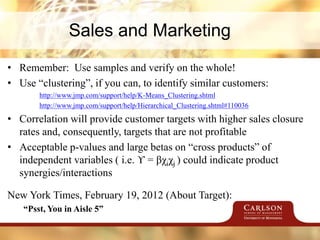
1. Sales and marketing to predict customer purchasing behavior based on variables like past purchases, contact preferences, and advertisements. This allows targeting high-value customers.
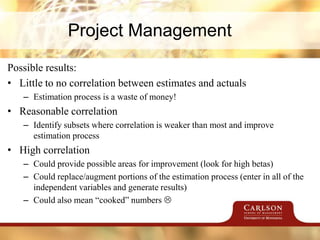
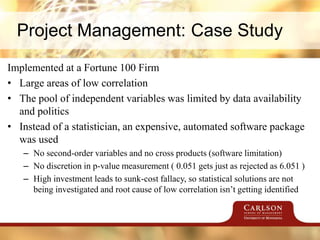
2. Project management to correlate actual costs with estimates and factors like contractors, budgets, and timelines. This improves cost predictions and identifies inefficient processes.
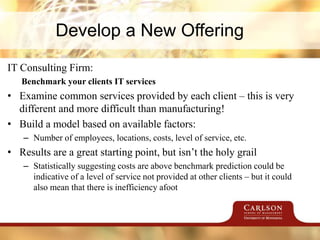
3. Developing new offerings by benchmarking clients and suppliers to find cost inefficiencies and opportunities. Statistical modeling reveals areas for improved performance.
Did you miss RankMiner at ACA International in Denver? Learn more about using Artificial Intelligence and Machine Learning to create a better training model for your contact center.
This presentation is contains slides explaining the basics of big data and predictive analytics.
It also shows how predictive analytics can be used by non programmers by off-the-shelf tools such as RapidMiner, Excel, etc.
The tool for the hands on/demo session in this presentation was RapidMiner 5.1 Community edition
What Is Prescriptive Analytics? Your 5-Minute OverviewShannon Kearns
This slide deck walks you through the basis of understanding prescriptive analytics. Understand the different kinds of prescriptive analytics, how it works, its value, where to find use cases and more!
Join us for another #ImpactSalesforceSaturday, a series of online Salesforce Saturday sessions.
We invite all – Developers – Administrators – Group Leaders – Consultants with advanced, intermediate or beginner level knowledge on Salesforce(Sales Cloud, Service Cloud, Pardot, Marketing Cloud, IOT, CPQ, Einstein, etc).
Topic: Drum into understanding of prediction builder with NBA
Date and Time: Saturday, October 3, 2020,
07:30 PM to 08:30 PM IST
Speaker: Rajat Jain
Rajat is a Salesforce Einstein Champion. He is a 8x Salesforce Certified and Currently working as a Program Specialist at MTX Group.
Agenda:
1. Introduction
2. Drum into understanding of prediction builder with NBA
How Apps Create Return on Investment (ROI) for AnalyticsRiaktr
Ever wondered why your analytics are not returning the results you had expected?
Apps are key to having higher return on investment for analytics. Learn more about our app approach here.
website realimpactanalytics.com
email info@realimpactanalytics.com
Executive Briefing: Introduction to Strategic ExperimentationMetre22
Traditional approaches to strategic analysis focus on finding the single best path forward, but businesses who deal with uncertainty may require a strategic experimentation approach. Find out if this approach is right for you.
Conversion Rate Optimization for Business GrowthReapDigital
Conversion rate optimization is often limited to testing elements of a website. Button colors, button sizes, images and image placements are few common elements that are tested for optimization. Conversion Rate Optimization can be easily used to optimize beyond website elements to optimize business outcomes.
In this webinar, we will discuss how psychological theories, behavioral insights, research insights and insights through usability testing can be used to build hypothesis for testing. We will also discuss how these hypotheses can be effectively tested and implemented to gain optimum business outcomes.
Predictive Conversion Modeling - Lifting Web Analytics to the next levelPetri Mertanen
Annalect presentation at Superweek 2017: Predictive Conversion Modeling - Lifting Web Analytics to the next level. Presented by Petri Mertanen, Director of Digital Analytics and Ron Luhtanen, Data Science Analyst. #SPWK
Measuring the effectiveness of your digital assetsMedullan
In this webinar you’ll learn:
- how to get started with impact measurement - translating business goals into effective measures, KPIs and high level reporting
- how to find actionable insights in measurement data
the art and science of experimentation and product refinement
Designed for finance managers, CFOs, and accountants, this session will examine what key performance indicators nonprofits should look at to gauge their operational efficiency, stewardship of resources, and performance compared to peer organizations. The session will also include a discussion of the tools and data that are available to enhance this process and to improve accountability to donors and other stakeholders.
“You can download this product from SlideTeam.net”
Analyse the human behavior trend to increase the effectiveness of products and services for the consumers. Use professionally designed content-ready Customer Insight PowerPoint Presentation Slides for the better understanding of consumer buying behavior to increase sales. Collect the required information about the customers to acquire, develop and retain customers. Incorporate ready-made customer insight PPT presentation slideshow to comprehend the customer’s choice for their favourite brand, their mindsets, motivations, moods, desires, aspirations, etc. This deck comprises of templates such as research methodology, consumer insight assumptions, need for consumer insights, key statistics, data collection and processing, consumer insight capabilities, consumer insight components, consumer insight characteristics, consumer insight key elements, YouTube analytics, google audience retention tool, google trends, google analytics, consumer insight maturity matrix, consumer engagement principles, etc. These templates are editable. Change color, text, icon, and font size as per your need. Add or remove content, if needed. Get access to the ready-made customer insight PowerPoint templates to connect the interests of the consumer with features of the brand. Advise folks on how to decide correctly with our Customer Insight Powerpoint Presentation Slides. Be able to guide the injudicious. https://bit.ly/3Bo87wP
SIBO Webinar 2015 - Advances in the Treatment and Management of SIBO by Dr N...Nirala Jacobi
This in-depth webinar, free for all health professionals, examines some of the latest advances in the treatment and management of small intestine bacterial overgrowth, or SIBO. SIBO is now understood as a prime cause of leaky gut, IBS and many autoimmune diseases.
Presented by Dr Nirala Jacobi ND, CMO, SIBOTest following the SIBO Symposium at the SIBO Center in Portland, Oregon, June 2015.
Key Learning Objectives:
Updated SIBO assessment and treatment
New information on the autoimmune link to SIBO
Key herbal and conventional strategies
Adhesions and restrictions; often a key element in the development of SIBO..
Metrics & KPIs. Tips To Setup Your Measurement Initiative Right.Michael Tarnowski
Many people start a measurement initiative by defining KPIs and metrics first. - BAD mistake!!
Identify your information needs first, THEN derive the proper metrics! And, there are many other pitfalls more...
Operationalizing Customer Analytics with Azure and Power BICCG
Many organizations fail to realize the value of data science teams because they are not effectively translating the analytic findings produced by these teams into quantifiable business results. This webinar demonstrates how to visualize analytic models like churn and turn their output into action. Senior Business Solution Architect, Mike Druta, presents methods for operationalizing analytic models produced by data science teams into a repeatable process that can be automated and applied continuously using Azure.
BA is used to gain insights that inform business decisions and can be used to automate and optimize business processes. Data-driven companies treat their data as a corporate asset and leverage it for a competitive advantage. Successful business analytics depends on data quality, skilled analysts who understand the technologies and the business, and an organizational commitment to data-driven decision-making.
Business analytics examples
Business analytics techniques break down into two main areas. The first is basic business intelligence. This involves examining historical data to get a sense of how a business department, team or staff member performed over a particular time. This is a mature practice that most enterprises are fairly accomplished at using.
Feature Prioritization Techniques for an Agile PMs by Microsoft PMProduct School
Main takeaways:
-PMs don't need a lot of data points to prioritize the features for the upcoming sprint. They just need to identify the relevant one's.
-PMs should be skilled to strike the balance between agility in making decisions and accuracy of perceived outcomes
-PMs should be able to prioritize the feature requests with minimum data points available and optimum techniques
The five essential steps to building a data productBirst
Building a data-driven product is scary business. You need to get the right platform both for today’s needs and for tomorrow’s possibilities – and then, you need to go beyond the technical to build a go-to-market plan that will set you up for success. Learn the five keys to building a great analytical product from someone who has done it before — and failed! Hear Kevin Smith speak about the mistakes he’s made building data products and how you can benefit from his lessons learned.
Improvement as Data Analyst presents business problems, different problem-solving tools (5 Why, Action Priority Chart, Fishbone, and Flow Mapping), and data analysis process.
Slides Mike Claiborne recently used in his discussion w/ mentees of The Product Mentor.
The Product Mentor is a program designed to pair Product Mentors and Mentees from around the World, across all industries, from start-up to enterprise, guided by the fundamental goals…Better Decisions. Better Products. Better Product People.
Throughout the program, each mentor leads a conversation in an area of their expertise that is live streamed and available to both mentee and the broader product community.
http://TheProductMentor.com
Data Science Introduction by Emerging India AnalyticsAyeshaSharma29
This is the data science basic introduction which covers Big data ,machine learning including supervised machine learning & unsupervised machine learning. This presentation also covers Hadoop tool and its landscape. This will help in deciding where to start your career in data science. It has all the skills you require to build a career in data science industry.
eSavvy webinar: Top 5+1 Tips of How to Maximize the ROI of a CRM InvestmenteSavvy
Do you want to know how to maximize the return of investment in a CRM system? Are you interested to find out how to truly use a CRM system to its full potential and how you can benefit from doing so? Then watch our next webinar, during which our Managing Director David Goad will share with you top tips on how to maximize the ROI of a CRM investment. David has been involved in more than 200 Business Application Implementations and was one of the contributing authors of the proven project management methodology recommended by Microsoft – Dynamics Sure Step. He will use his vast experience and project management knowledge to provide you with valuable insights about how to select your new CRM, how to prepare for CRM deployment projects and what to do during and after the project to maximize the results from your investment.
2. About Me
• Started CEMBA in 2012, switched to part-time after year 1
• Graduated from Carlson in Spring of 2014
• VP, Team Manager at Bank of America within the IT department
• By graduation, presented three stats-based projects, each should
improve net income by $1M to $25M with investment < $500K
Statistics can be immediately monetized!
3. Sales and Marketing
The basic idea:
Customer purchasing should be predictable based on other customer’s past
purchasing
Possible independent variables for regression:
• Frequency of purchase (of any product, or of each product)
• Total purchases (normalized by corporate earnings or zip code
average income)
• Days since last purchase
• Preferred contact method
• Advertisement used
4. Sales and Marketing
• Remember: Use samples and verify on the whole!
• Use “clustering”, if you can, to identify similar customers:
http://www.jmp.com/support/help/K-Means_Clustering.shtml
http://www.jmp.com/support/help/Hierarchical_Clustering.shtml#110036
• Correlation will provide customer targets with higher sales closure
rates and, consequently, targets that are not profitable
• Acceptable p-values and large betas on “cross products” of
independent variables ( i.e. ϒ = βχiχj ) could indicate product
synergies/interactions
New York Times, February 19, 2012 (About Target):
“Psst, You in Aisle 5”
5. Project Management
The basic idea:
Actual Project Cost should be a function of, at least, Project Estimate
Possible independent variables for regression:
• Estimated project cost
• Percentage of work done by contractors and contractor hourly rate
(normalized by employee salary)
• How many silos/which silos are involved
• Expected duration (calendar time or hours of work) of the effort
• Implementing standard tools vs. customization
6. Project Management
Possible results:
• Little to no correlation between estimates and actuals
– Estimation process is a waste of money!
• Reasonable correlation
– Identify subsets where correlation is weaker than most and improve
estimation process
• High correlation
– Could provide possible areas for improvement (look for high betas)
– Could replace/augment portions of the estimation process (enter in all of the
independent variables and generate results)
– Could also mean “cooked” numbers
7. Project Management
Given reasonable or better correlation, expected return on the project,
and identified confidence intervals
• Avoid projects that would be taken without statistical analysis
– If the return for the project is too small to justify the undertaking given a
broad confidence interval, do not do the project
• Take on projects that normally would be skipped
– If the confidence intervals are very narrow, the estimate should be
considered “a lock” and the ROI requirements can be less stringent
8. Project Management: Case Study
Implemented at a Fortune 100 Firm
• Large areas of low correlation
• The pool of independent variables was limited by data availability
and politics
• Instead of a statistician, an expensive, automated software package
was used
– No second-order variables and no cross products (software limitation)
– No discretion in p-value measurement ( 0.051 gets just as rejected as 6.051 )
– High investment leads to sunk-cost fallacy, so statistical solutions are not
being investigated and root cause of low correlation isn’t getting identified
9. Develop a New Offering
MIT Sloan Management Review, Winter 2004:
“The Seller’s Hidden Advantage”
Toyota:
Benchmarked all of its suppliers and made them all more efficient, which
made the suppliers more competitive, which resulted in better prices for
Toyota
Orica:
Developed a 20 variable model from customer use of their explosives that
made each subsequent customer more accurate in their purchase and use
of Orica explosives
10. Develop a New Offering
IT Consulting Firm:
Benchmark your clients IT services
• Examine common services provided by each client – this is very
different and more difficult than manufacturing!
• Build a model based on available factors:
– Number of employees, locations, costs, level of service, etc.
• Results are a great starting point, but isn’t the holy grail
– Statistically suggesting costs are above benchmark prediction could be
indicative of a level of service not provided at other clients – but it could
also mean that there is inefficiency afoot
11. Tips and Tricks
1. Find out where the business unit or company makes or spends a
great deal of money
2. Find out what data can be had
3. Build a model on a sample if data is hard to get or is large
4. Ask for funding and justify with new, interesting results
5. Use the project in this class
6. Avoid using statistics terms (95% confident, Regression, etc.)
7. Expect surprising ignorance
13. Appendix: Clustering
Clustering data is using an algorithm to break a large data set into
smaller data sets:
This data set splits well into two clusters – it isn’t likely that real-life
data sets will be this contrived
14. Appendix: Clustering
Regression will not paint a good picture of the data as a whole:
Splitting the data into the appropriate clusters can lead to more
accurate modeling
15. Appendix: Why Brains Beat Tools
The process to implement a data mining/business intelligence tool:
1. Collect and organize data – usually in a repeatable, programmatic
(automatic) fashion
2. Purchase licenses and install and configure tool set – usually start
with a sample of the data from step 1
3. Examine results and tune tools
4. Act on results
Before any of this happens, a statistician should look to see if there is
actionable data relationships – steps 1 and 2 are very expensive!!
16. Appendix: Why Brains Beat Tools
Possible reasons for detecting a weak relationship:
1. Software does not perform clustering
2. Software does not examine 2nd order or cross product factors
3. Software incorrectly acts on multicollinearity
4. Tool set is improperly tuned/configured
5. Data aggregation mechanism is not functioning properly
6. The data is too random
Without a statistician, all six of these reasons look the same!