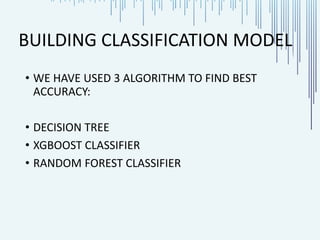
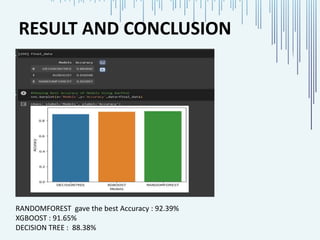
The document presents a project on customer churn analysis in the banking sector, emphasizing the importance of customer retention and data-driven strategies to mitigate churn. It outlines the steps taken, including data exploration, model building using decision tree, random forest, and XGBoost classifiers, and highlights that the random forest model achieved the highest accuracy of 92.39%. Overall, the analysis aims to provide insights for better resource allocation and personalized customer engagement.


![• DROP UNWANTED COLUMNS:
data=data.drop(['CustomerId','Surname','Exited','RowNumber'],axis=1)
we have dropped these columns because it does not have huge impact on
model building. And dropped Exited column because it is Target variable.
• STANDARDIZATION:
Standardization is a preprocessing method used to transform numerical
data by scaling it to have a mean of zero and a standard deviation of one.
This transformation is applied to all features ensuring that they have the
same scale, thus preventing features with larger magnitudes from
dominating the learning algorithm.
• LABEL ENCODER:
As we have Analyzed in EDA we have Total 3 categorical features. Including
the Target column. So before Model building we will convert those into
numerical features,With the help of label encode.](https://image.slidesharecdn.com/harshpakhare-employechurn-240424083421-f02566f5/85/Employee-Churn-Prediction-Artificial-Intelligence-Project-Presentation-12-320.jpg)


![[DSC Europe 25] Andrzej Kowalczyk - AI - how to start small and grow in the f...](https://cdn.slidesharecdn.com/ss_thumbnails/oy1zmo94qv6vpcqjvno2-andrzej-kowalczyk-ai-how-to-start-small-and-grow-in-the-future-1-260119121559-cf093b23-thumbnail.jpg?width=640&height=640&fit=bounds)

![[DSC Europe 25] Slobodan Dolinic - Smart and Intelligent Green Region.pptx](https://cdn.slidesharecdn.com/ss_thumbnails/0bribinjsp6ghwtvsvor-2-sigre-slobodan-dolinic-260115093812-c9c10e90-thumbnail.jpg?width=640&height=640&fit=bounds)


![[DSC Europe 25] Mijat Kustudic - Building Financial Intelligence with AI Agen...](https://cdn.slidesharecdn.com/ss_thumbnails/38y2lb5lse6wstegtvas-3-mijat-kustudic-building-financial-intelligence-with-ai-agents-260114111931-1a4783ce-thumbnail.jpg?width=640&height=640&fit=bounds)


![[DSC Europe 25] Elena Menshikova - AI-Powered Operational Excellence: Revolut...](https://cdn.slidesharecdn.com/ss_thumbnails/es6nholbqy3zaao2c2yd-2-elena-menshikova-data-ai-in-decision-making-260115093812-4fba8b38-thumbnail.jpg?width=640&height=640&fit=bounds)
![[DSC Europe 25] Danilo Djukanovic - From Vibes to KPIs: Turning Culture Into ...](https://cdn.slidesharecdn.com/ss_thumbnails/inqestws5wf0cik2glgv-3-danilo-djukanovic-from-vibes-to-kpis-presentation-260114111931-dacff81f-thumbnail.jpg?width=640&height=640&fit=bounds)