The document discusses the performance evaluation of internal combustion (IC) engines, outlining key parameters such as speed, fuel consumption, and emissions. It emphasizes the importance of accurate testing and measurement to assess engine efficiency and mechanical performance, detailing various methods for measuring specific parameters. Additionally, it highlights the significance of engine design and its impact on performance outcomes, along with the challenges associated with measuring exhaust emissions.

![107
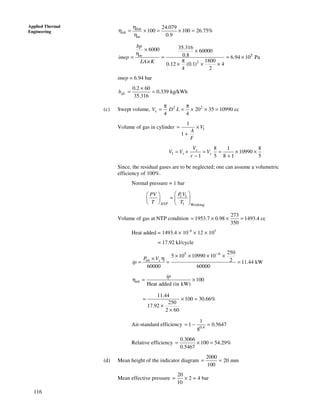
IC Engine TestingPimep = 7.5 bar . . . (1)
Indicated power .
60
impP L A N
I P
× × ×
= =
5 2
7.5 10 0.2 (0.16) 400
4 10.05 kW
60 2
π
× × × ×
= =
×
. . . (2)
Brake Power
2 ( )
2 2.
60 60
b
N W S
NT
B P
π −
π
= = =
2 400 (380 50) 1.2
. 8.294 W
60 2
B P
π × −
= × = . . . (3)
(i) Frictional Power = F.P. = I.P. − B.P.
= 10.05 − 8.294
= 1.756 kW
(ii) Mechanical Efficiency
. 8.294
100 82.53%
. . 10.05
m
B P
I P
η = = × =
(iii) Brake Specific Fuel Consumption (bsfc) :
2.8
0.3376 kg/kW.hr
8.294
= =
(iv) Brake Thermal Efficiency (ηbth
)
. 8.294
100 25.39%
2.8Heat supplied 42000
3600
B P
= = × =
×
Example 7.11
A six-cylinder 4-stroke petrol engine having a bore of 90 mm and stroke of
100 mm has a compression ratio of 7. The relative efficiency with reference to
indicated thermal efficiency is 55% when indicated mean specific fuel
consumption is 0.3 kg/kWh. Estimate the calorific value of the fuel and fuel
consumption in kg/hr. Given that indicated mean effective pressure is 8.5 bar and
speed is 2500 r.p.m.
Solution
Number of cylinders = n1 = 6, L = 100 mm = 0.1 m
d = 90 mm = 0.09 m, r = 7 (P.U. May 2006)
ηr = 55% = 0.55 [based on indicated thermal efficiency]
isfc = 0.3 kg/kWh
Pmi = 8.5 bar
N = 2500 rpm
1.
60000
impP A L N
I P n
× × ×
= ×
where,
2500
1250
2 2
N
n = = = strokes/mm [for 4 stroke engine]
2
4
A d
π
=](https://image.slidesharecdn.com/icenginestesting-160107163126/85/Icengines-testing-29-320.jpg)
![[PPT] on Steam Turbine](https://cdn.slidesharecdn.com/ss_thumbnails/spsharmafinalppt-140608082156-phpapp01-thumbnail.jpg?width=640&height=640&fit=bounds)


