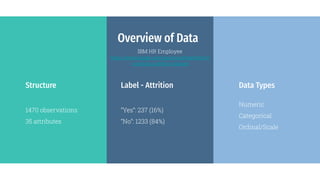
This summary provides an overview of employee attrition based on analysis of an IBM HR dataset:
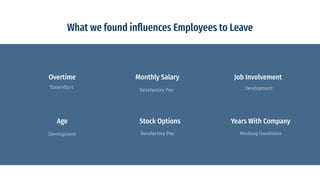
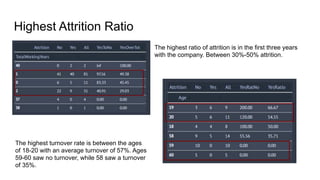
- Key factors that influence employees to leave include monthly salary, overtime work, stock options, years of service, and age. The highest attrition occurs within the first few years and for employees aged 18-20.
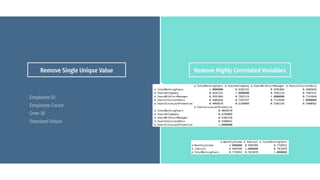
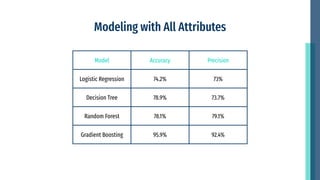
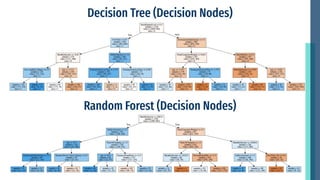
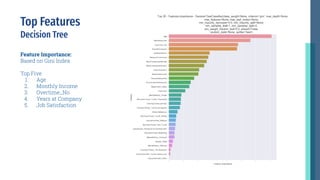
- Modeling identified the most important attributes as overtime, age, monthly income, years of service, and stock options. Characteristics like training opportunities, promotions, and department also impact attrition.
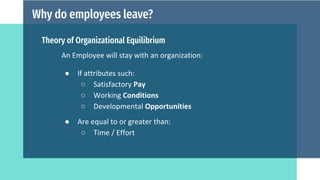
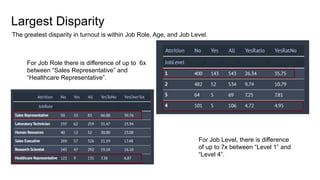
- The analysis found that technical employees are more likely to leave HR roles, and overtime increases attrition across all departments. High job involvement decreases attrition.
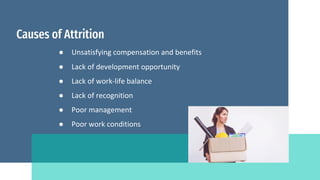
- To reduce attrition, companies


![IBM-HR-Analytics-Employee-Attrition-and-Performance[1].pptx](https://cdn.slidesharecdn.com/ss_thumbnails/ibm-hr-analytics-employee-attrition-and-performance1-251018181740-7e1d1f2b-thumbnail.jpg?width=640&height=640&fit=bounds)


