Download as PDF, PPTX
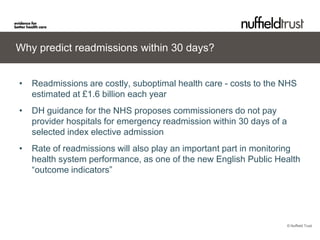

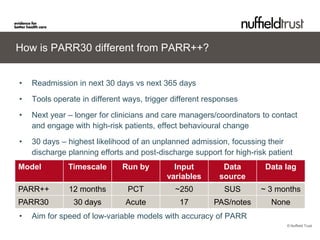
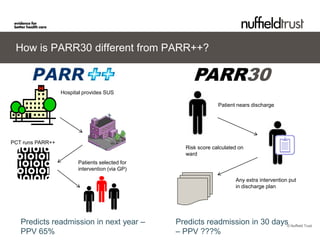
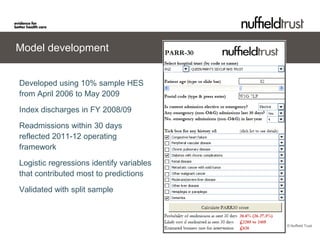
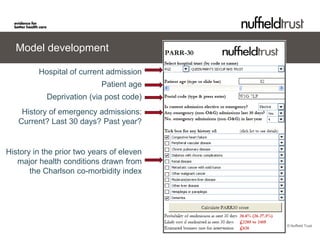
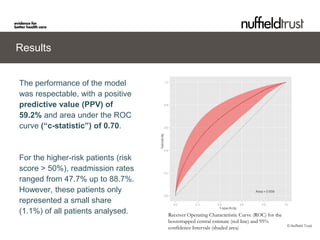


The document describes the PARR-30 model, which predicts hospital readmissions within 30 days of discharge. It was developed using hospital data from 2006-2009 and validated on additional data. The model includes factors like age, deprivation level, recent emergency admissions, and comorbidities. Testing showed it was easy to use and predicted a 59.2% readmission rate for high-risk patients. It could help hospitals plan interventions and reduce readmissions in a cost-effective way.


