
Download as PDF, PPTX
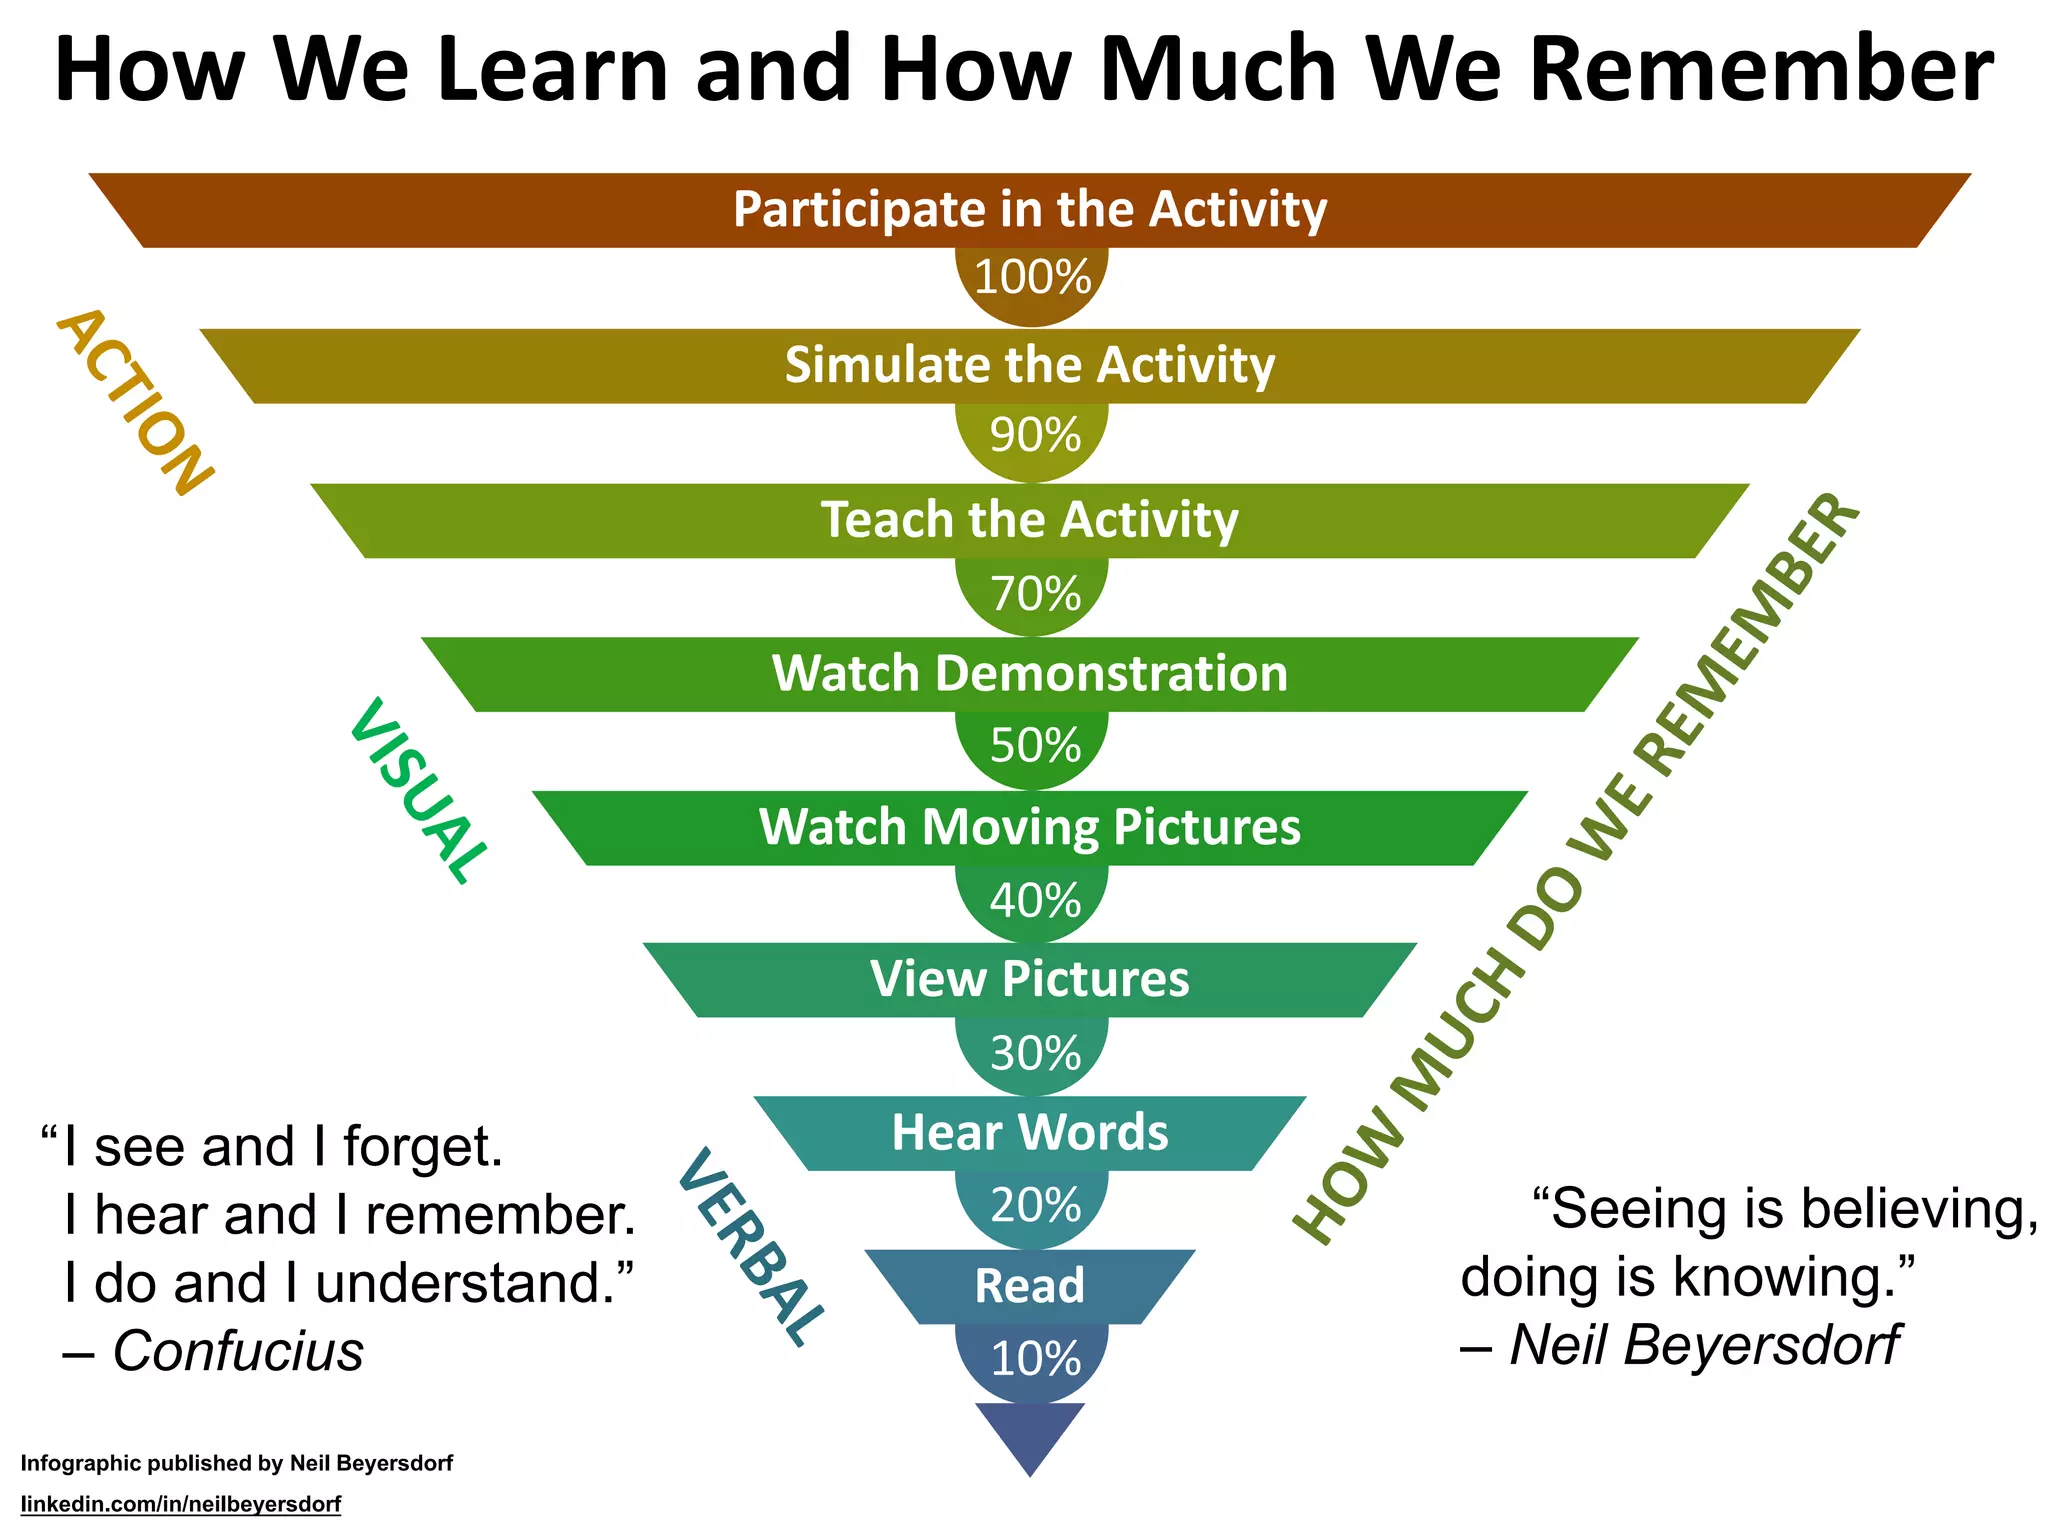
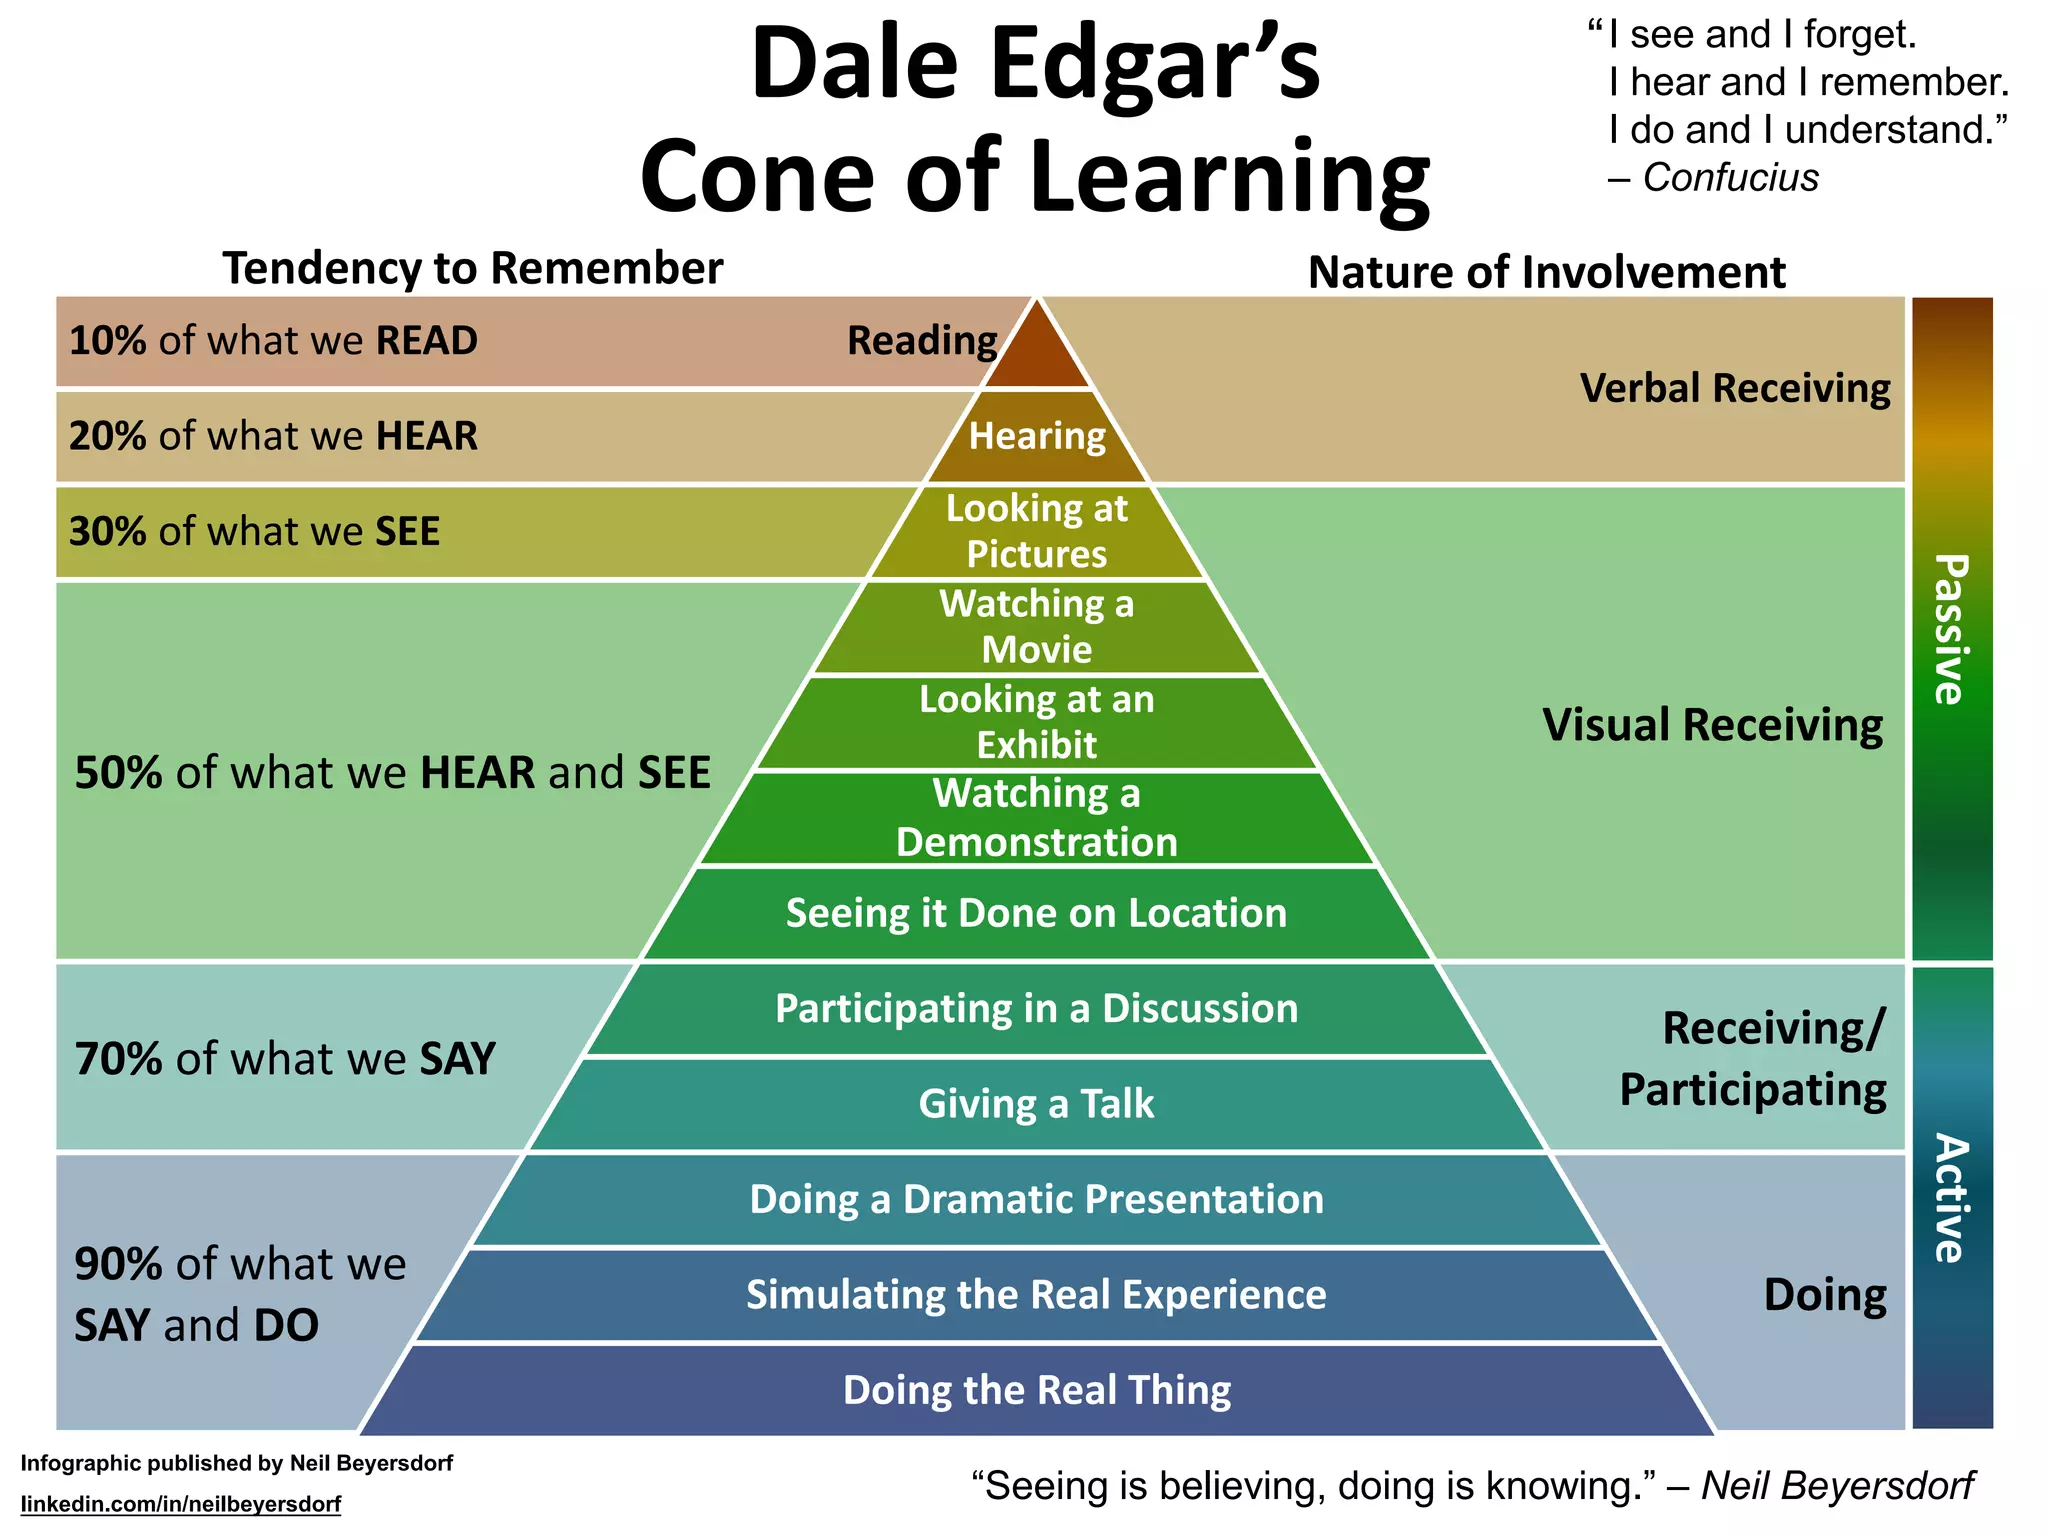
The document presents two infographics about how people learn and retain information. The first infographic shows that people retain 90% of what they say and do, 70% of what they say, 50% of what they hear and see, 30% of what they see, 20% of what they hear, and 10% of what they read. The second infographic illustrates Dale Edgar's Cone of Learning, which demonstrates that retention increases the more actively involved people are, from 10% retention for reading to 90% retention for doing. Both infographics support the quotes that people understand best when they do or experience something directly.


![[QUATIC 2012] PSP PAIR: Personal Software Process Performance Analysis and Im...](https://cdn.slidesharecdn.com/ss_thumbnails/psppairv1-0-120911084246-phpapp02-thumbnail.jpg?width=640&height=640&fit=bounds)


