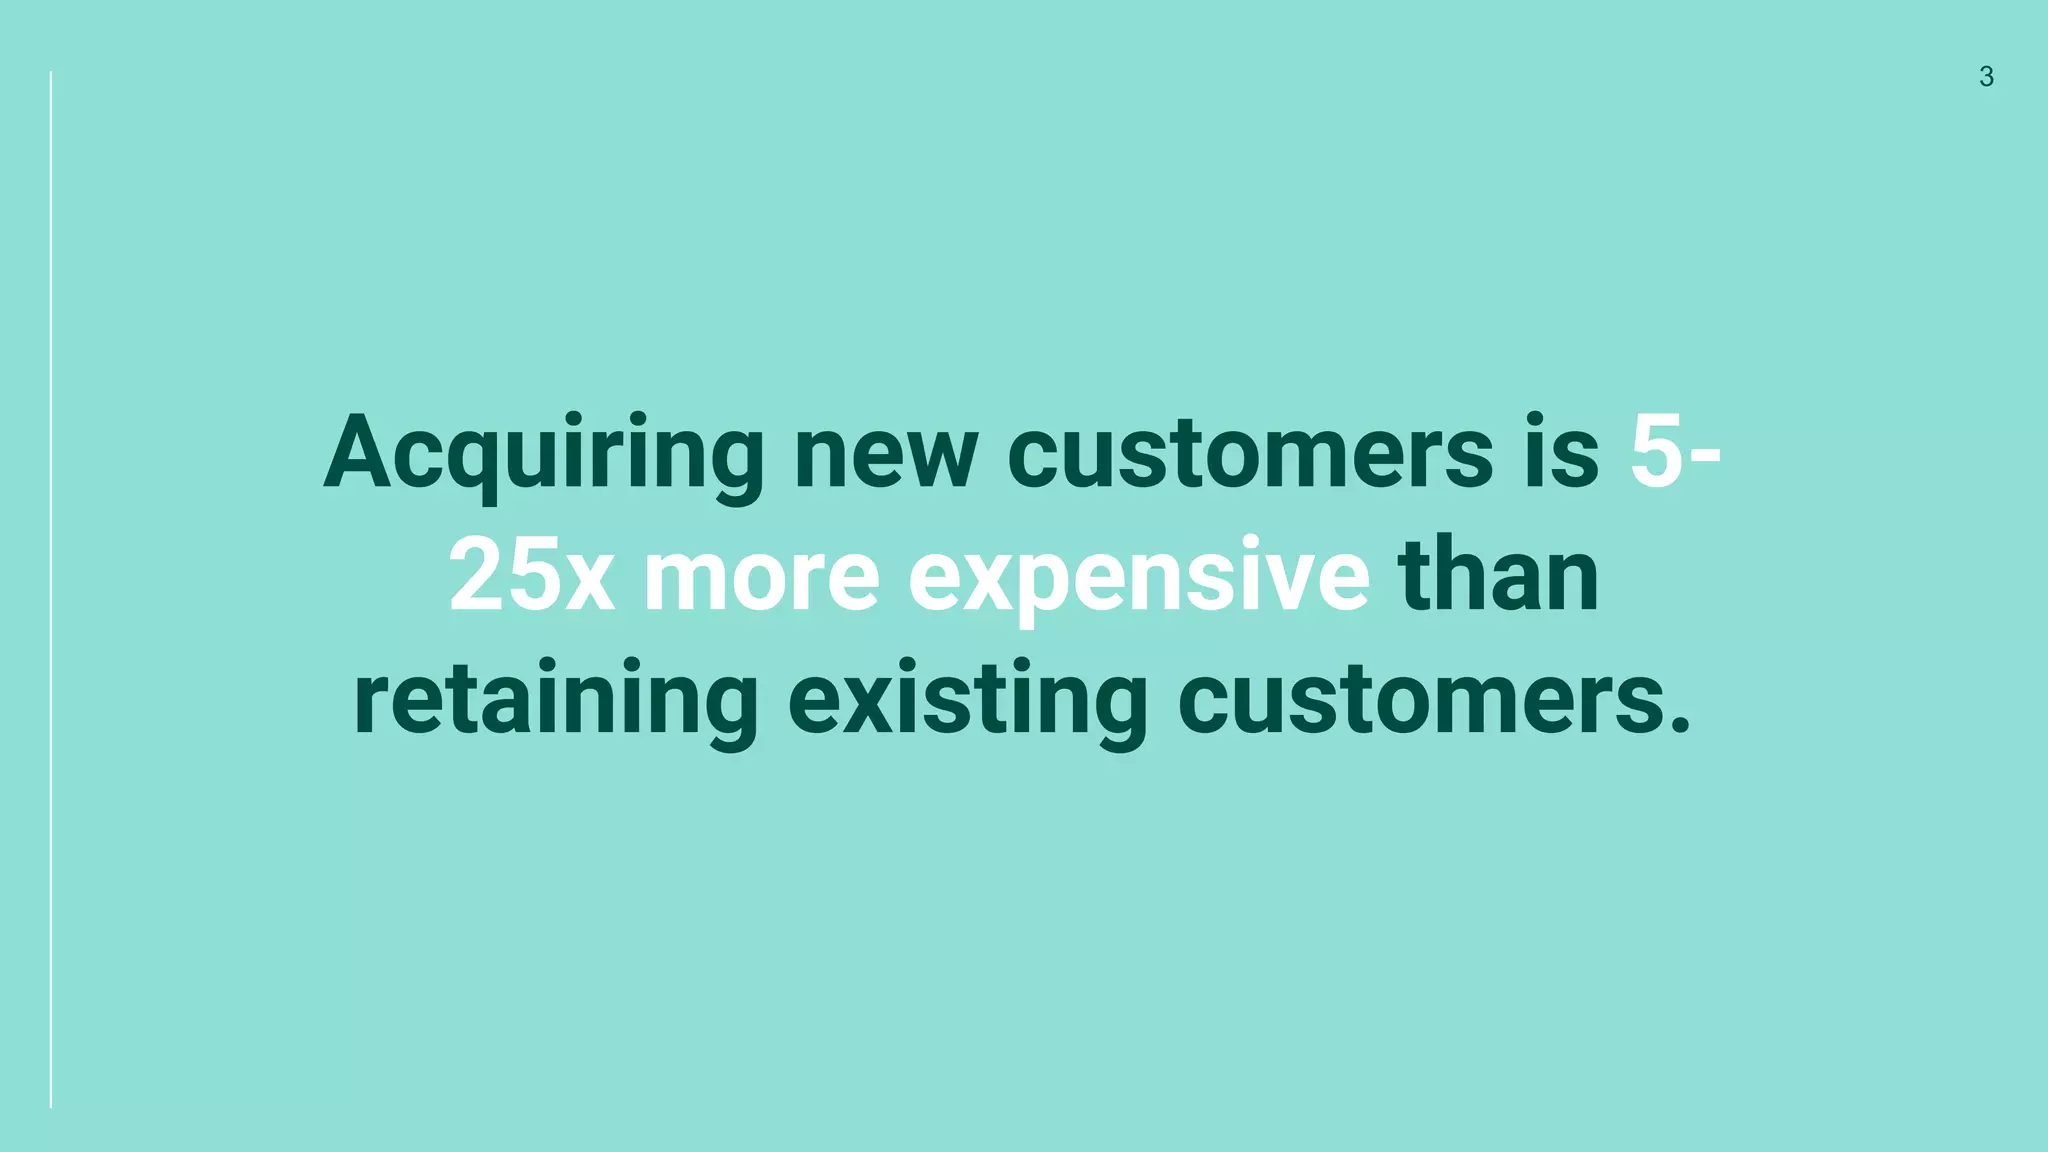
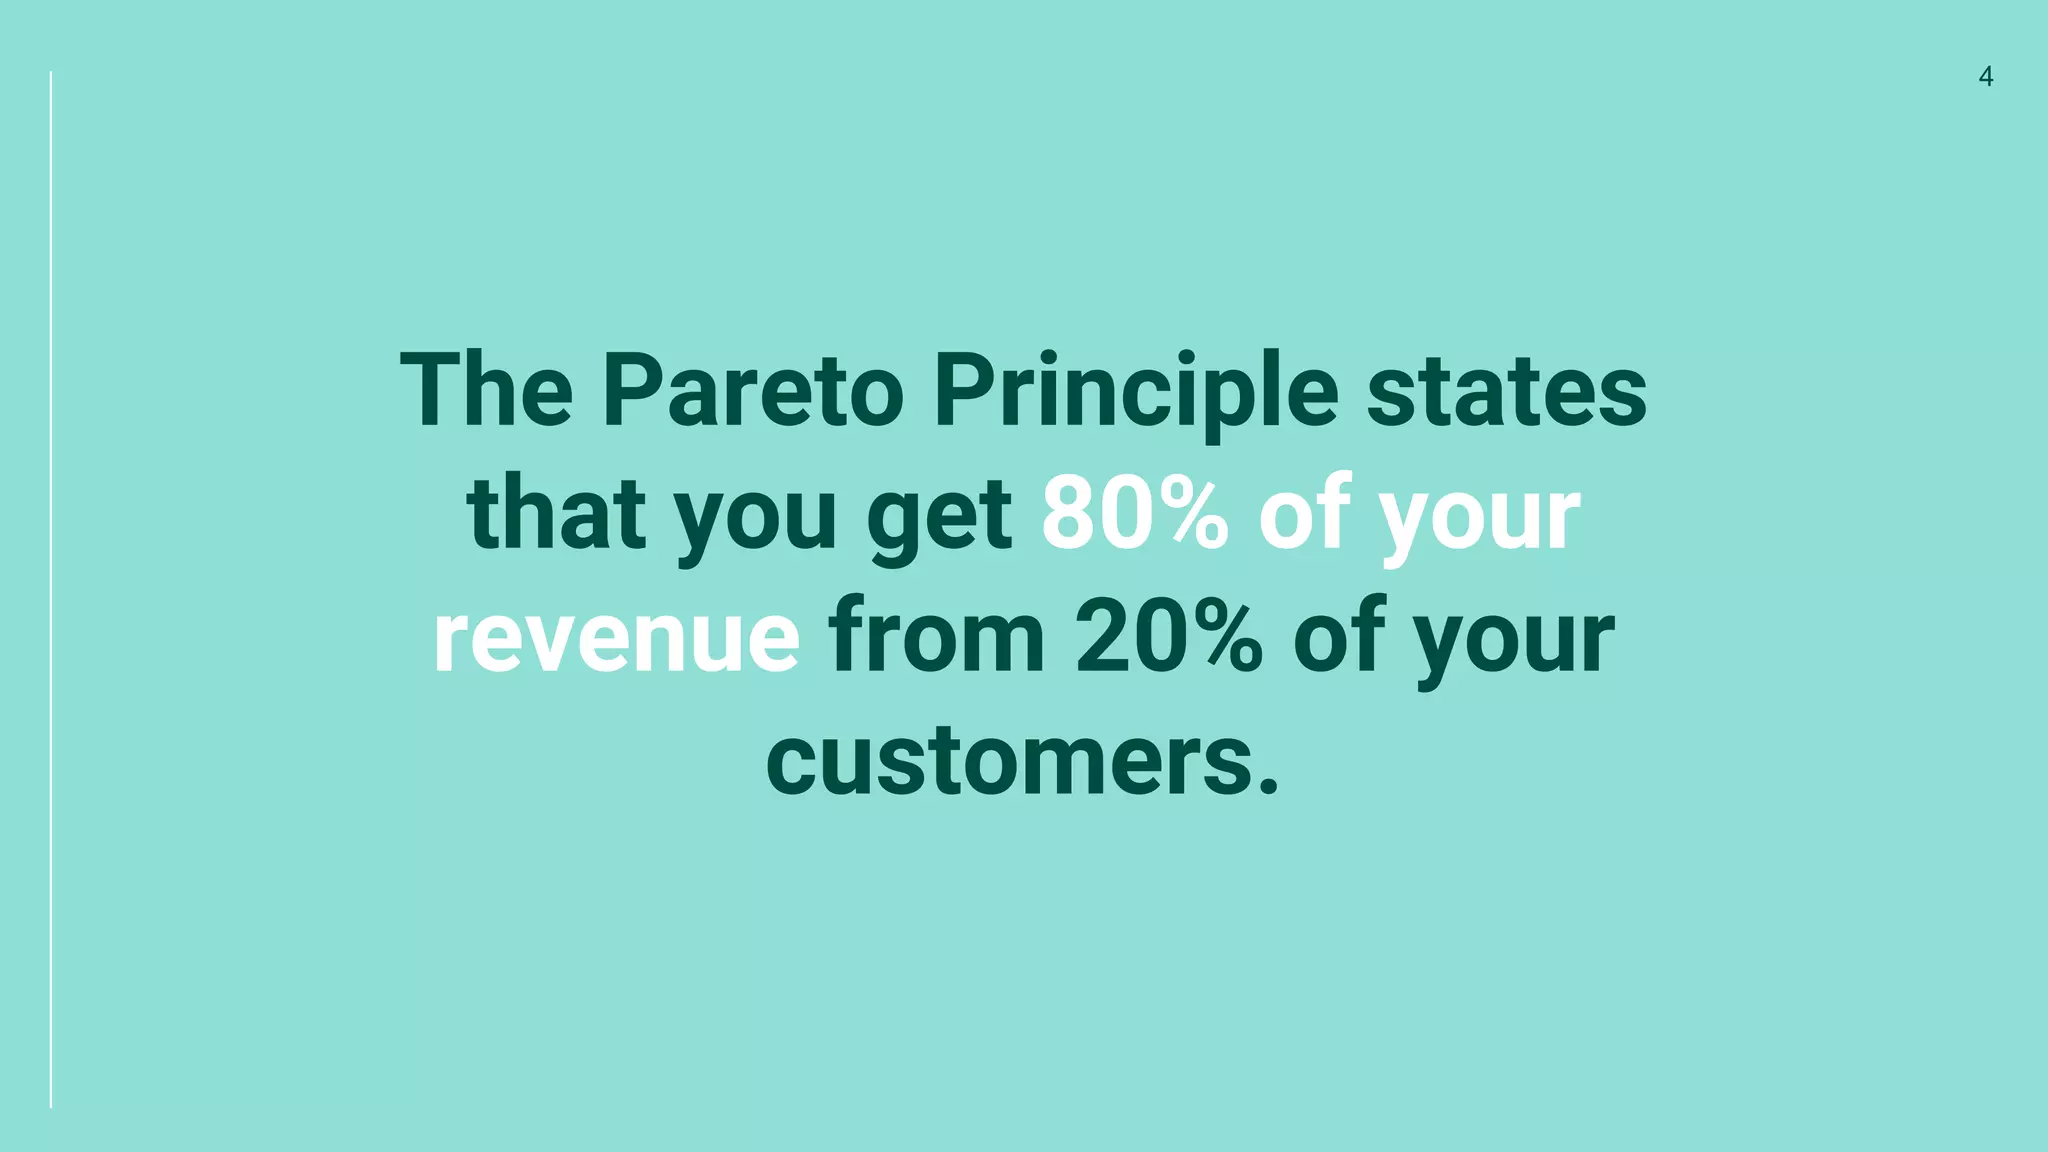
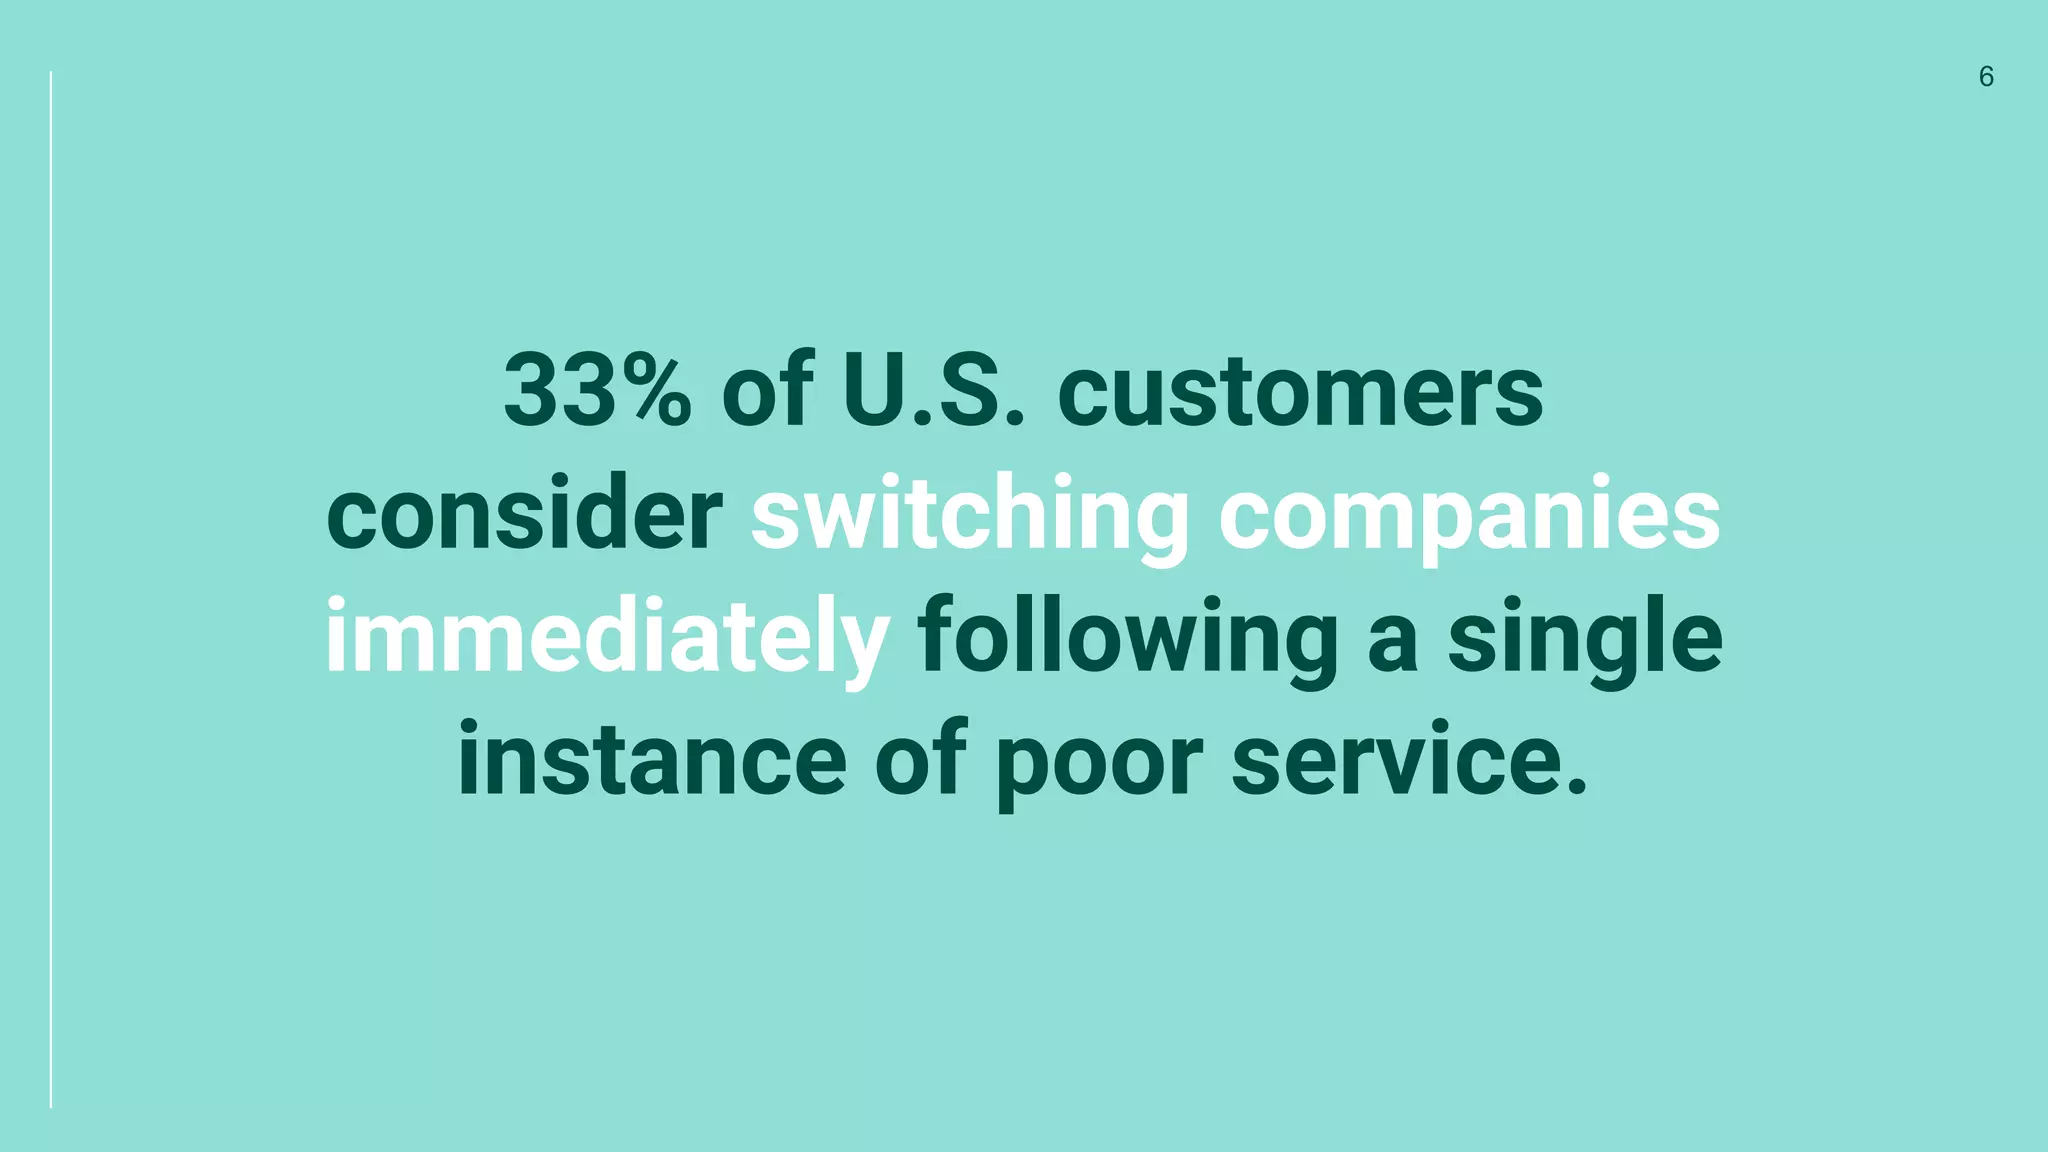
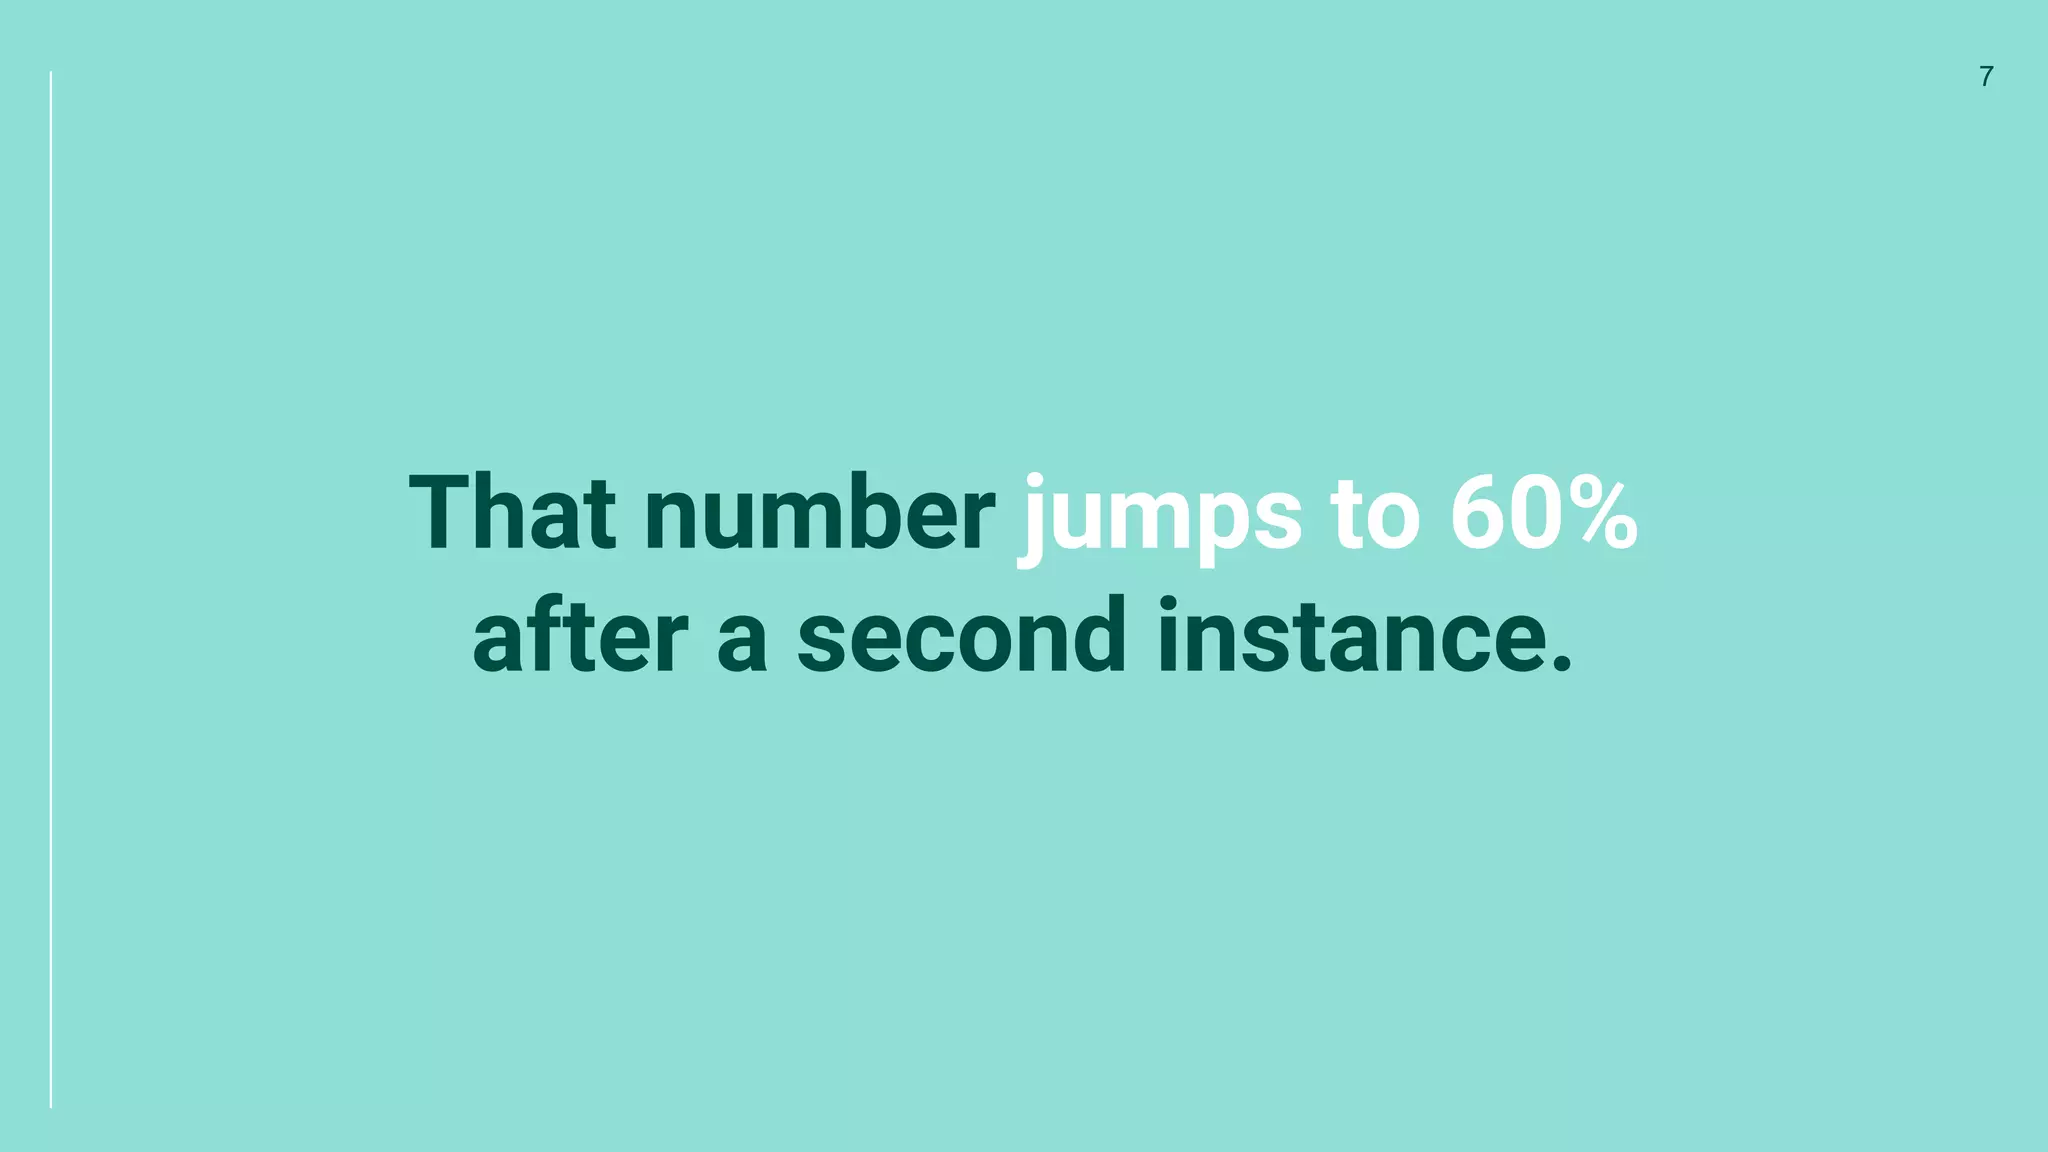
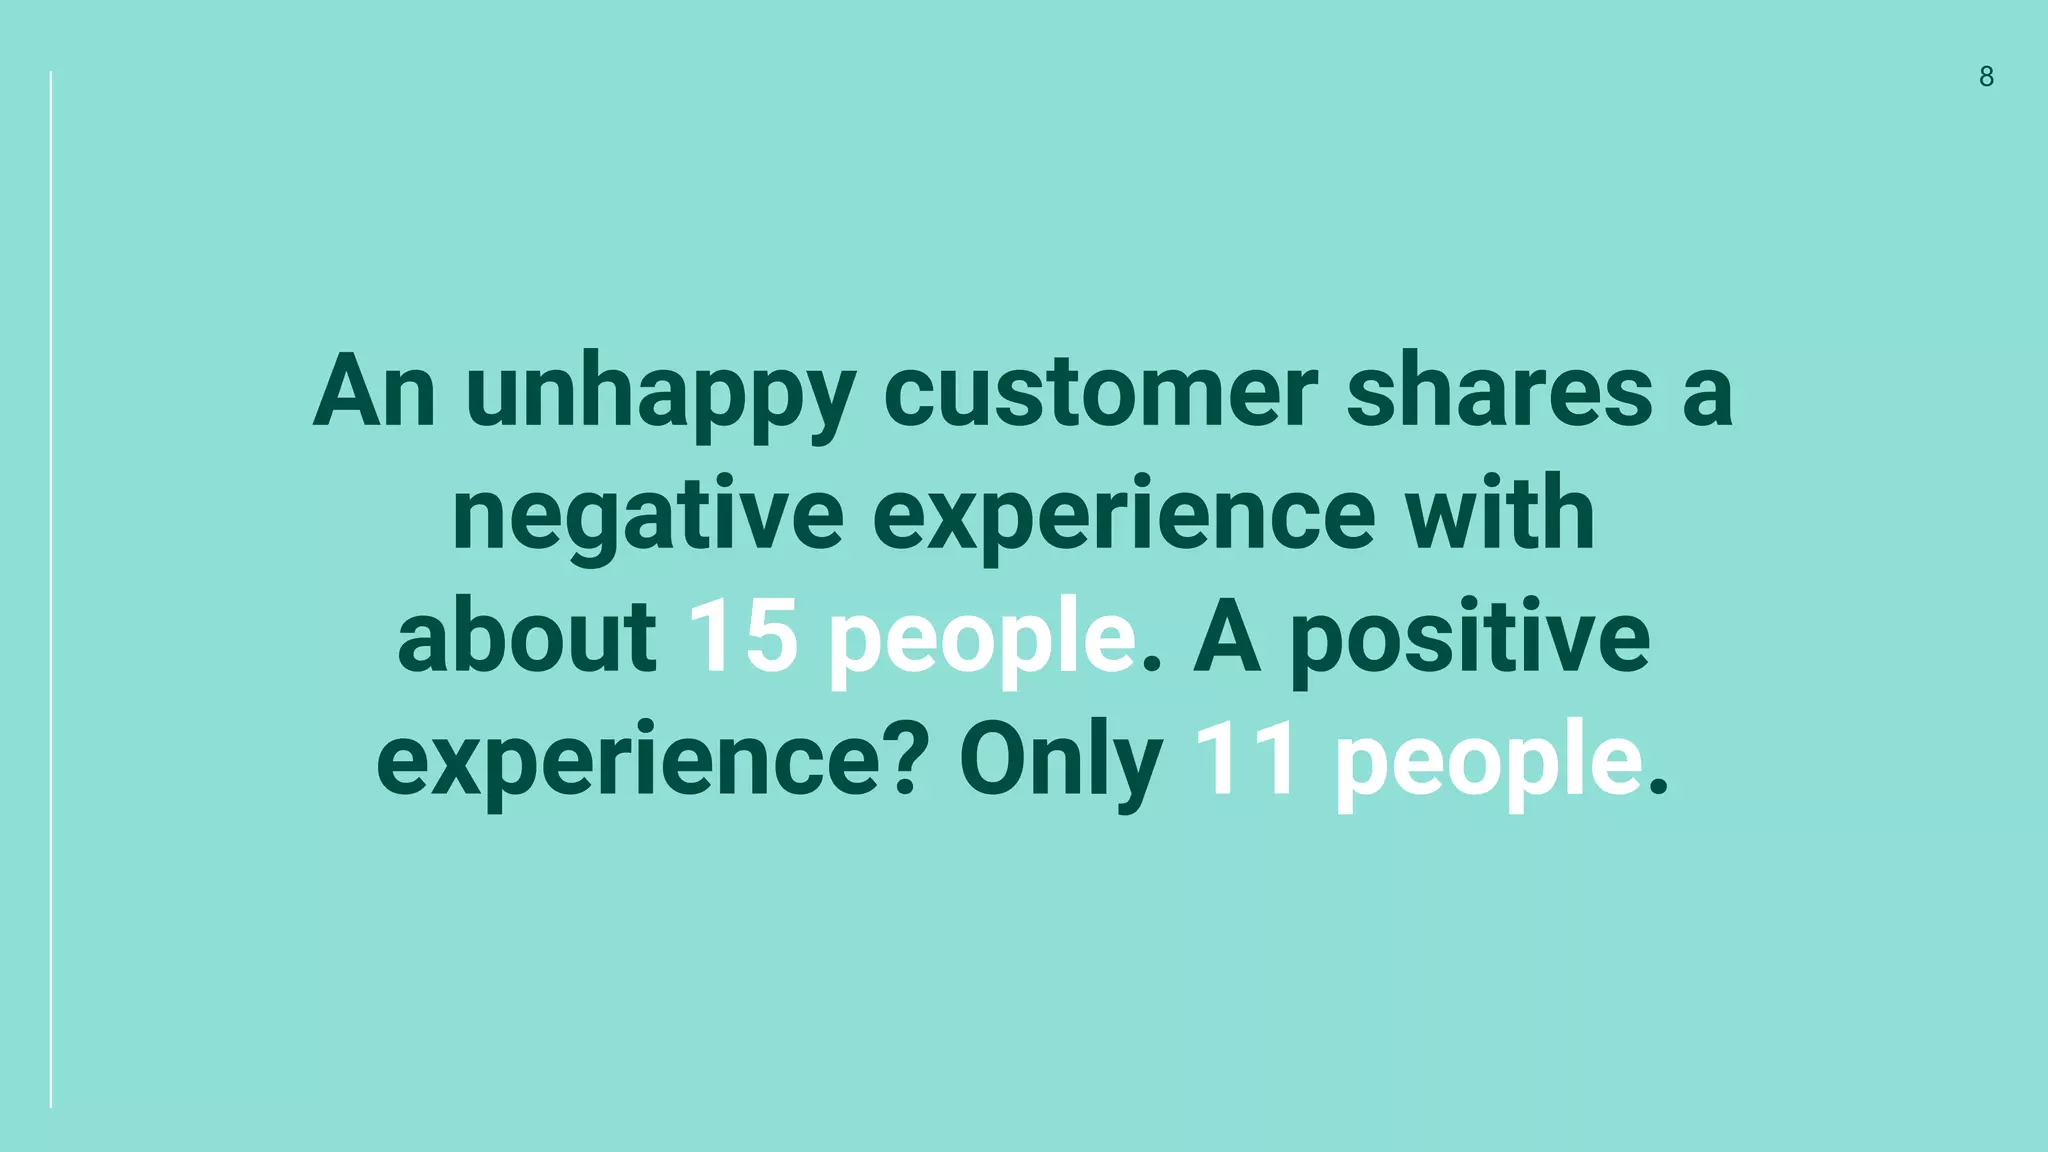
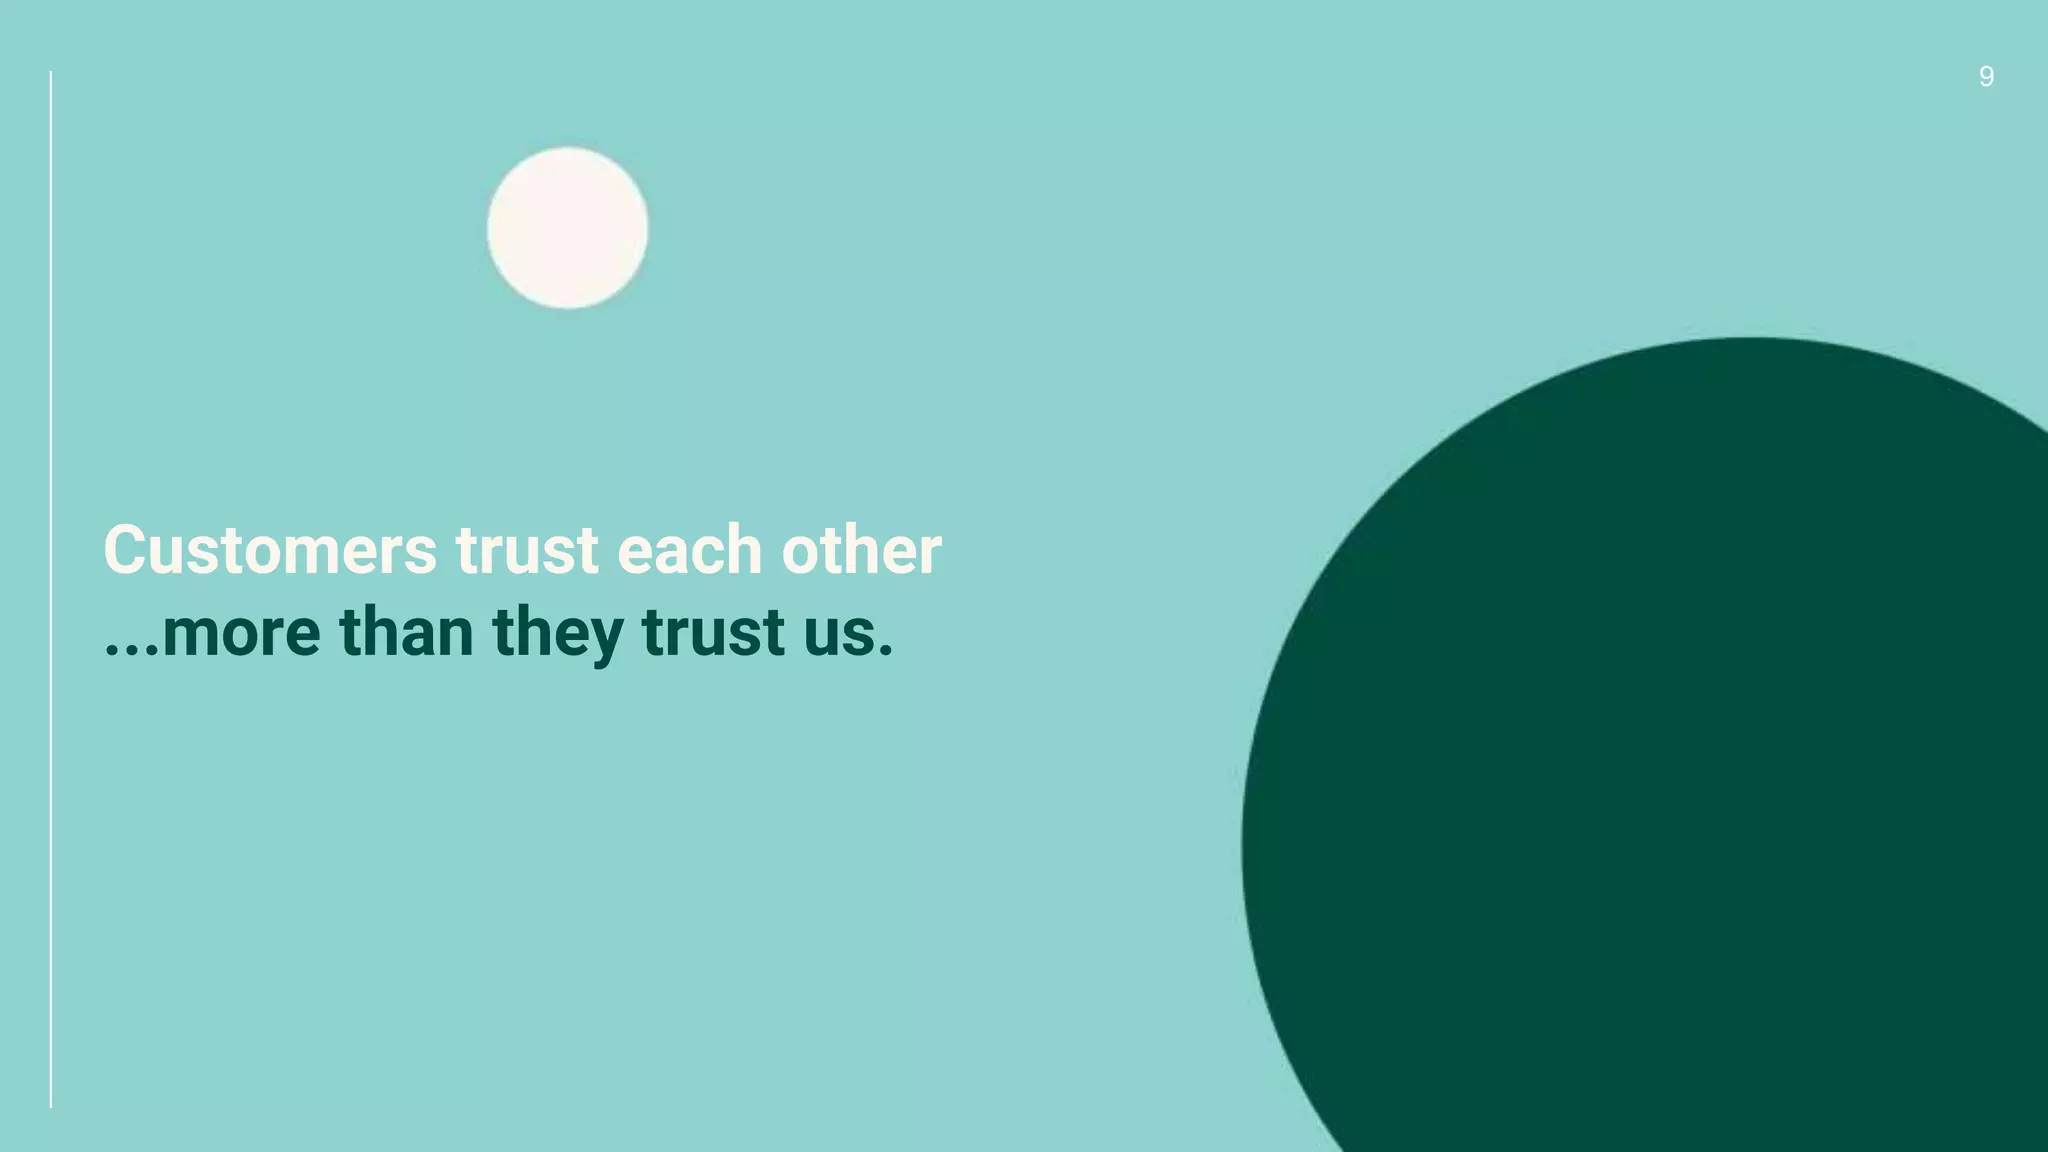
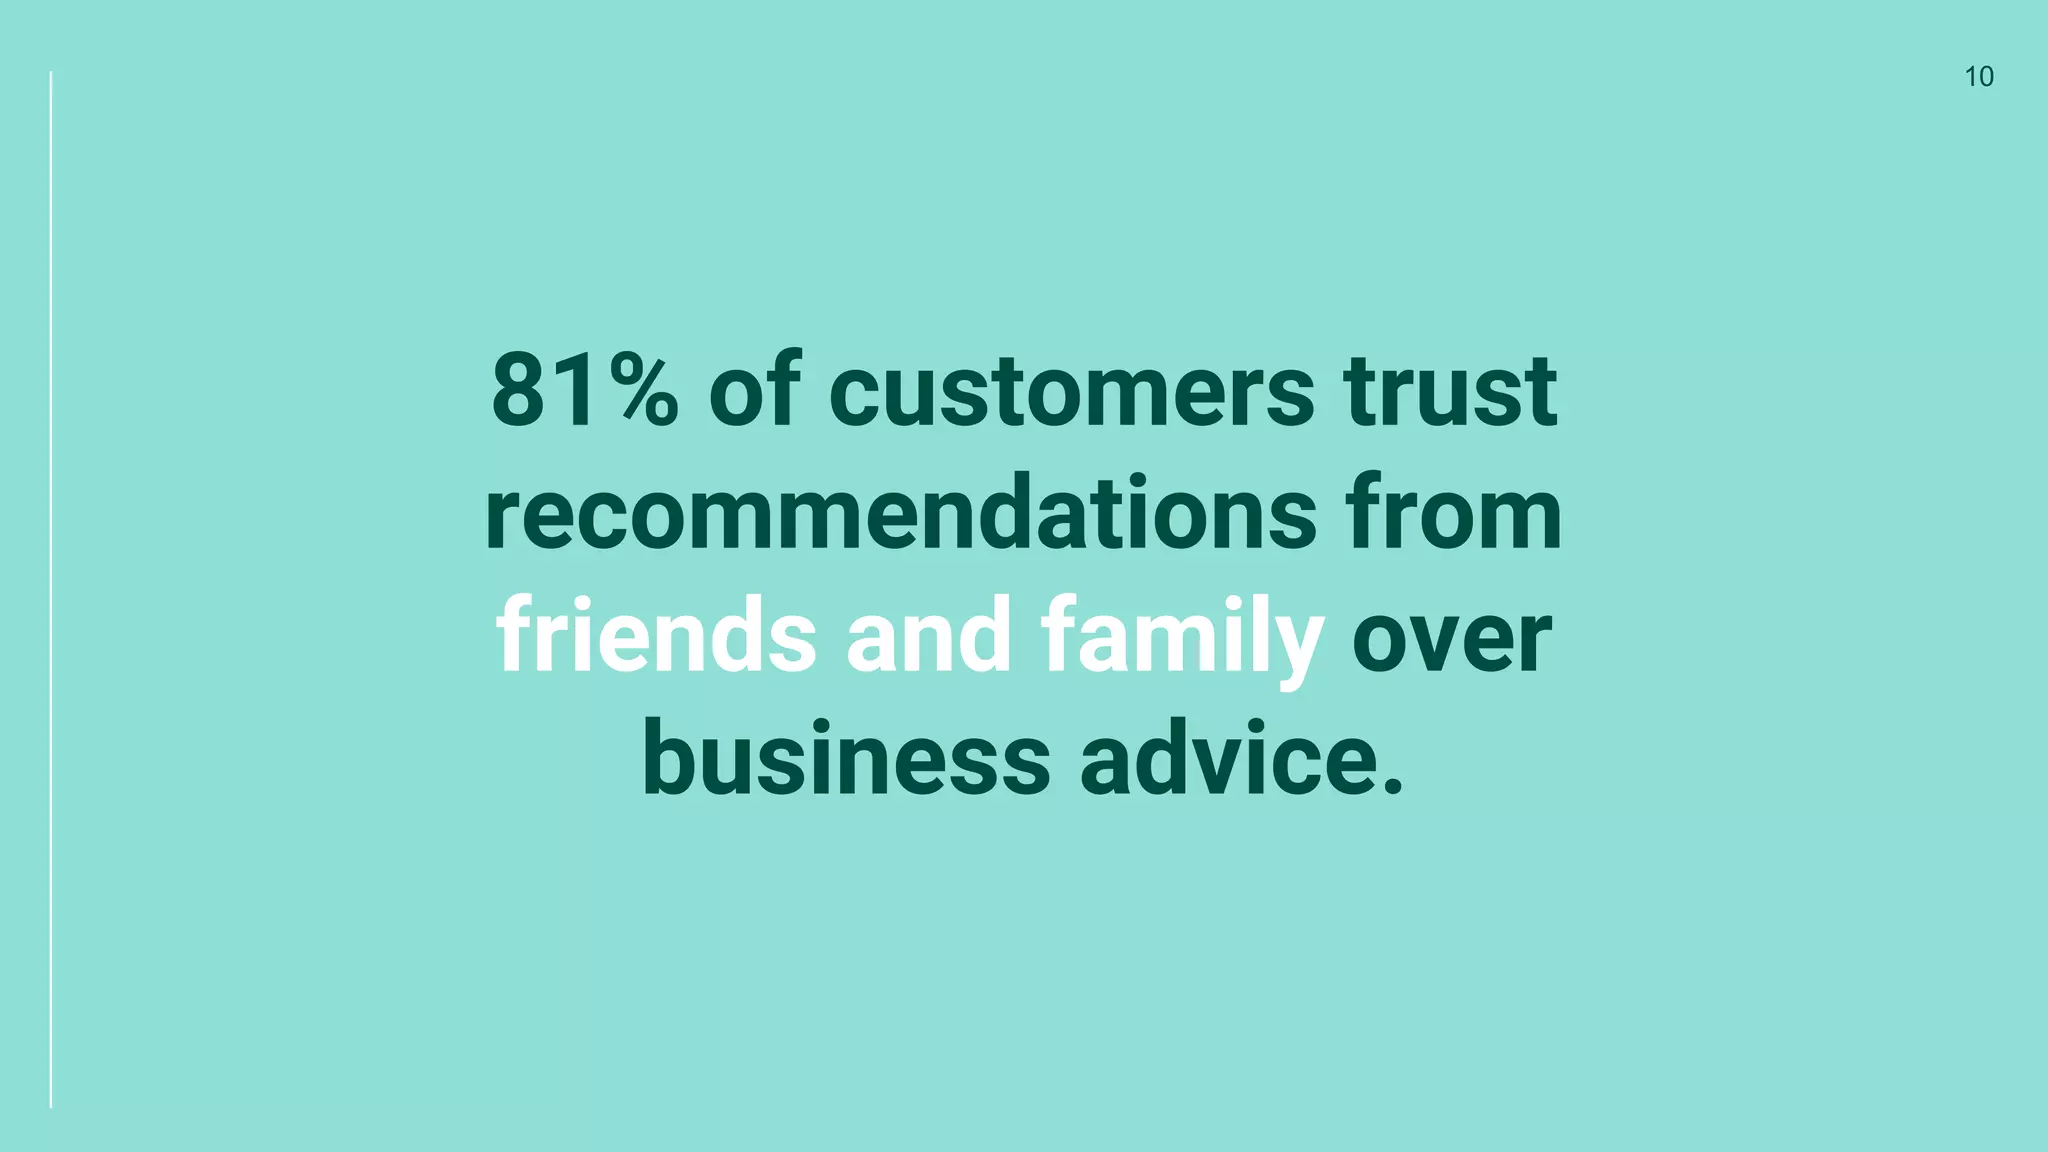
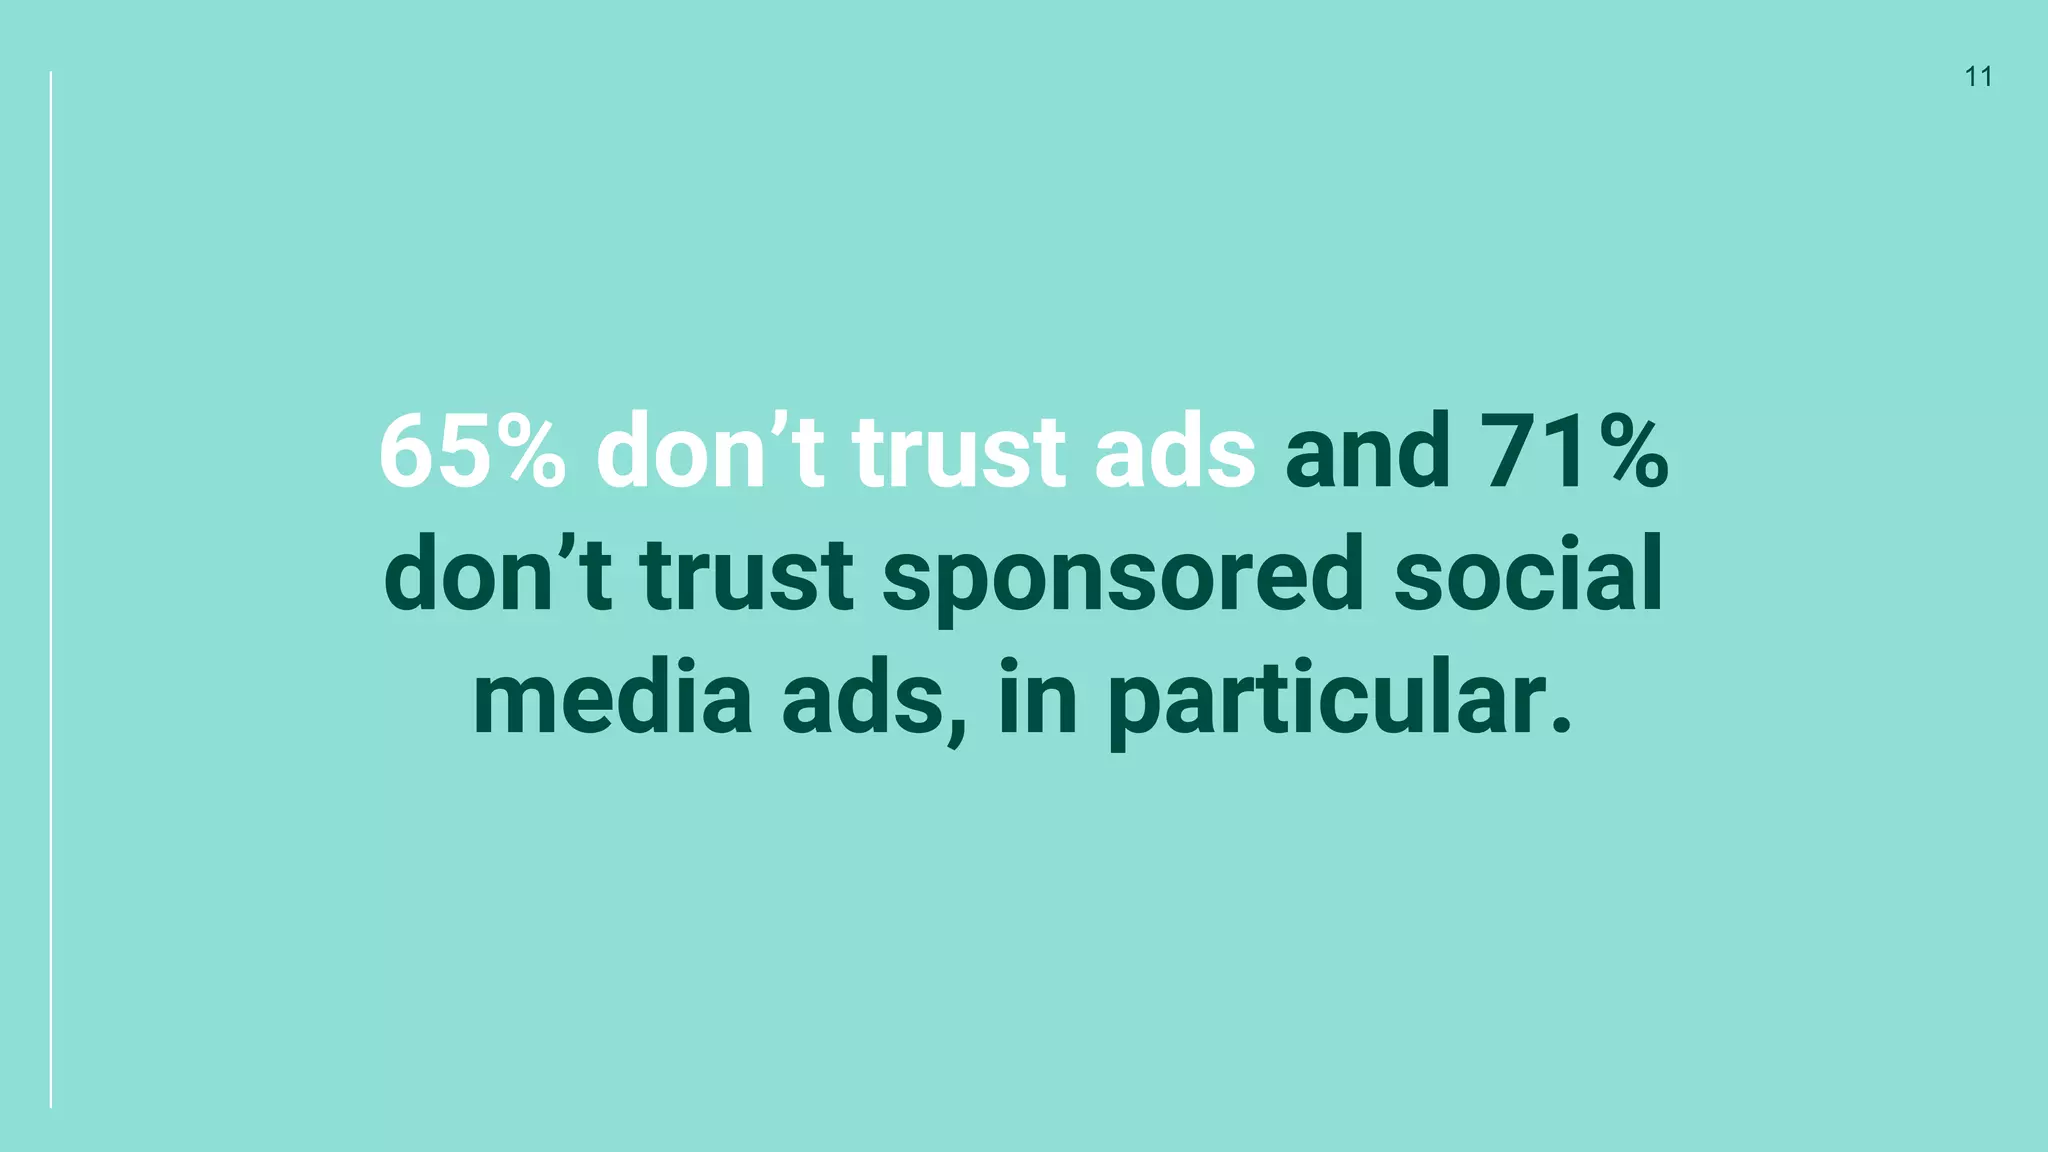
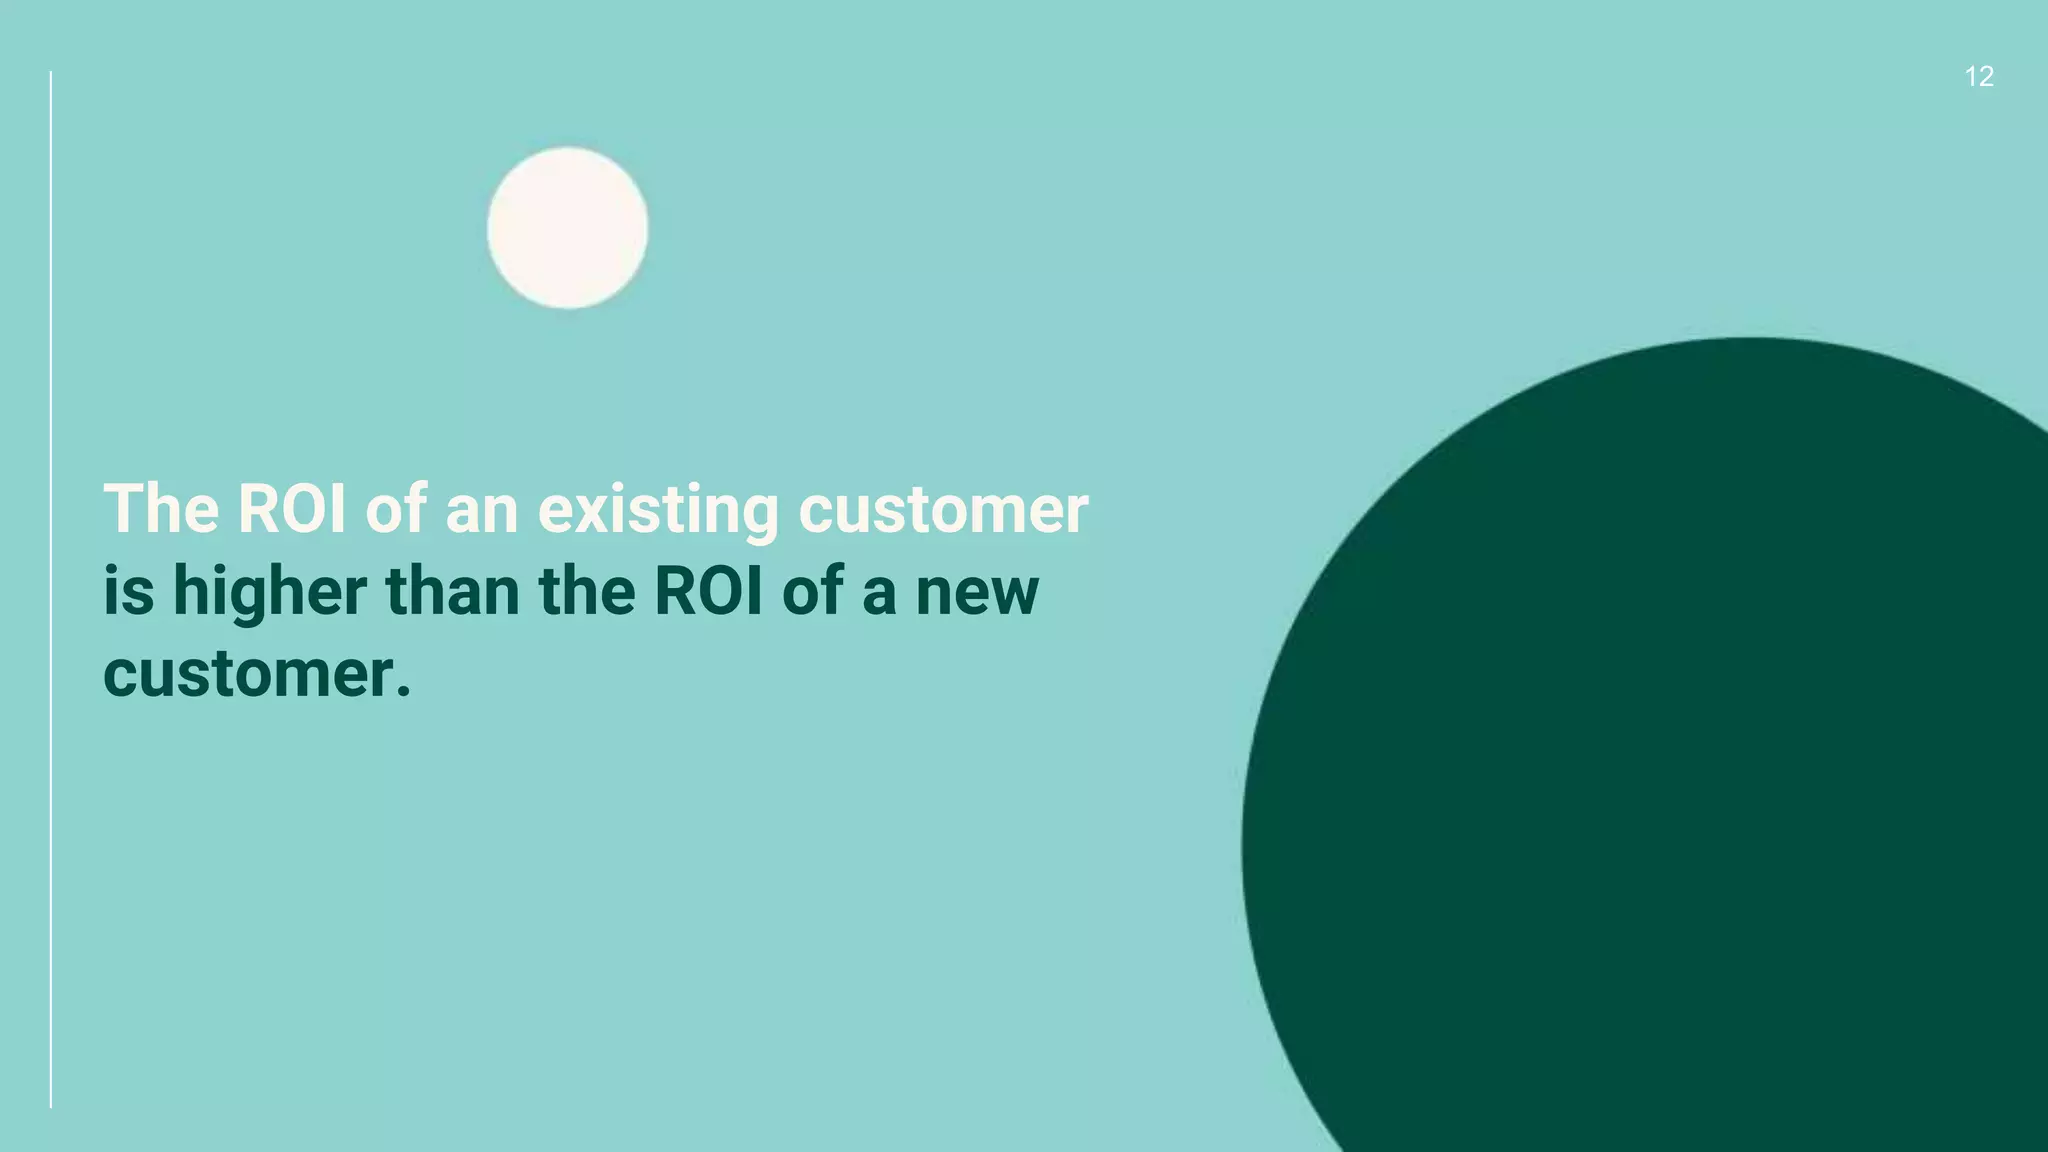
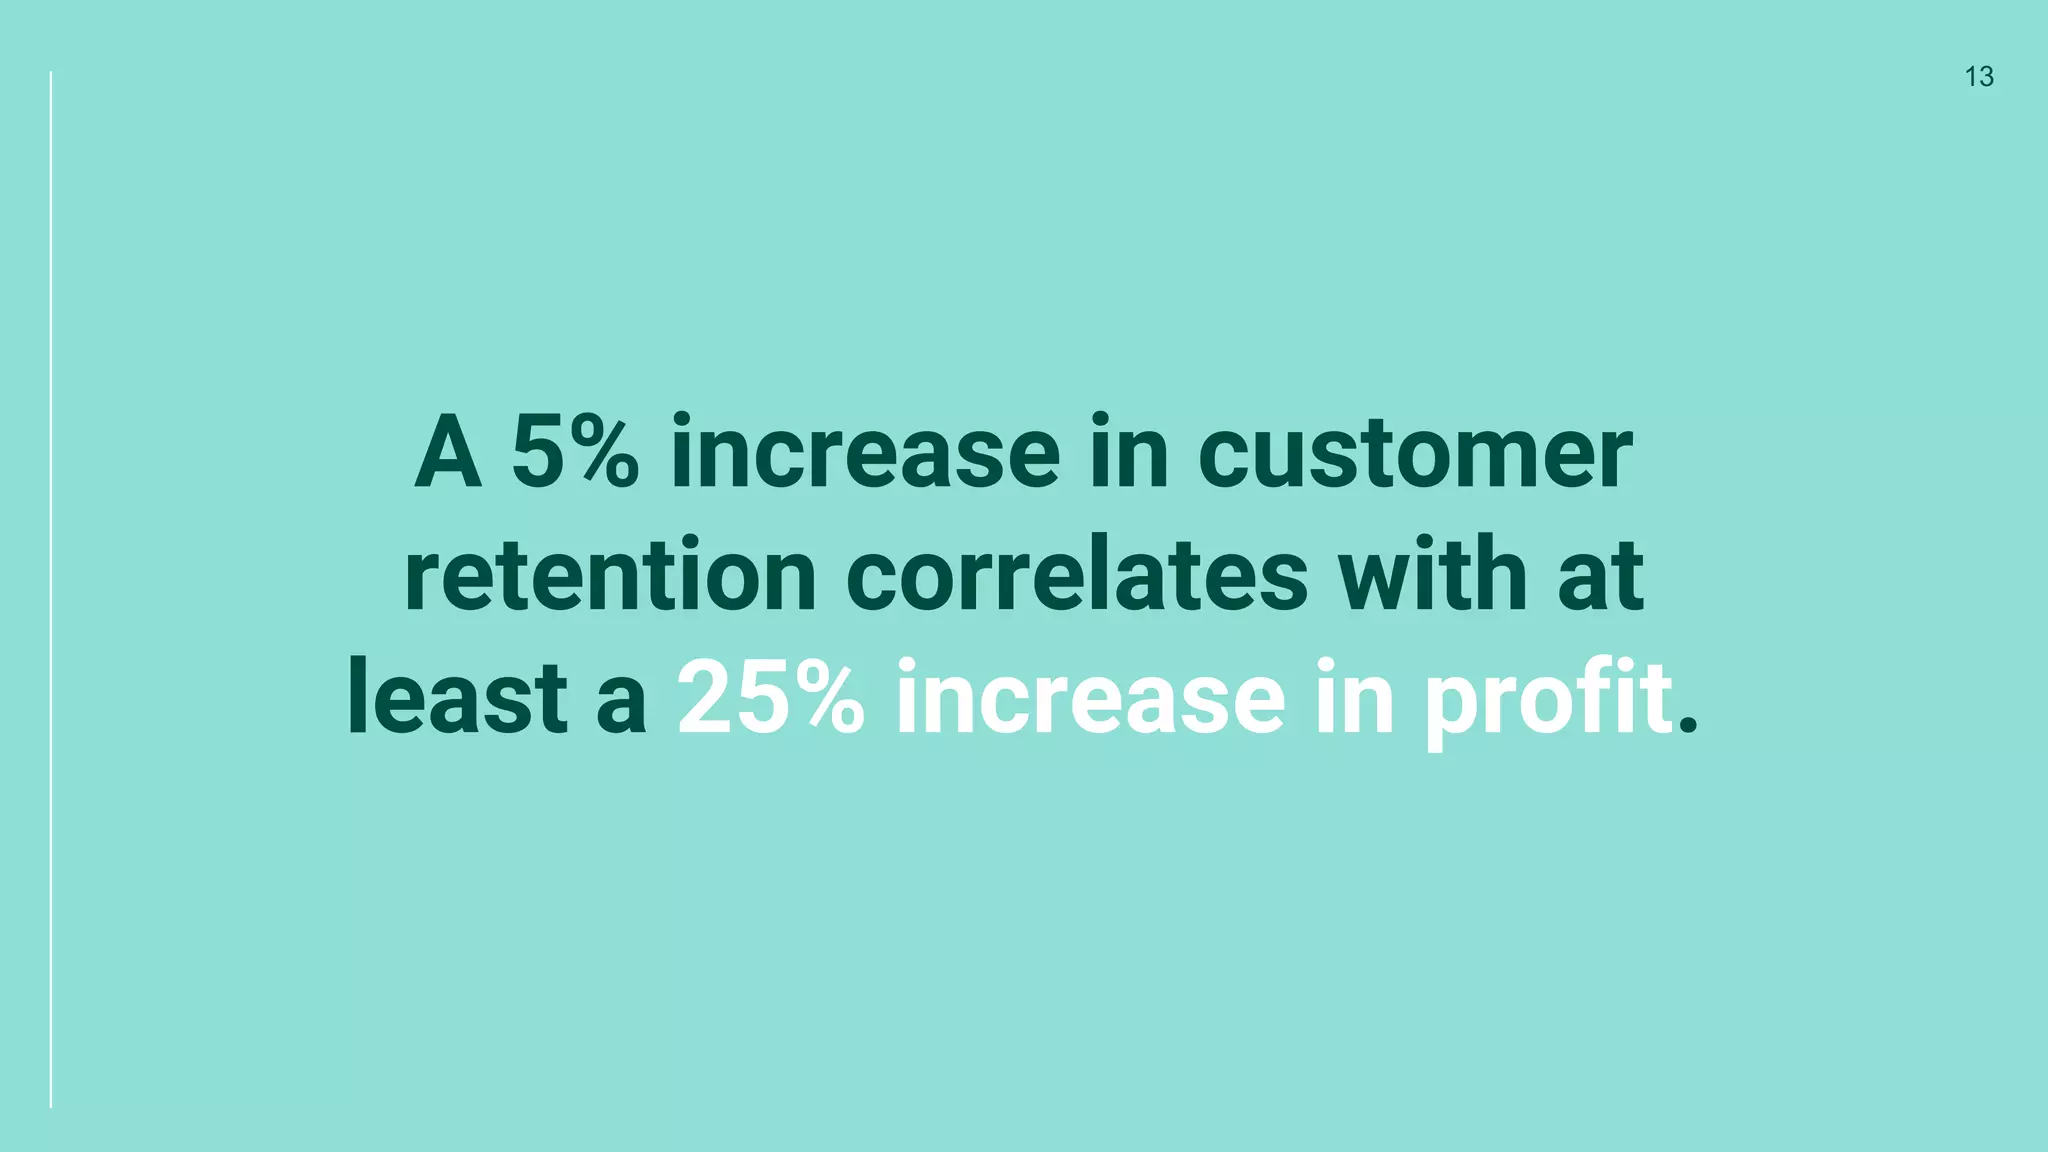
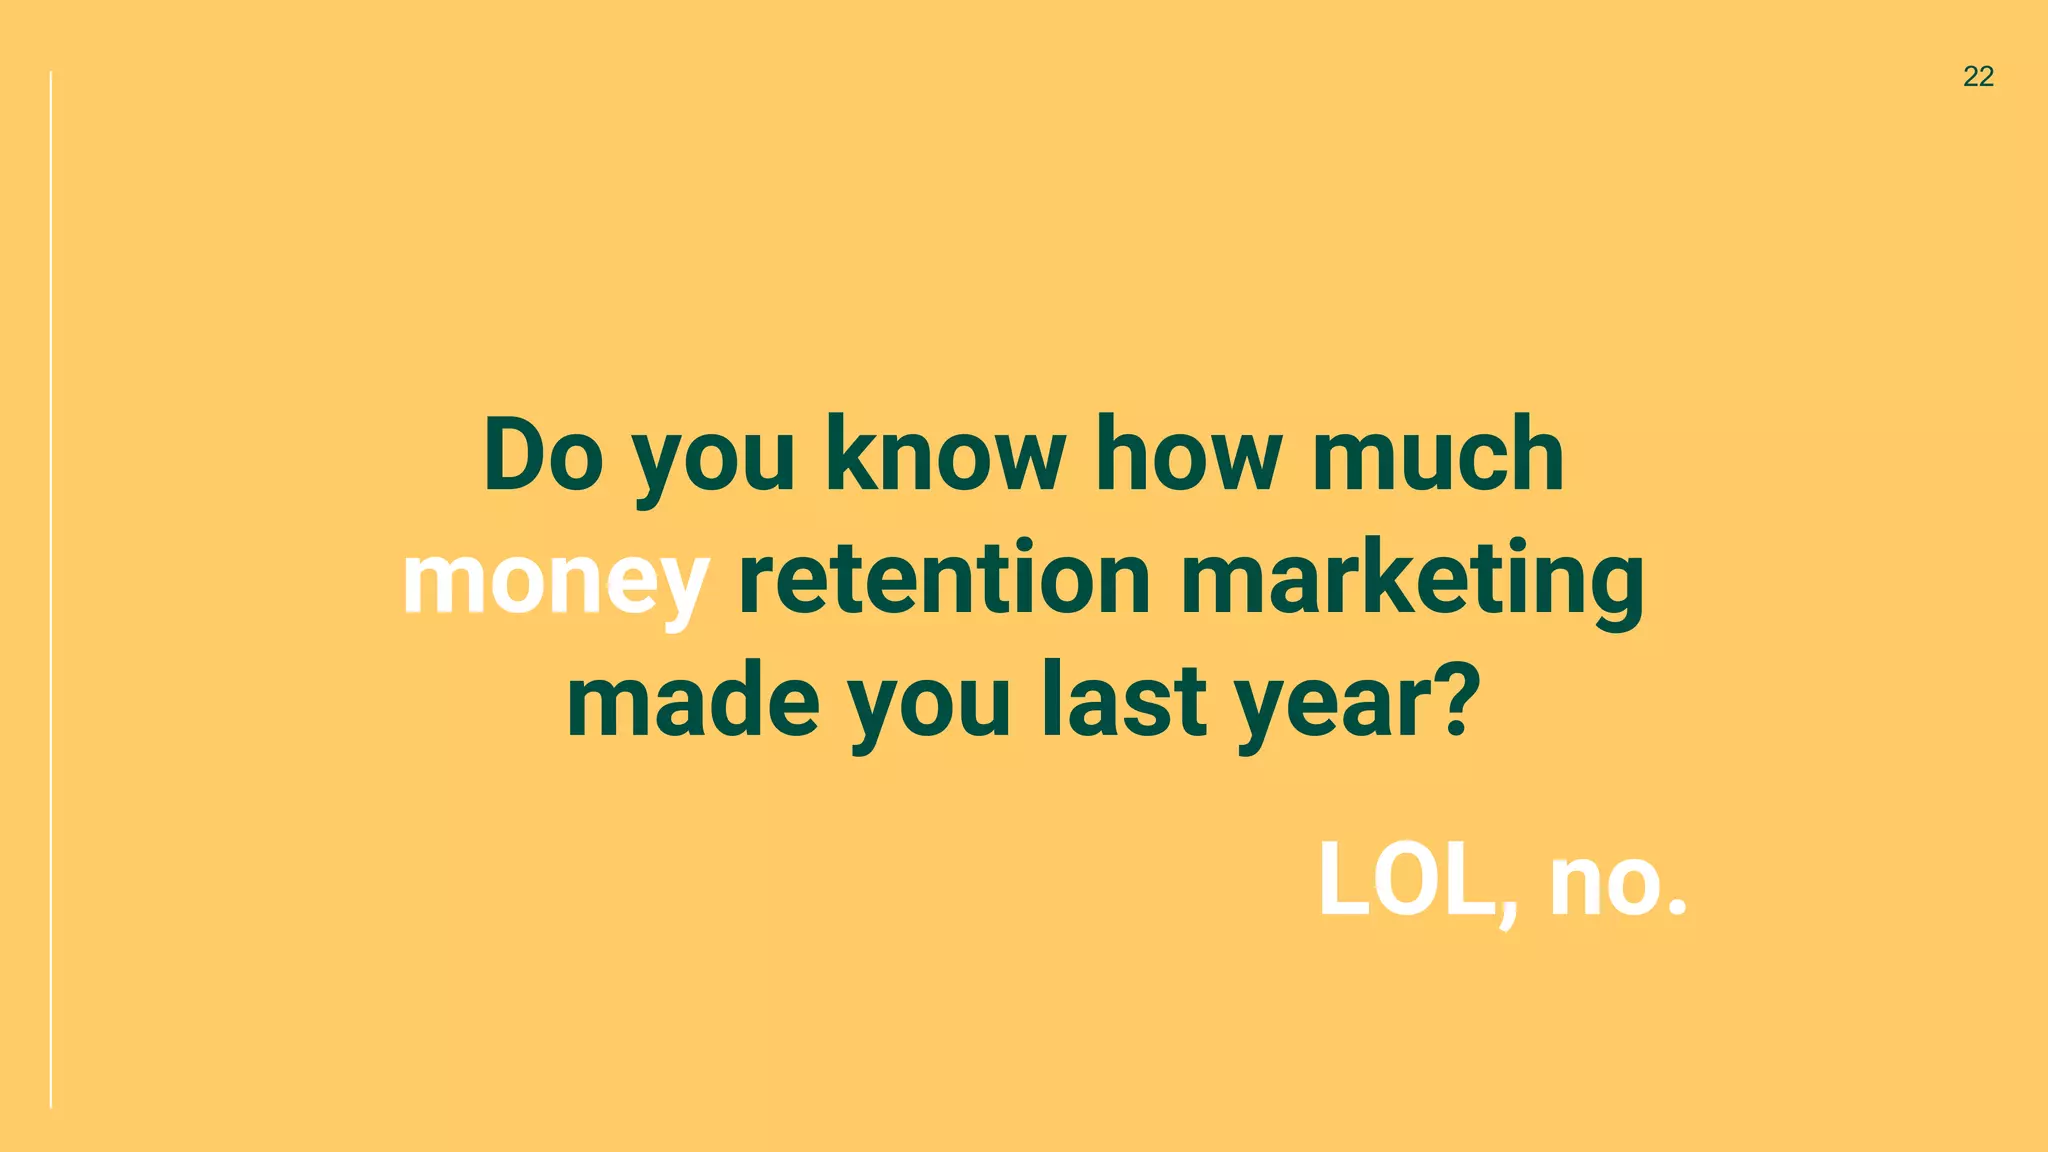
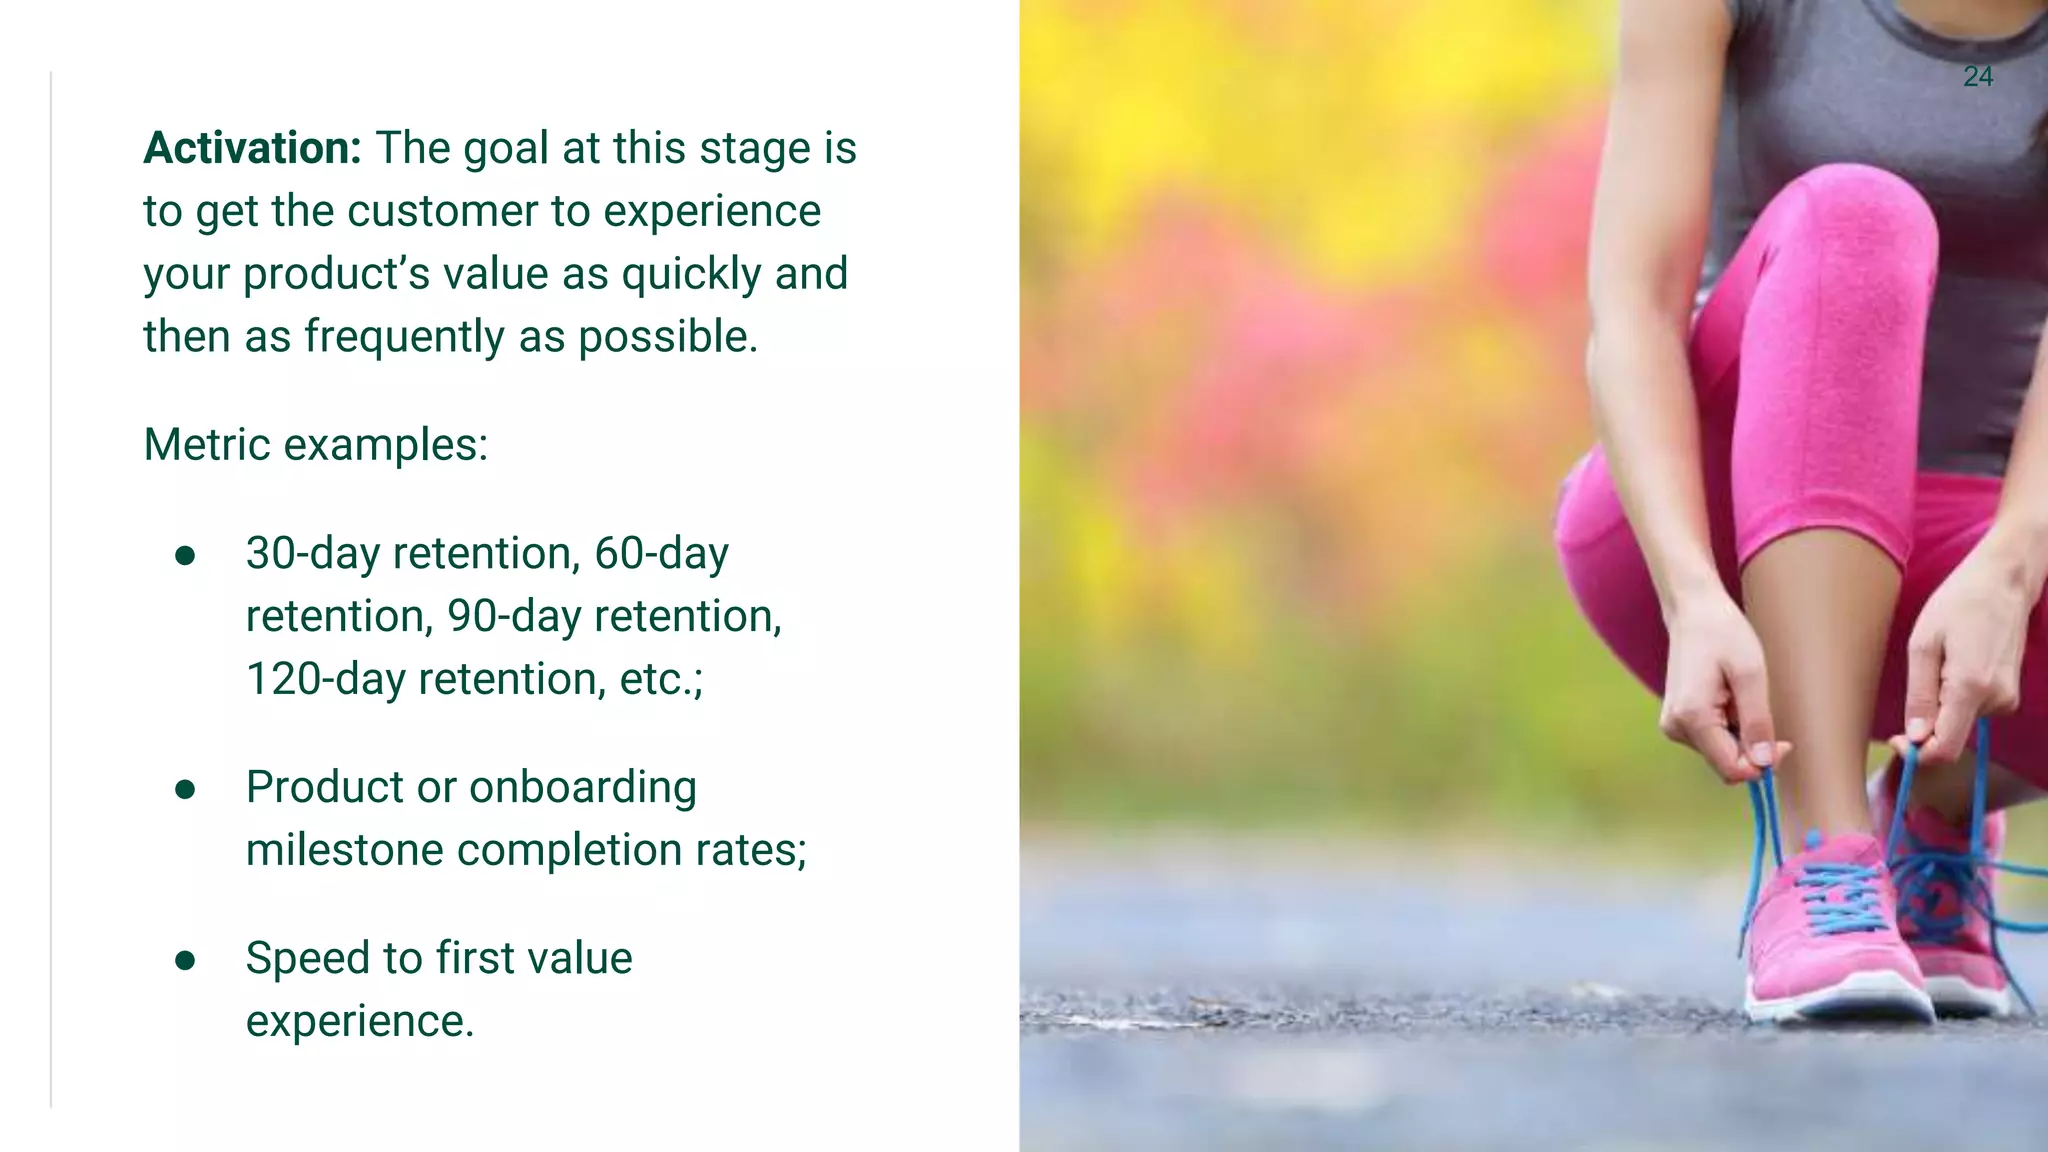
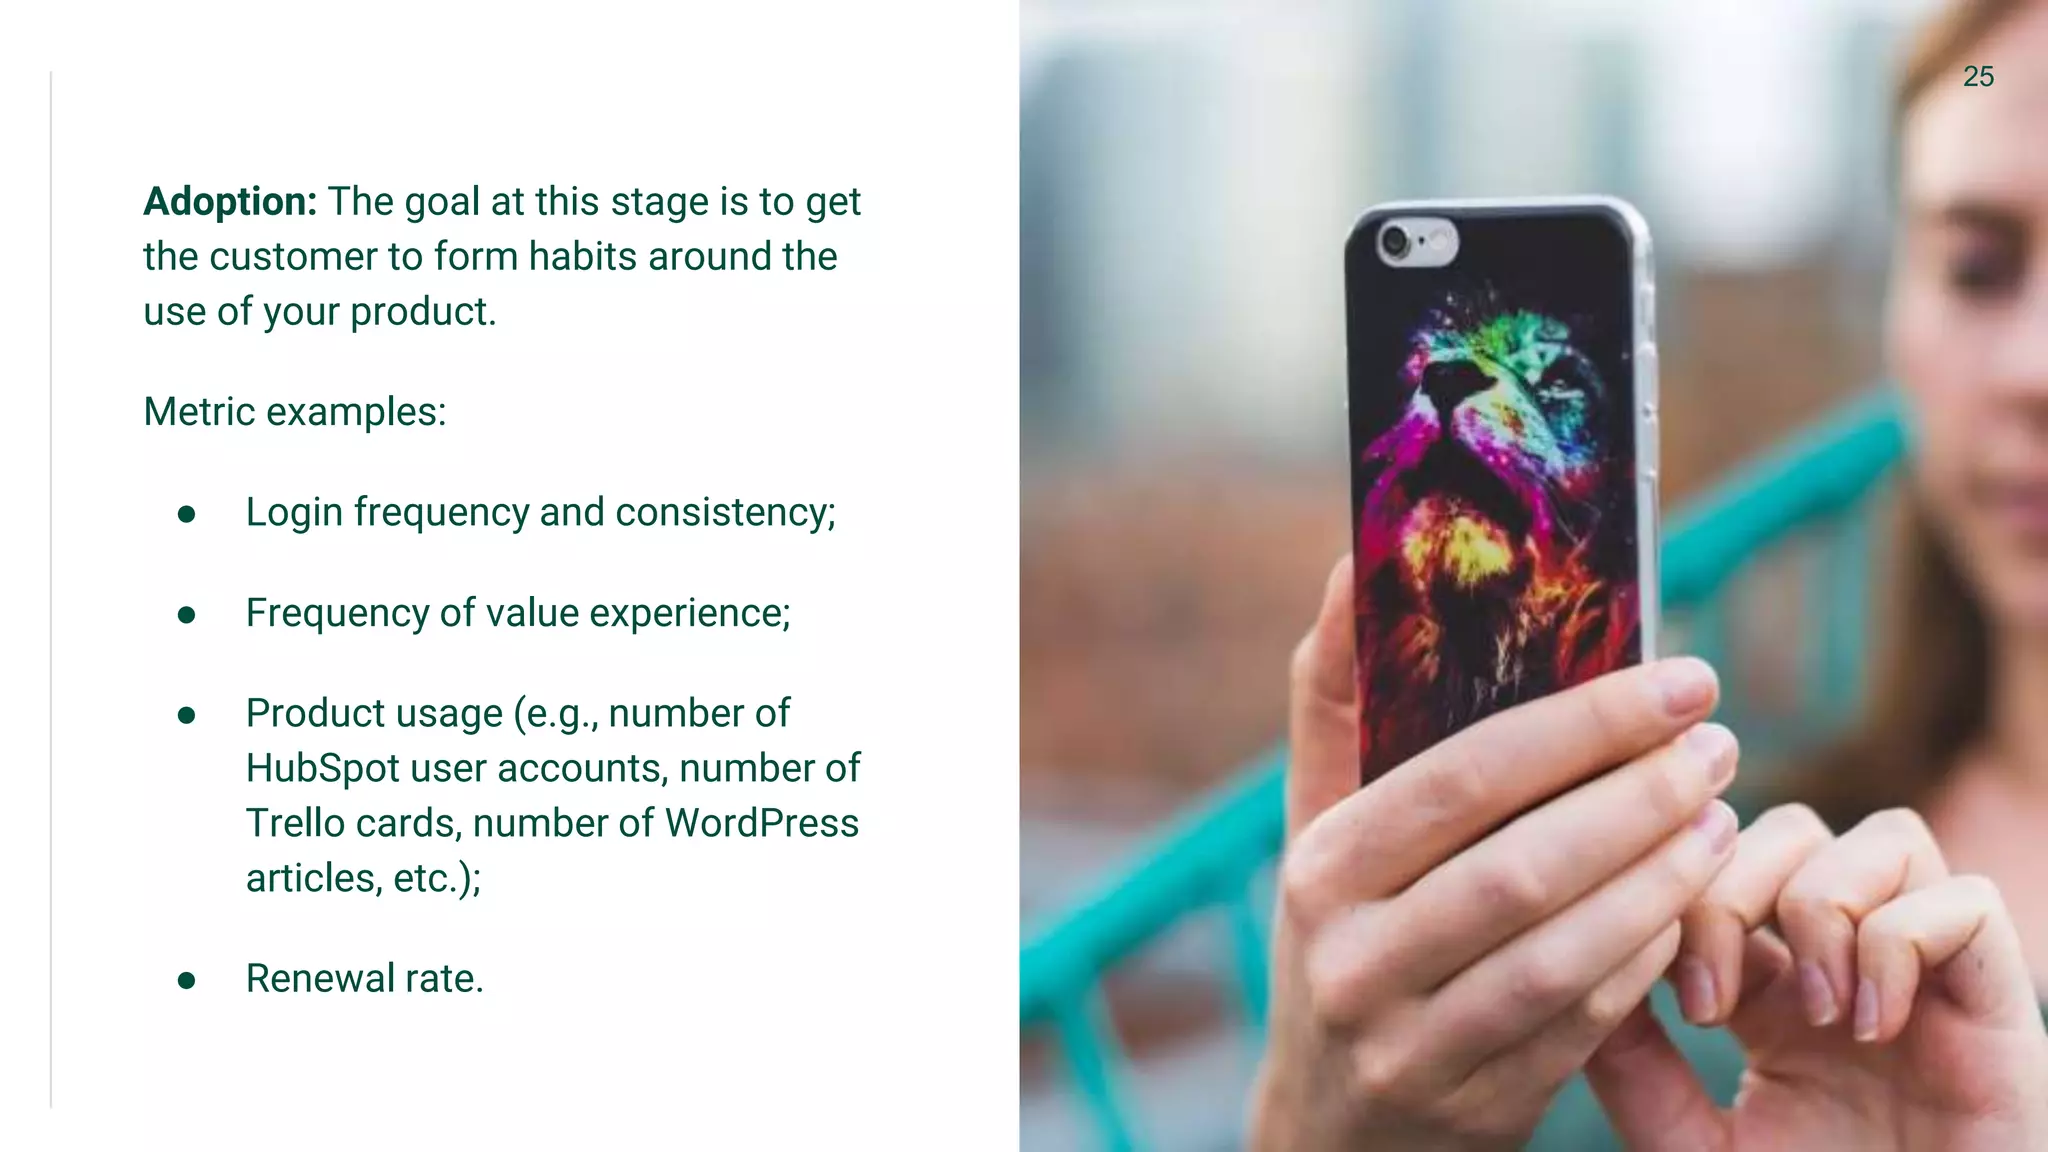
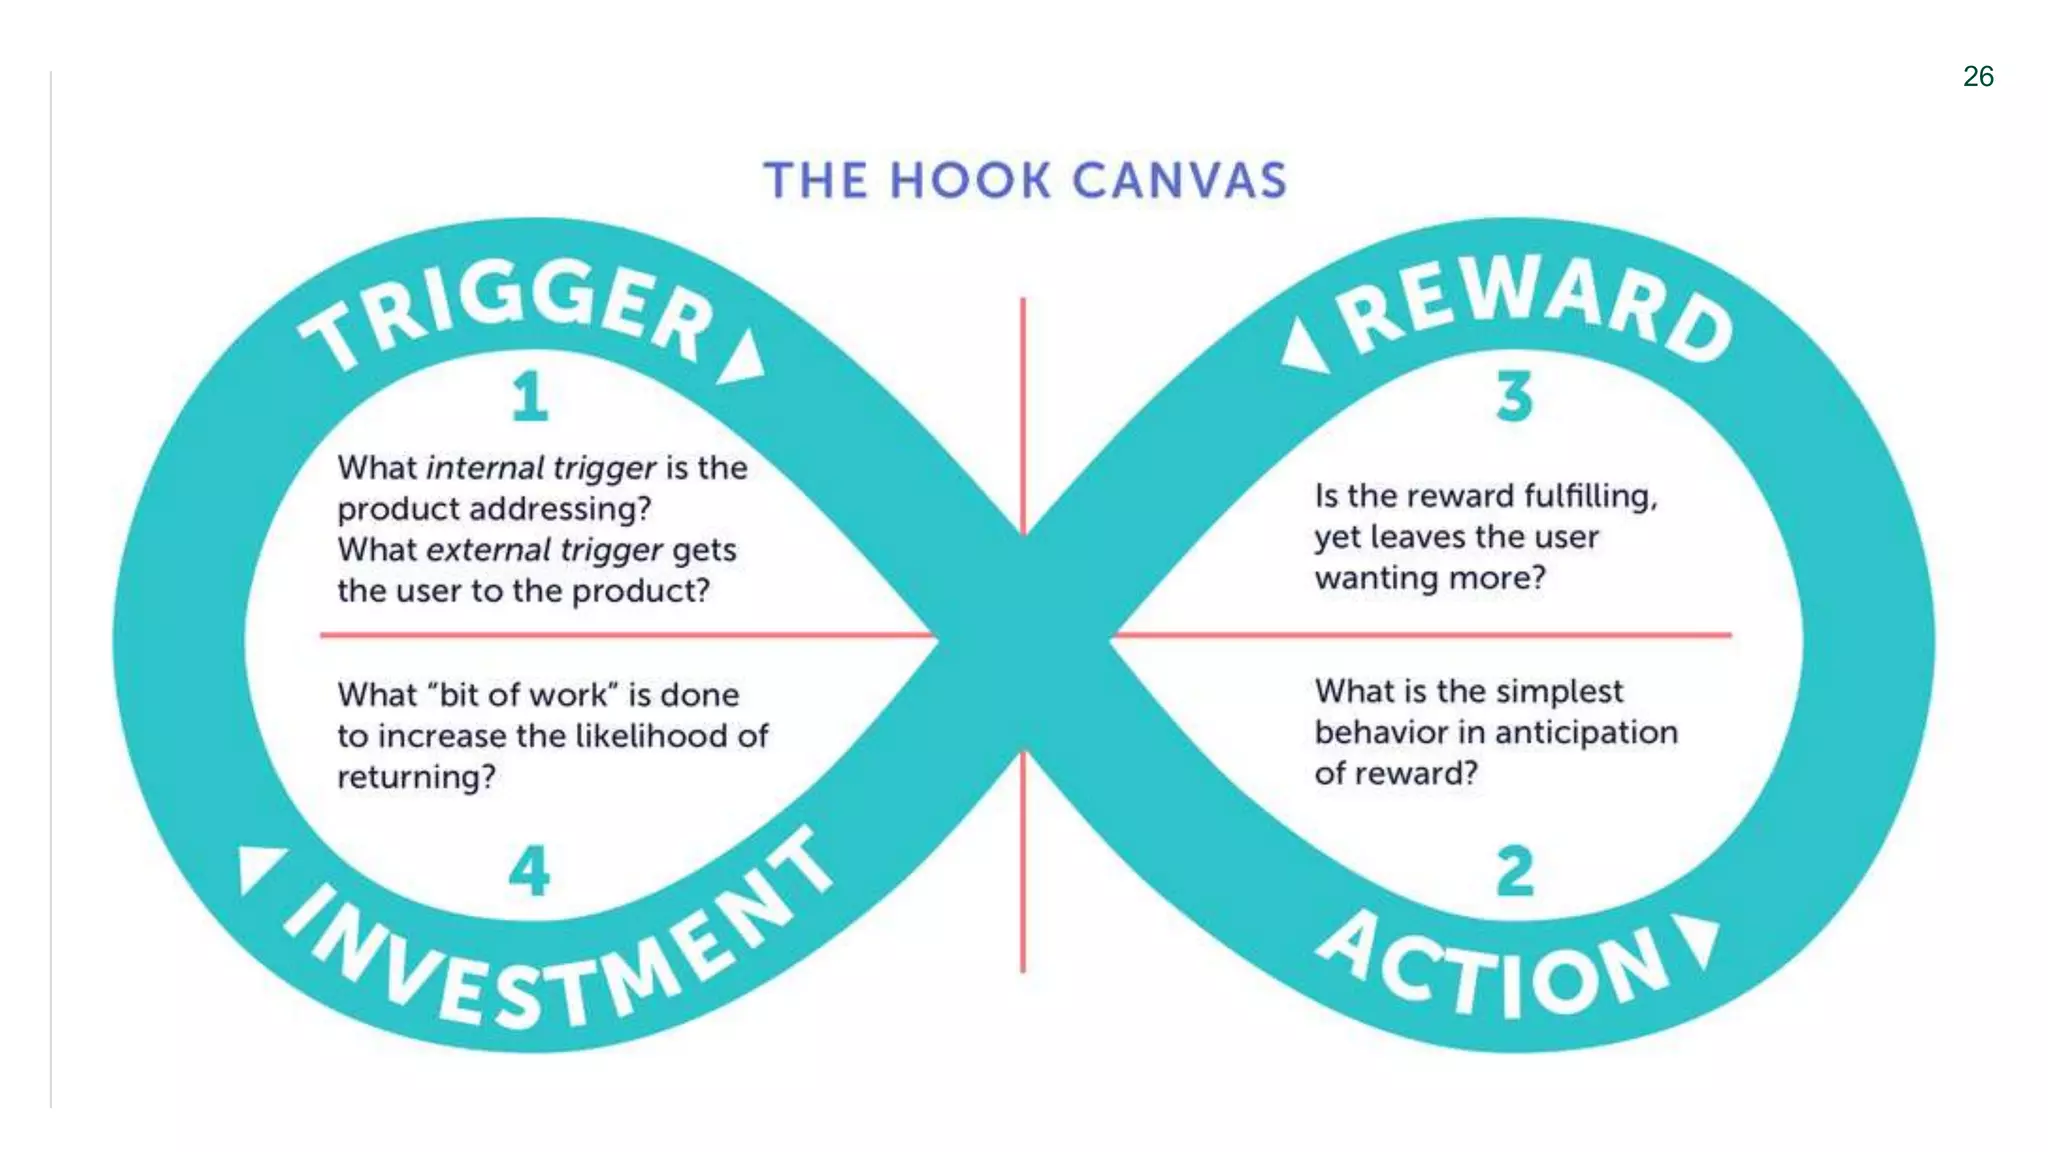
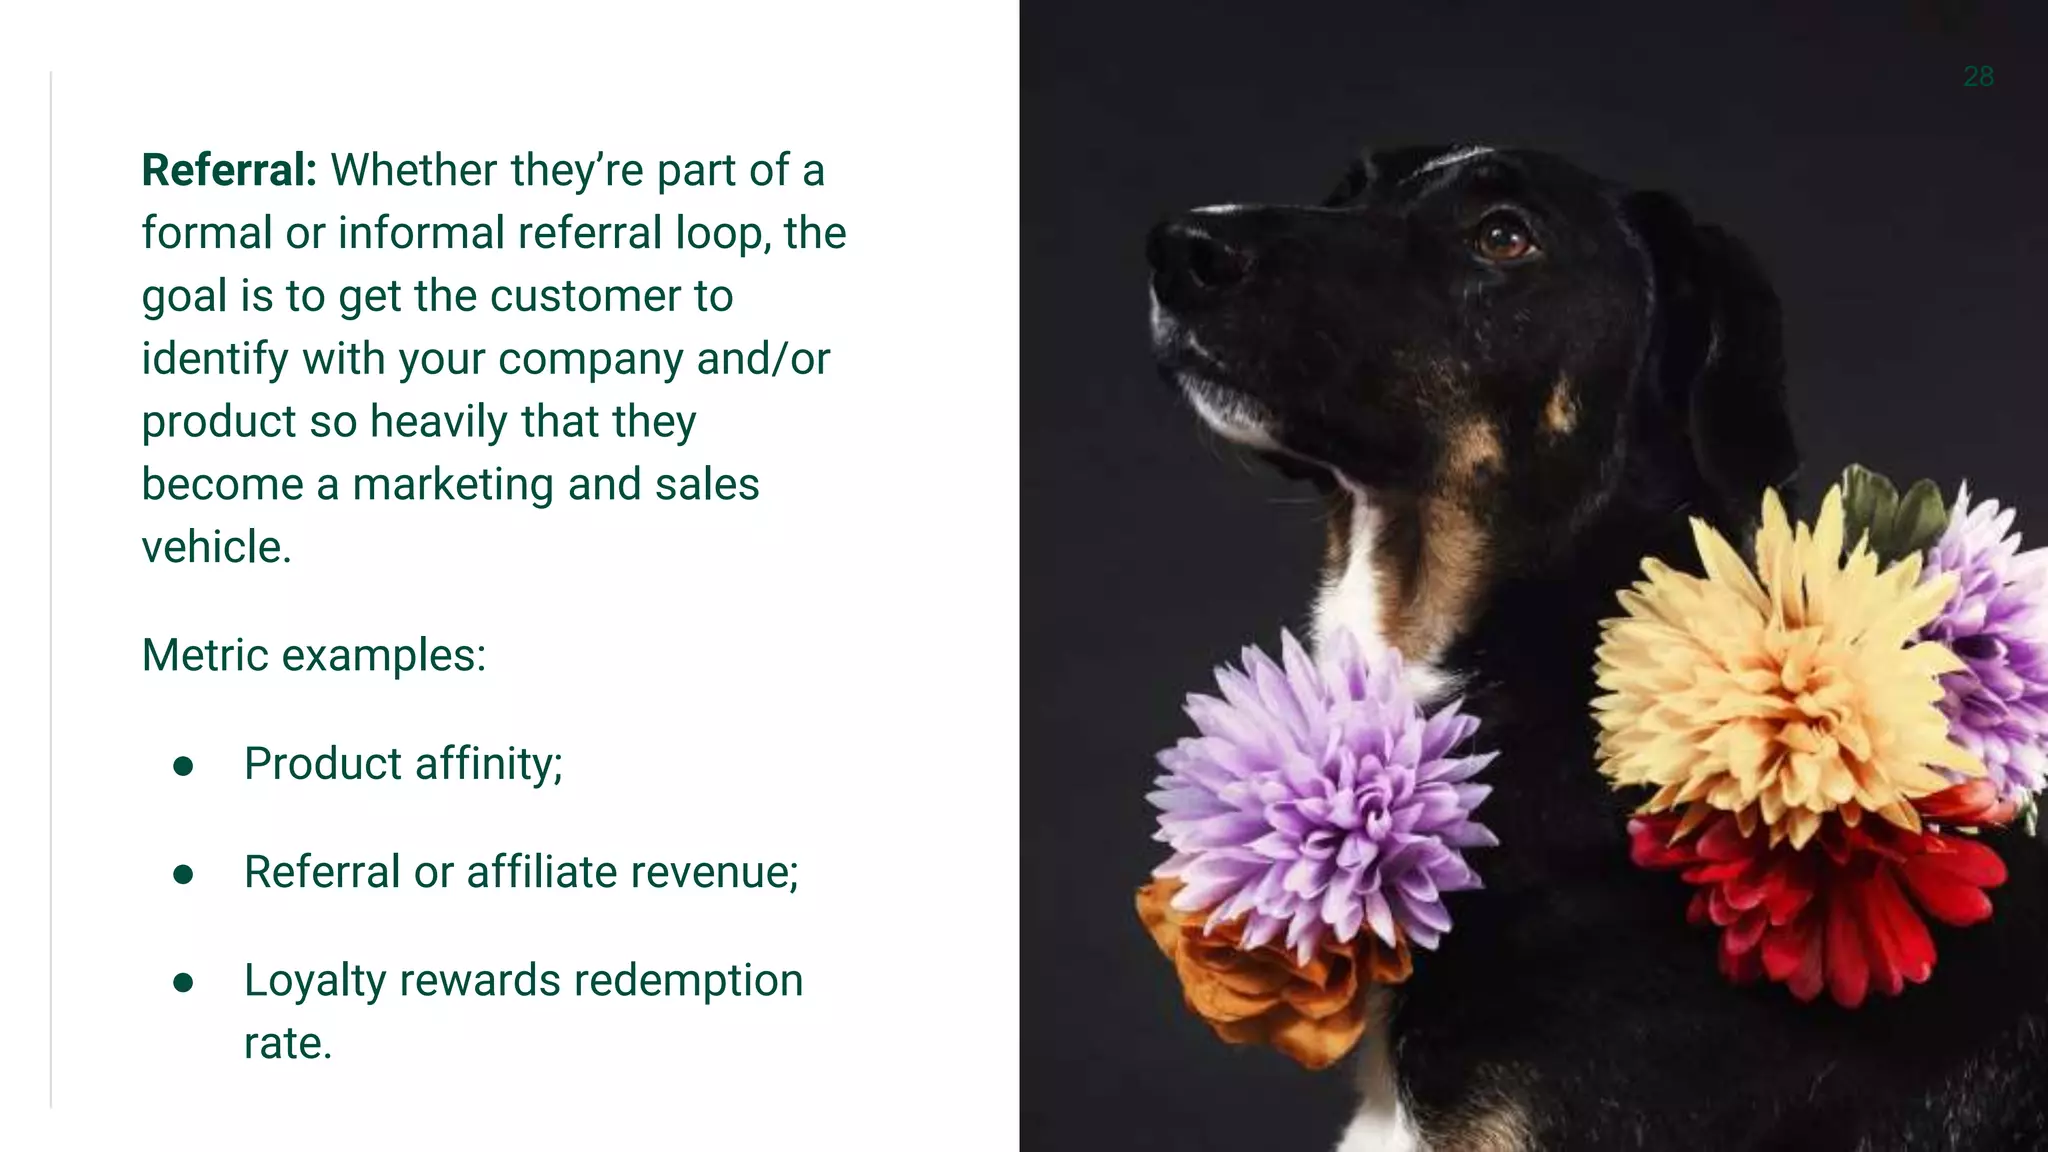
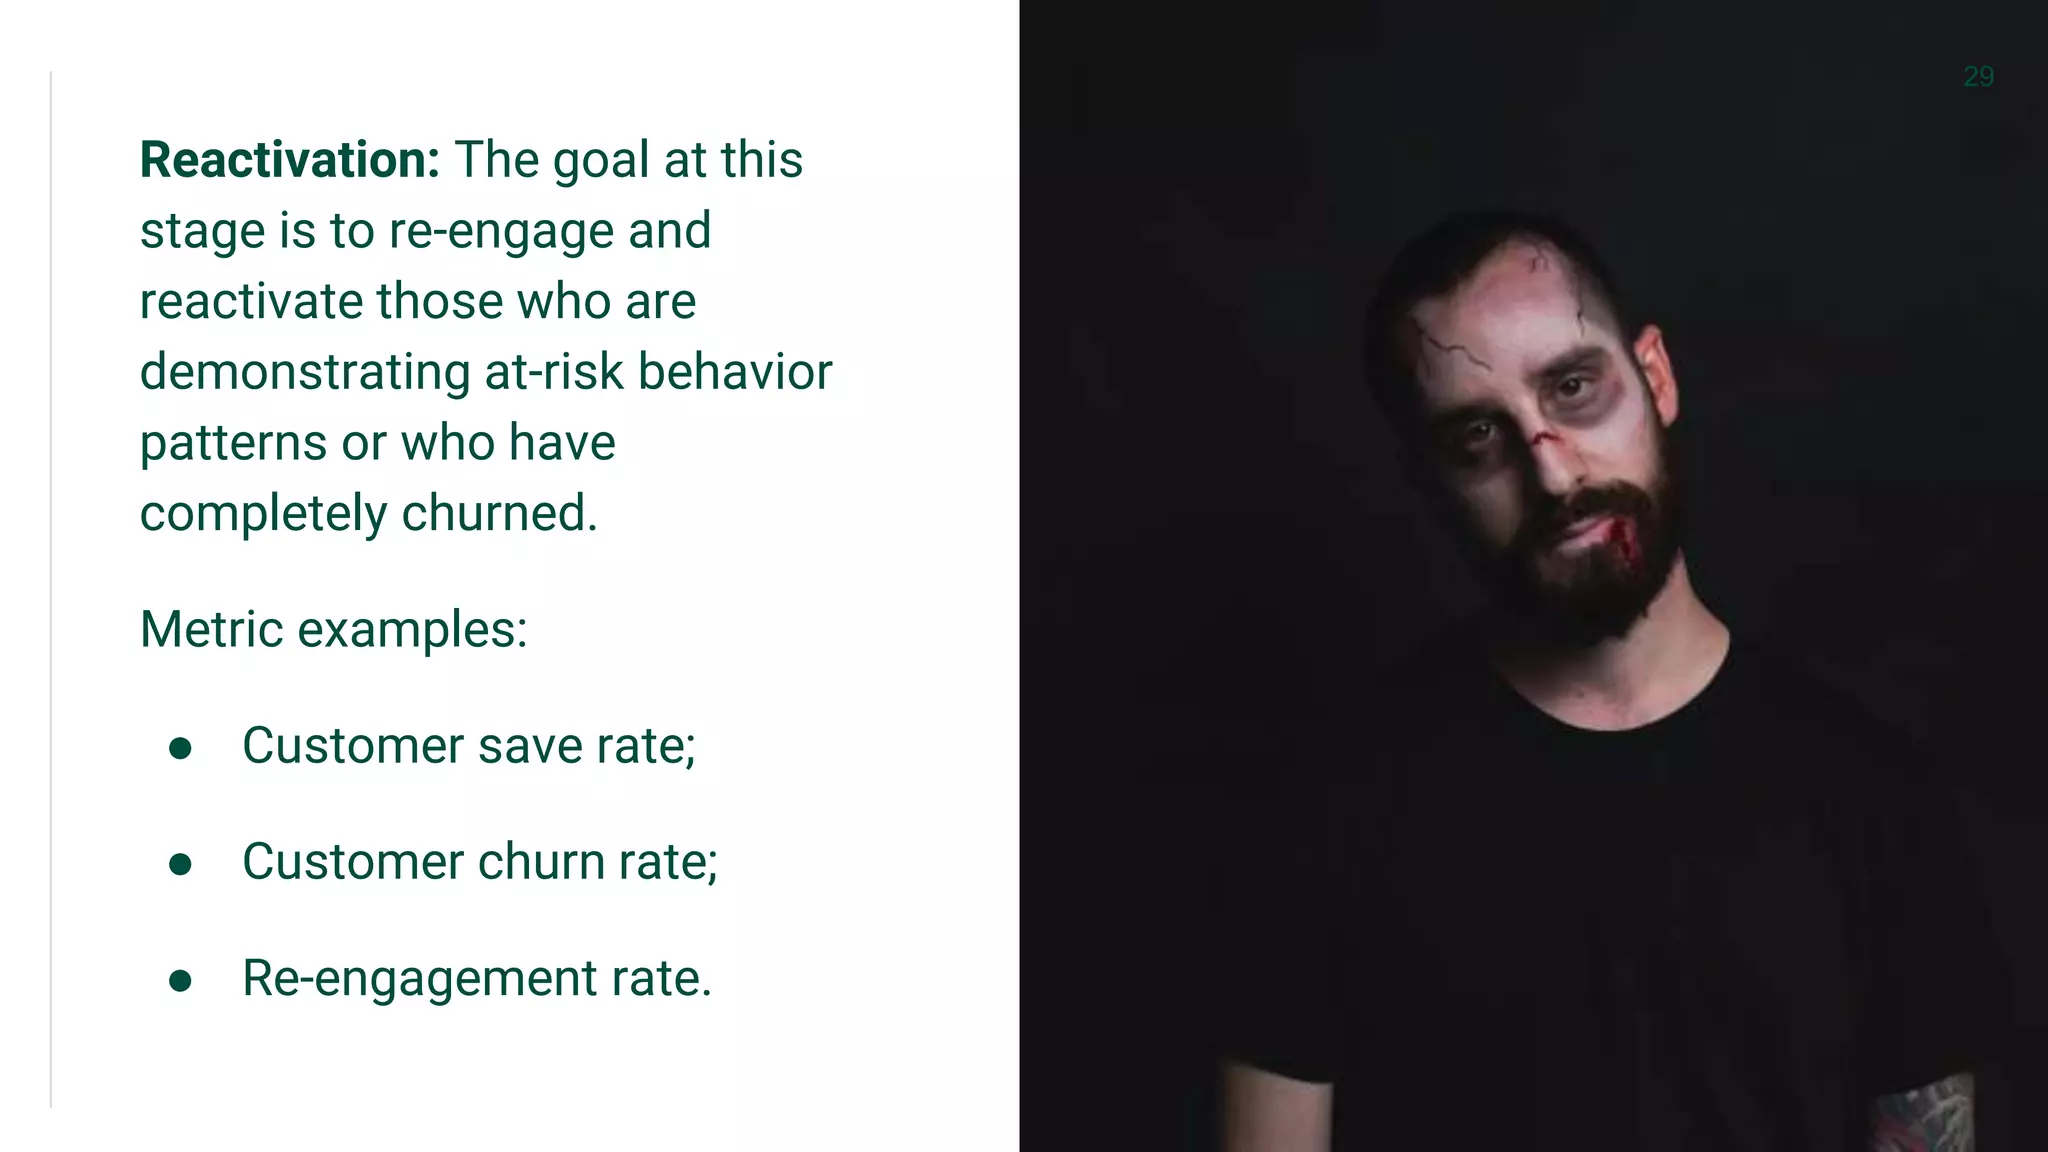
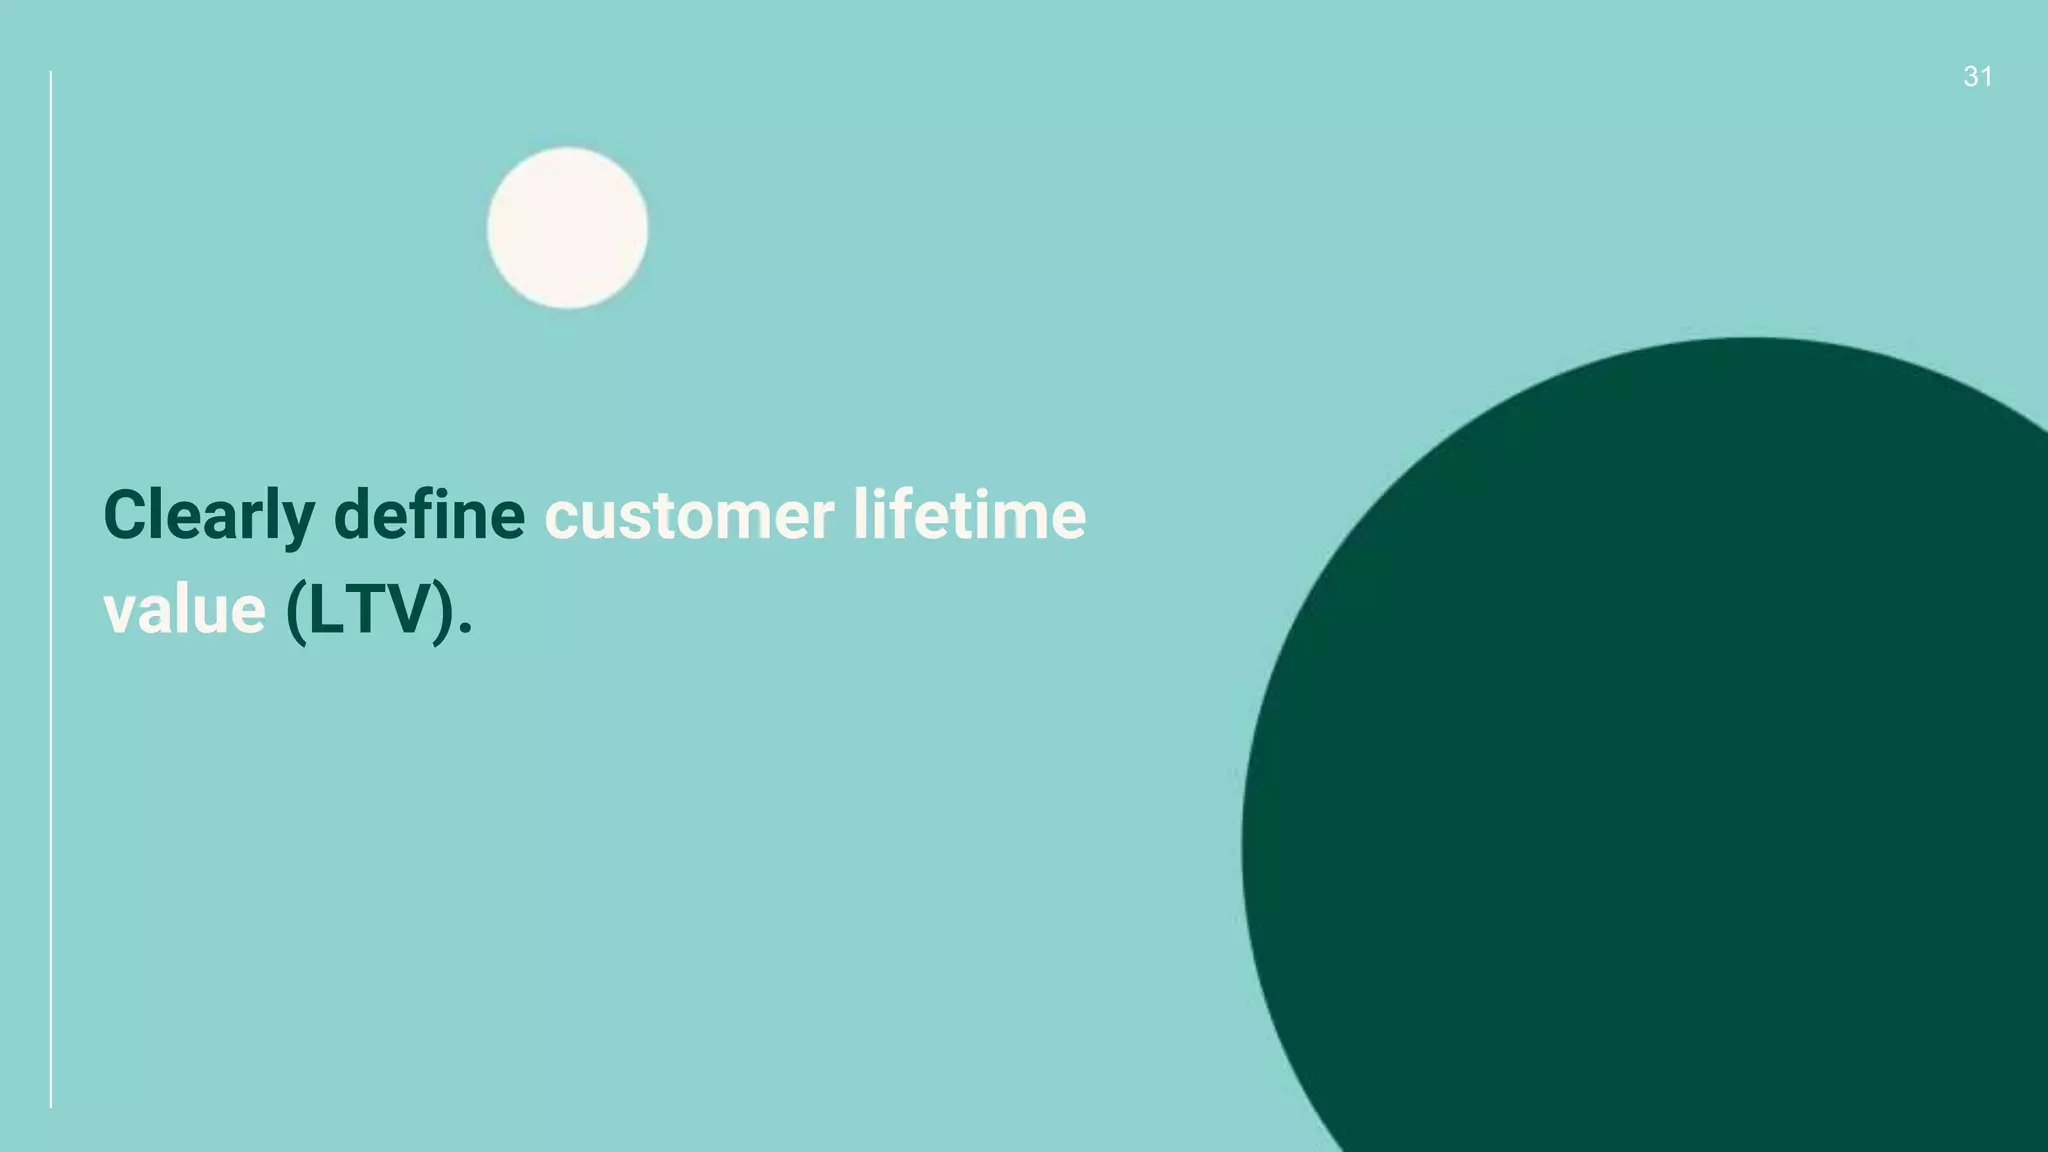
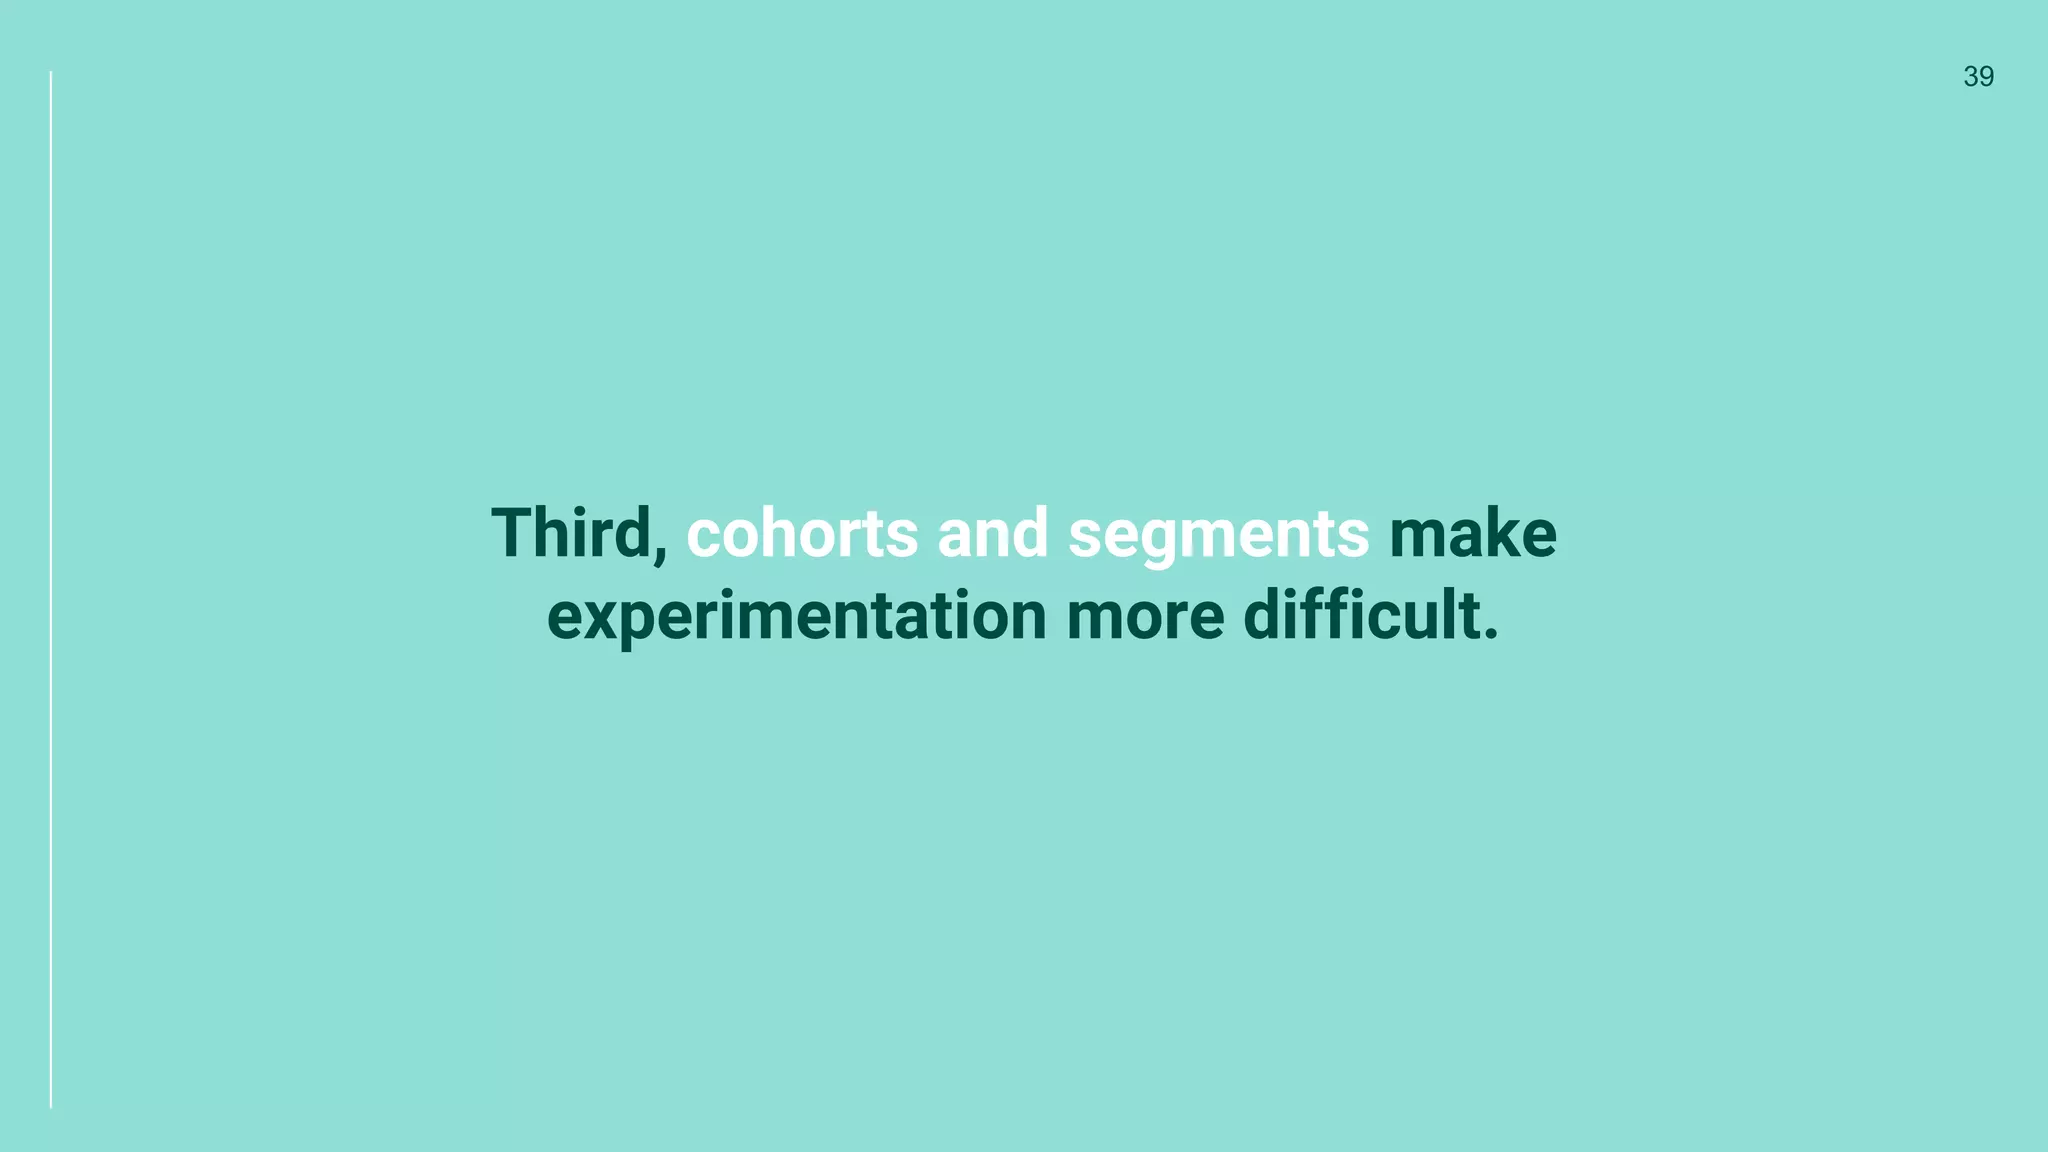
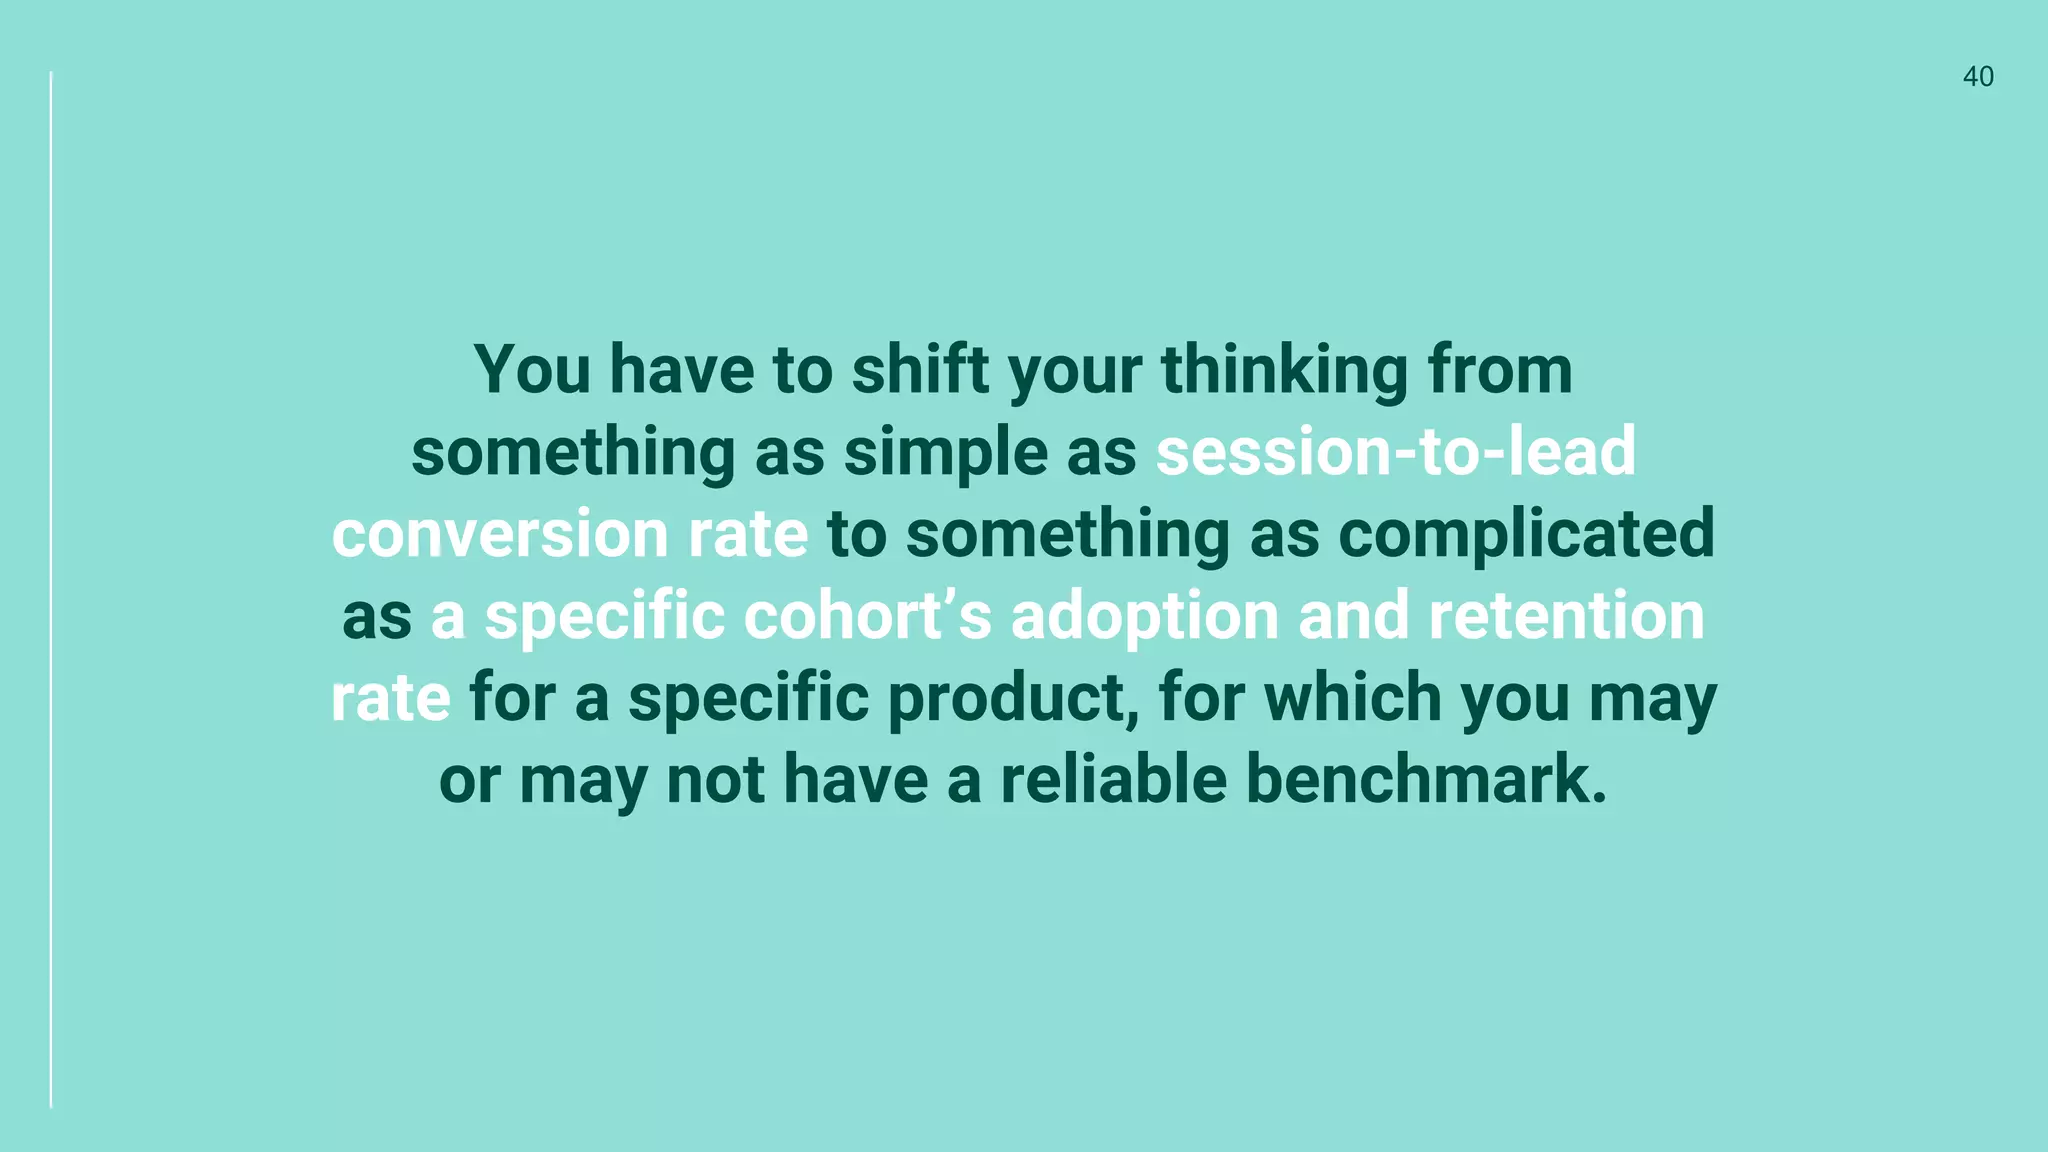
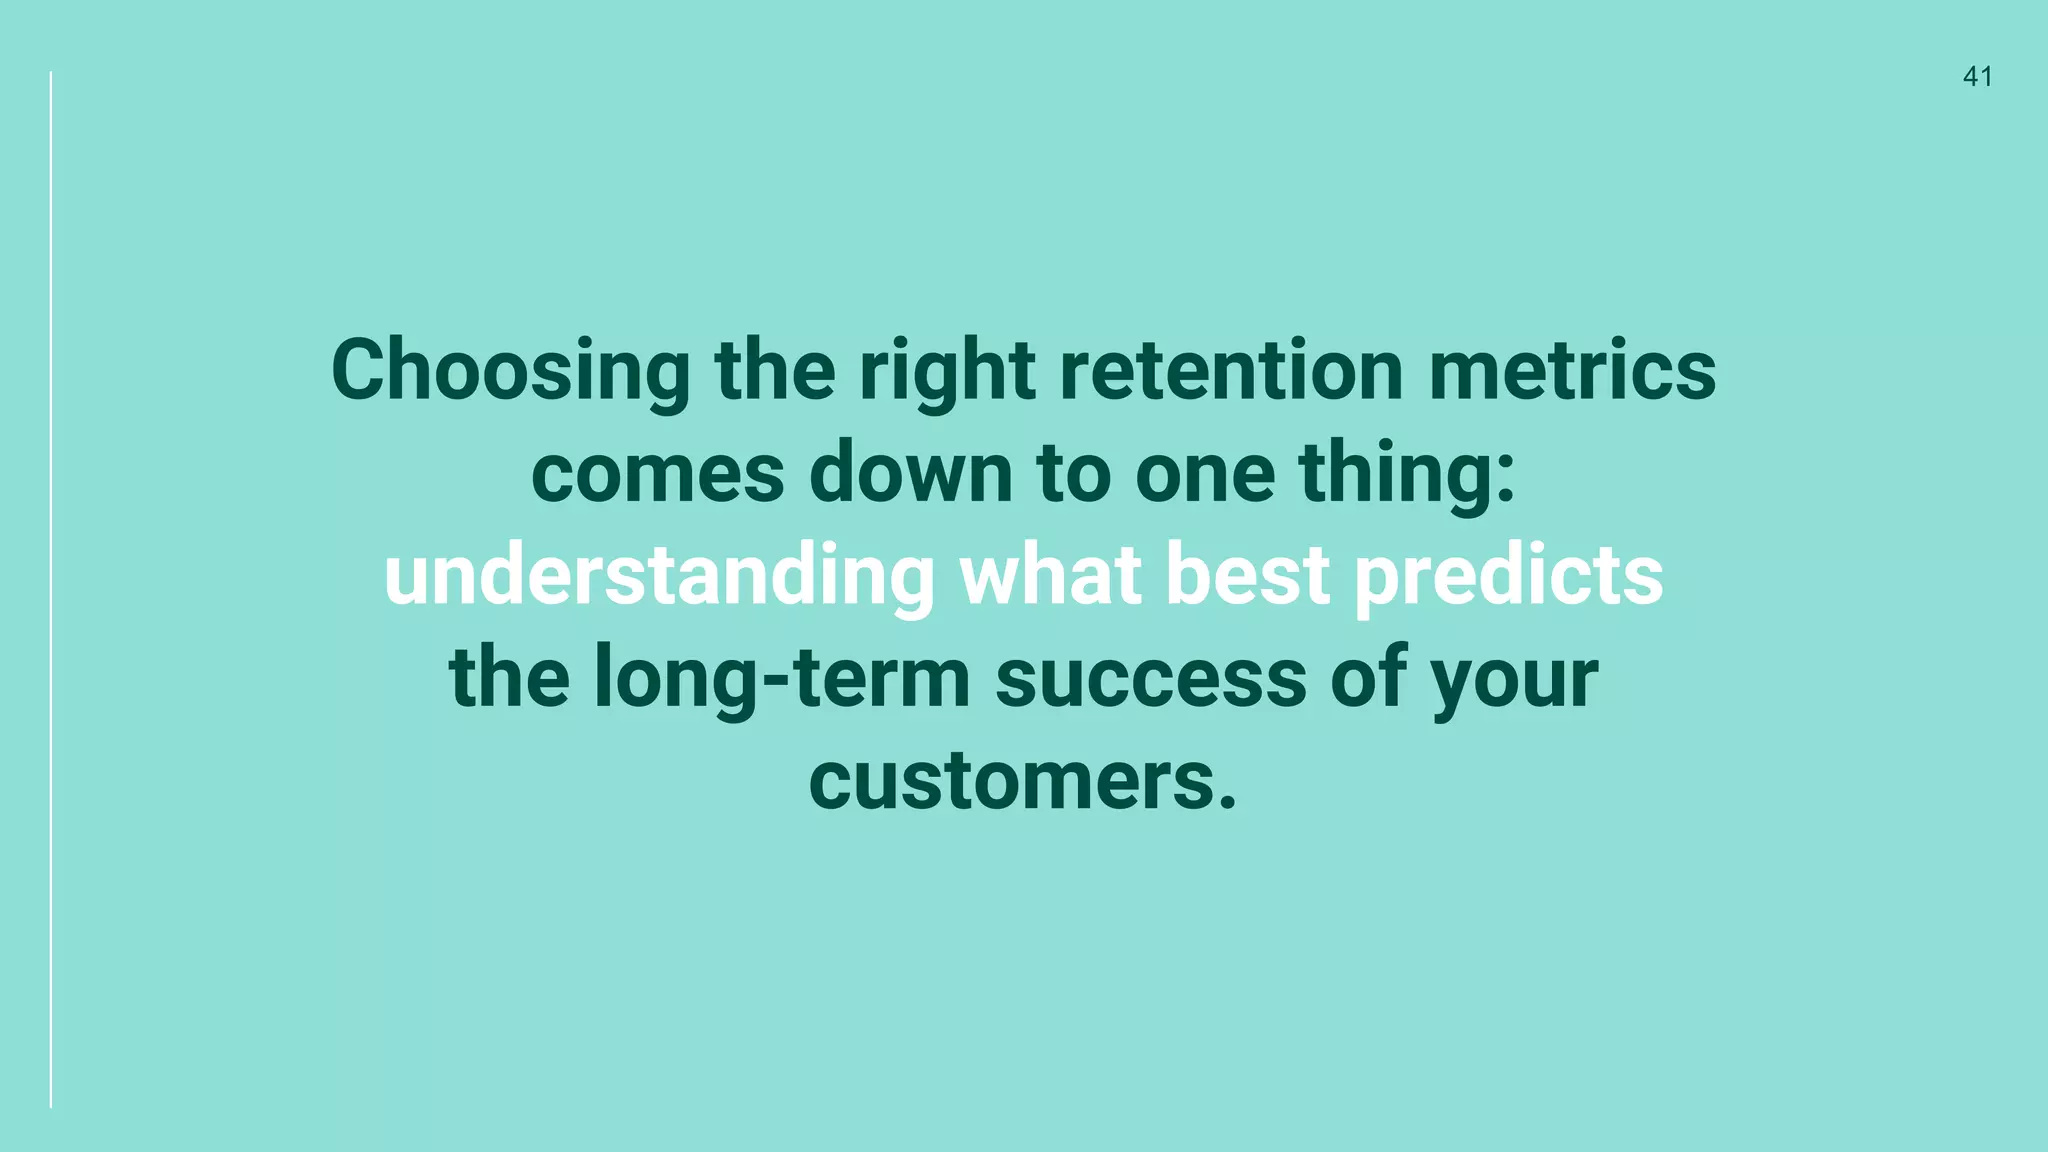
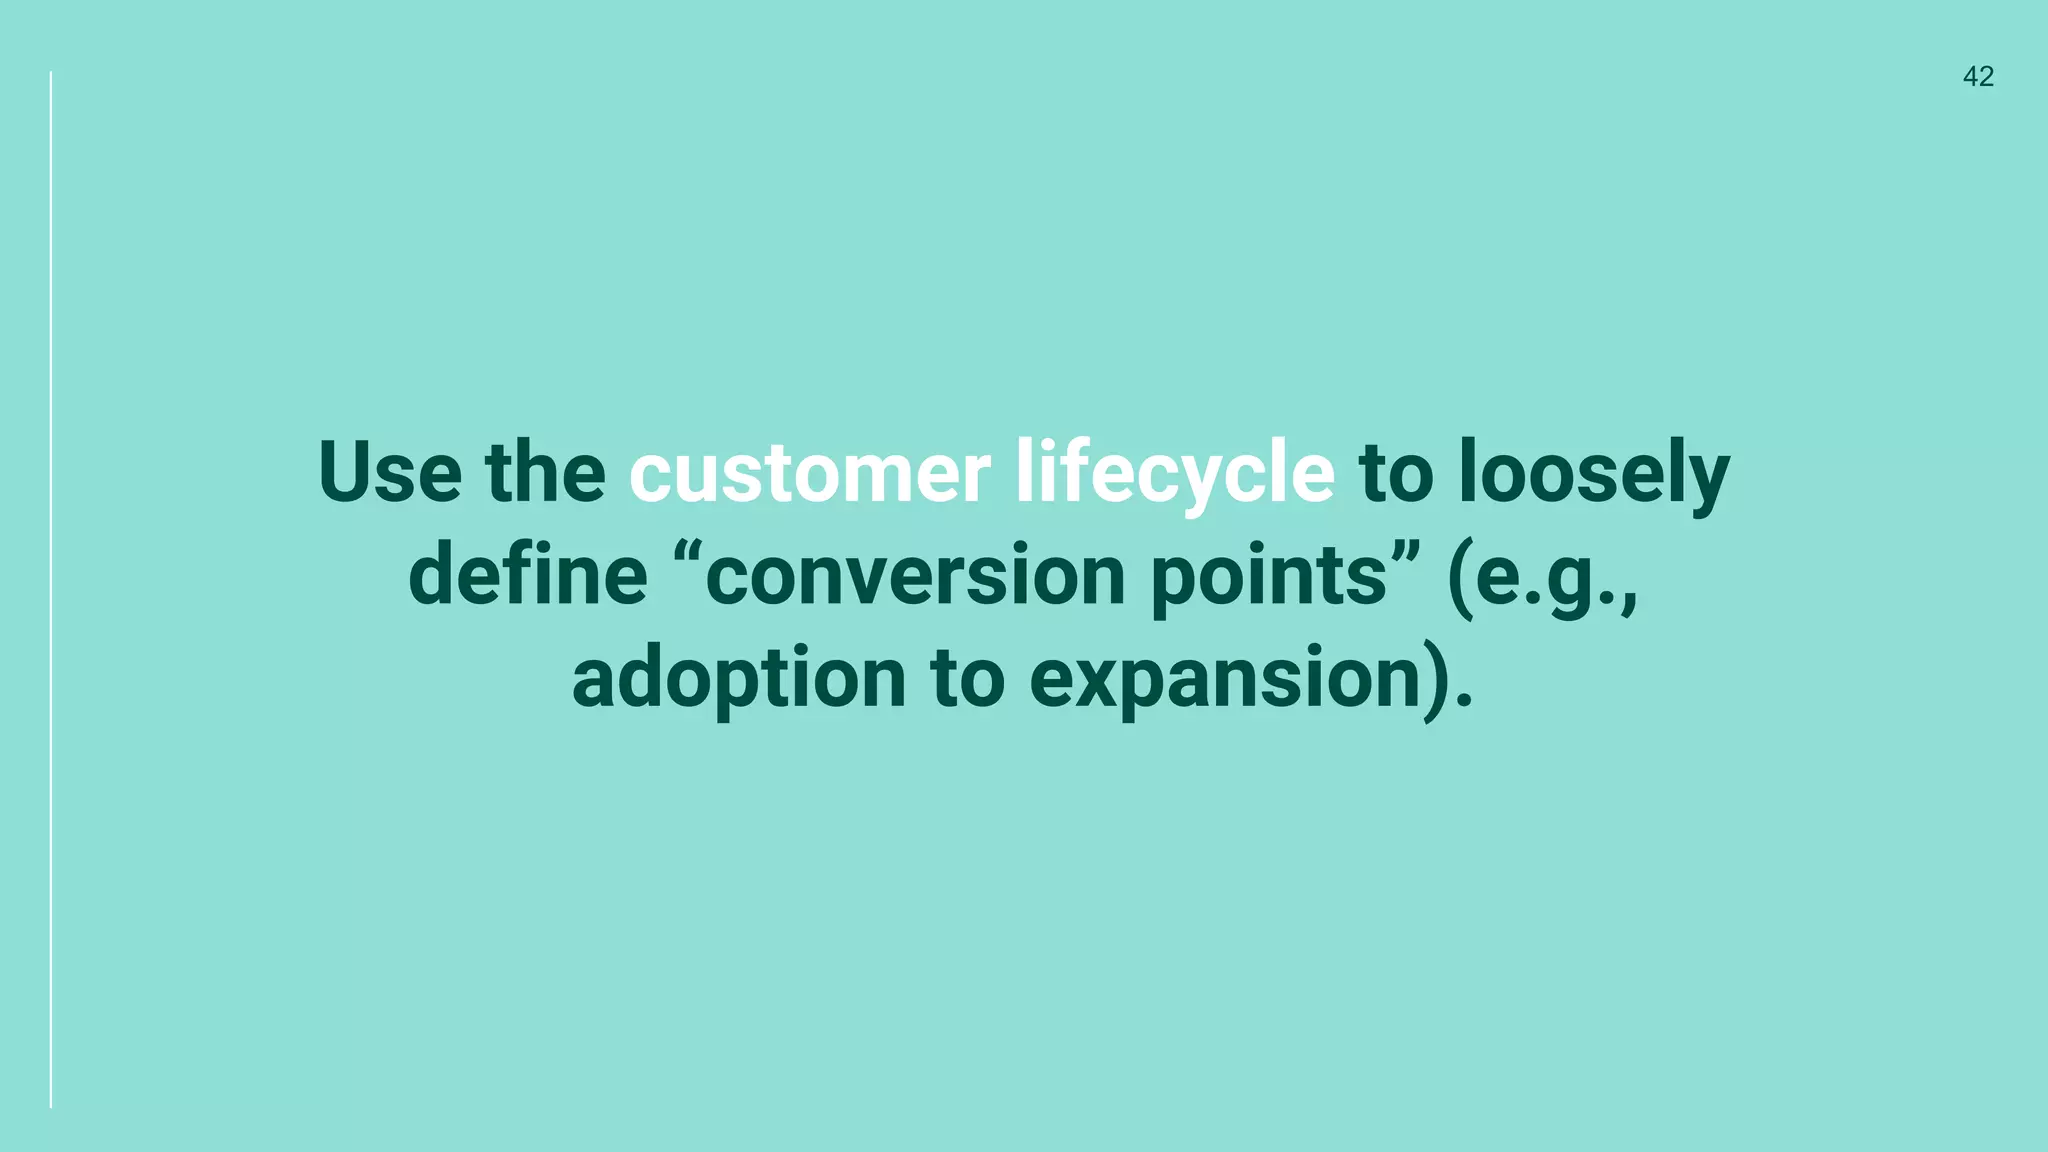
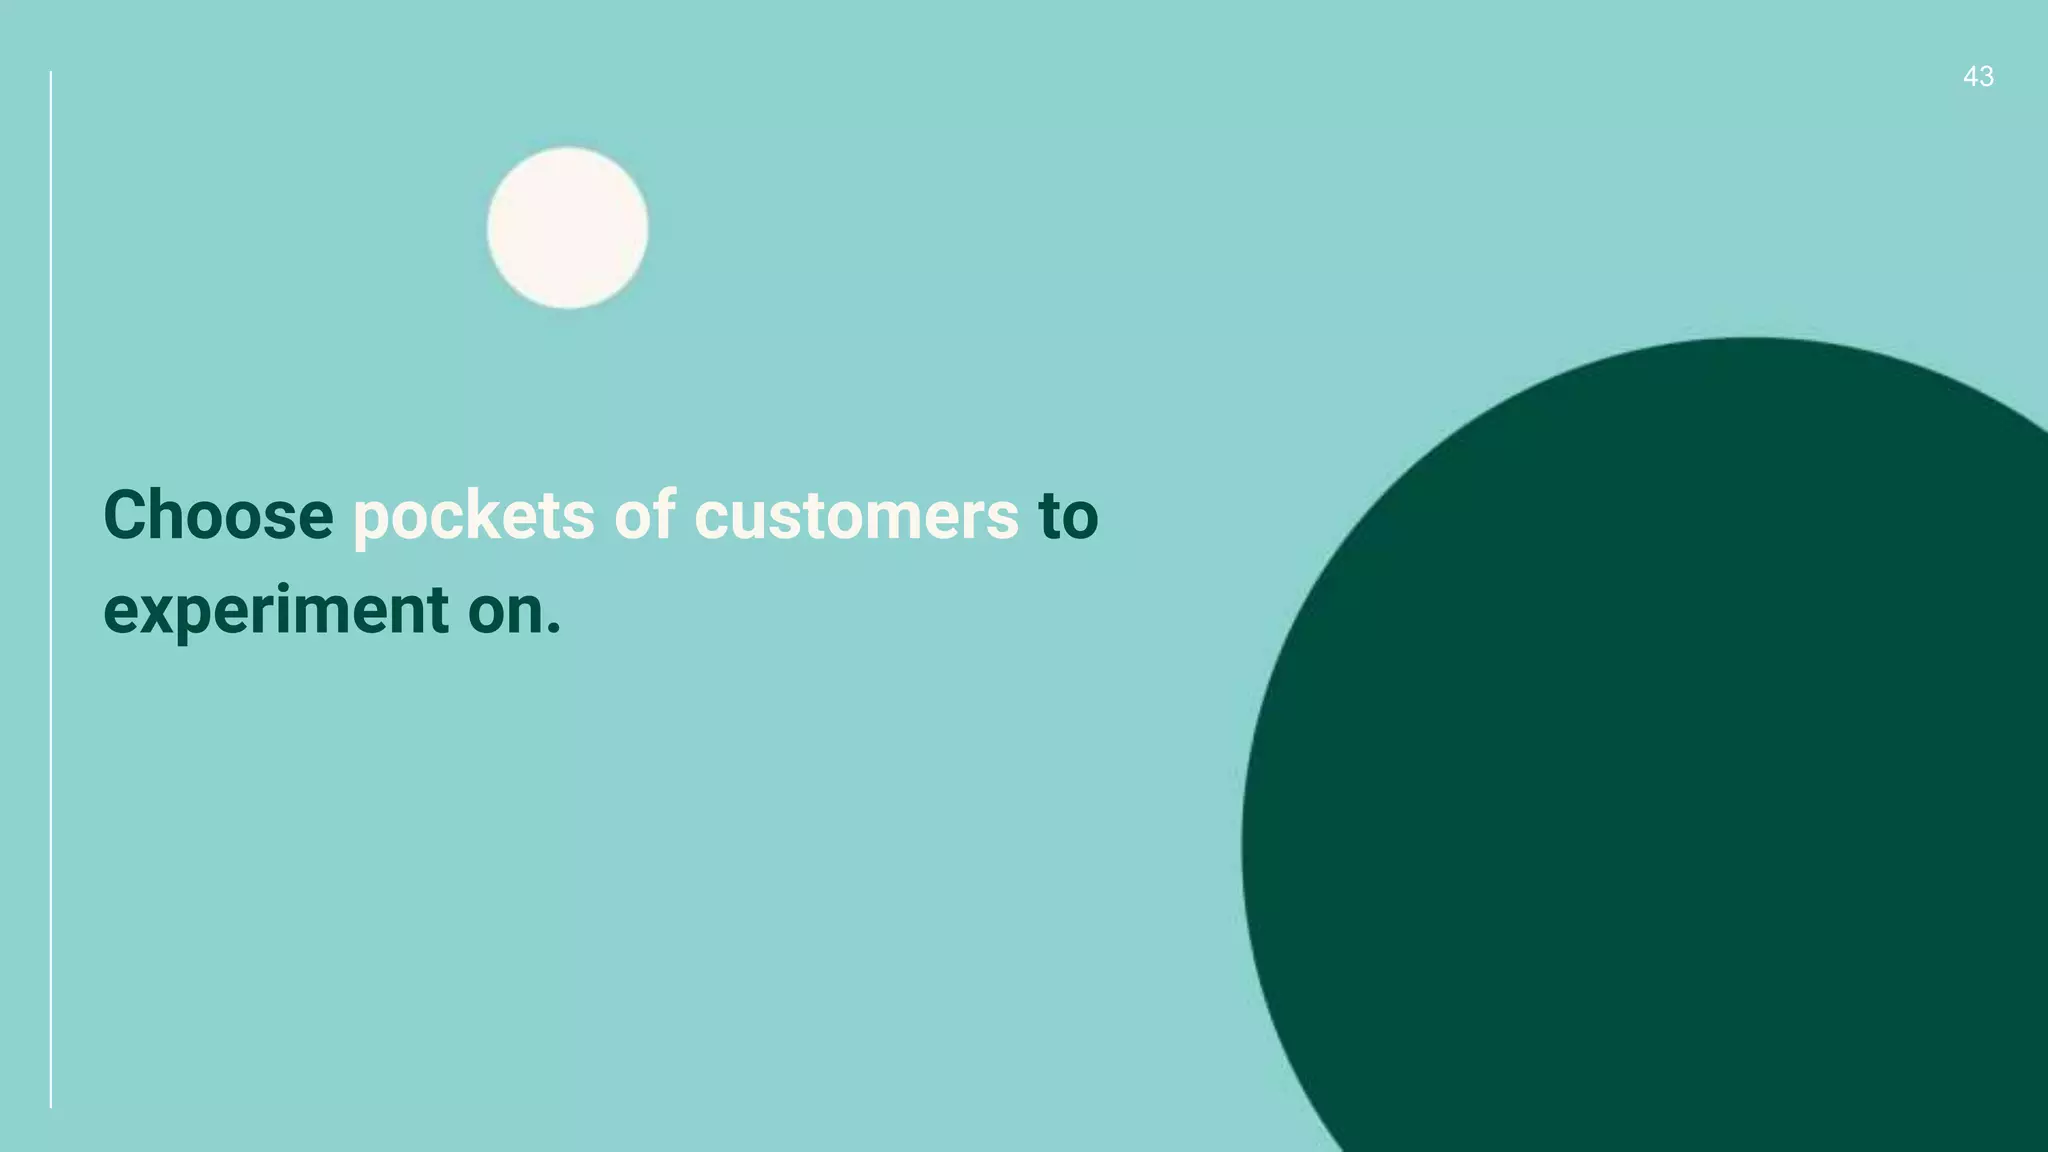
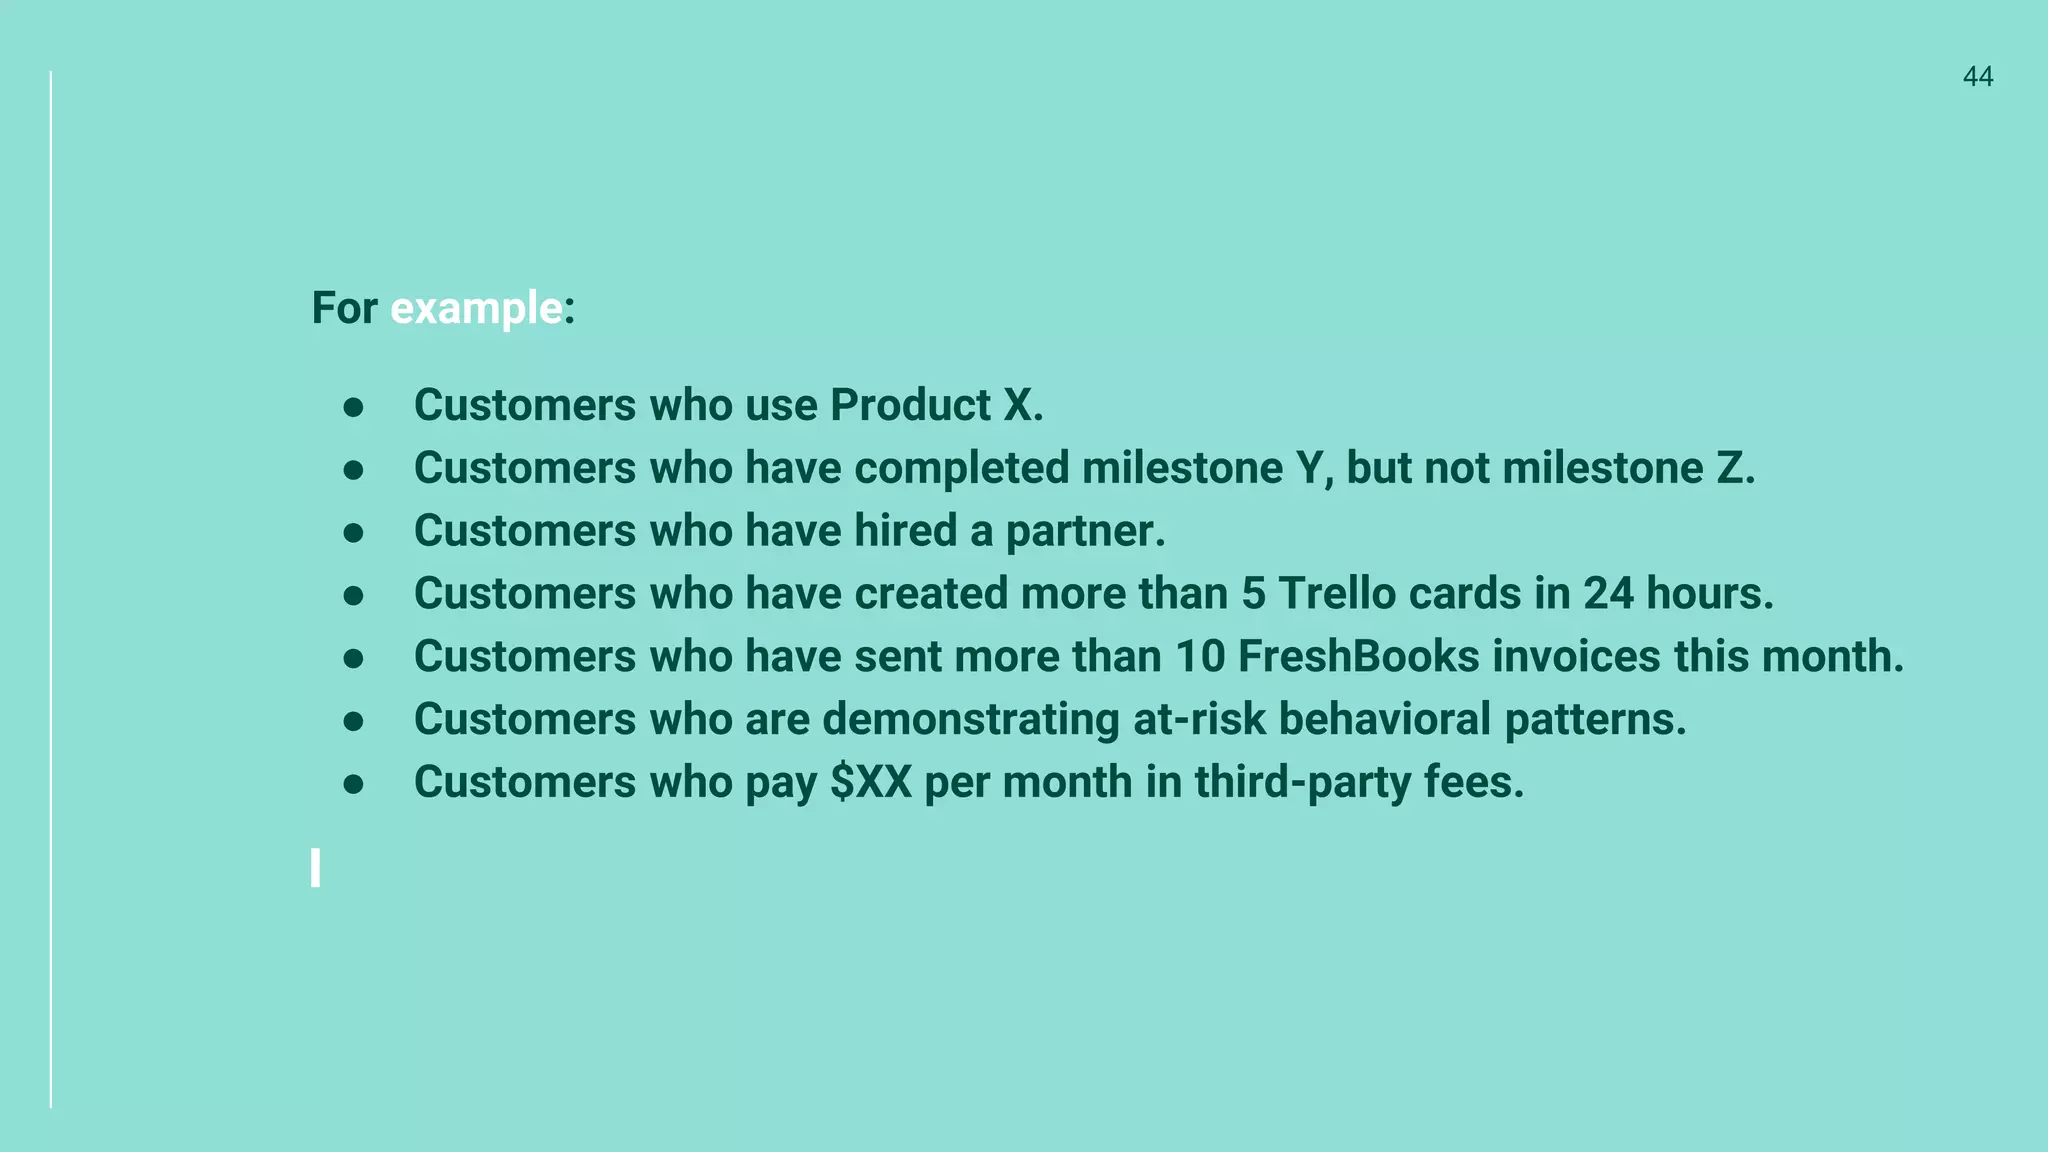
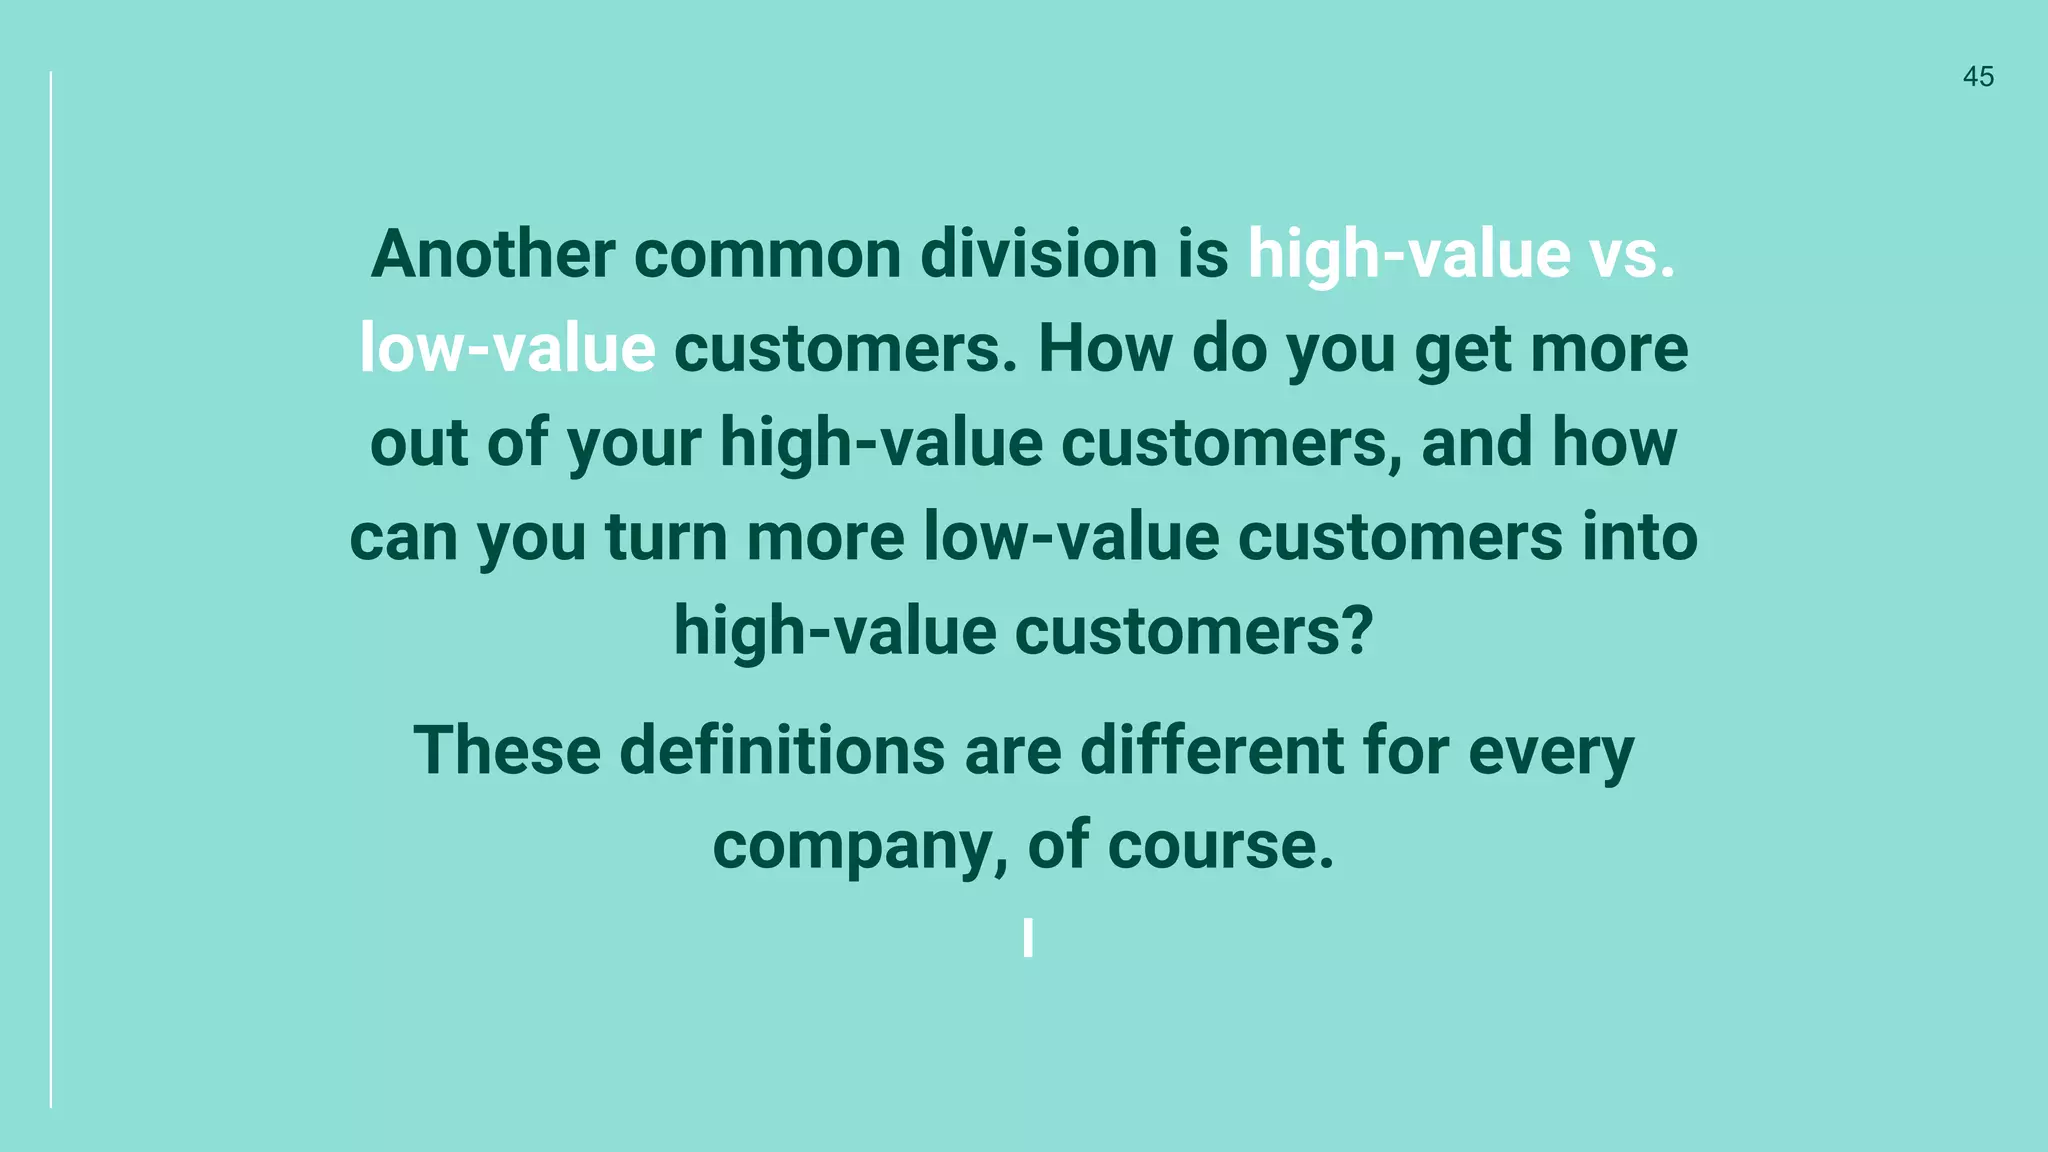
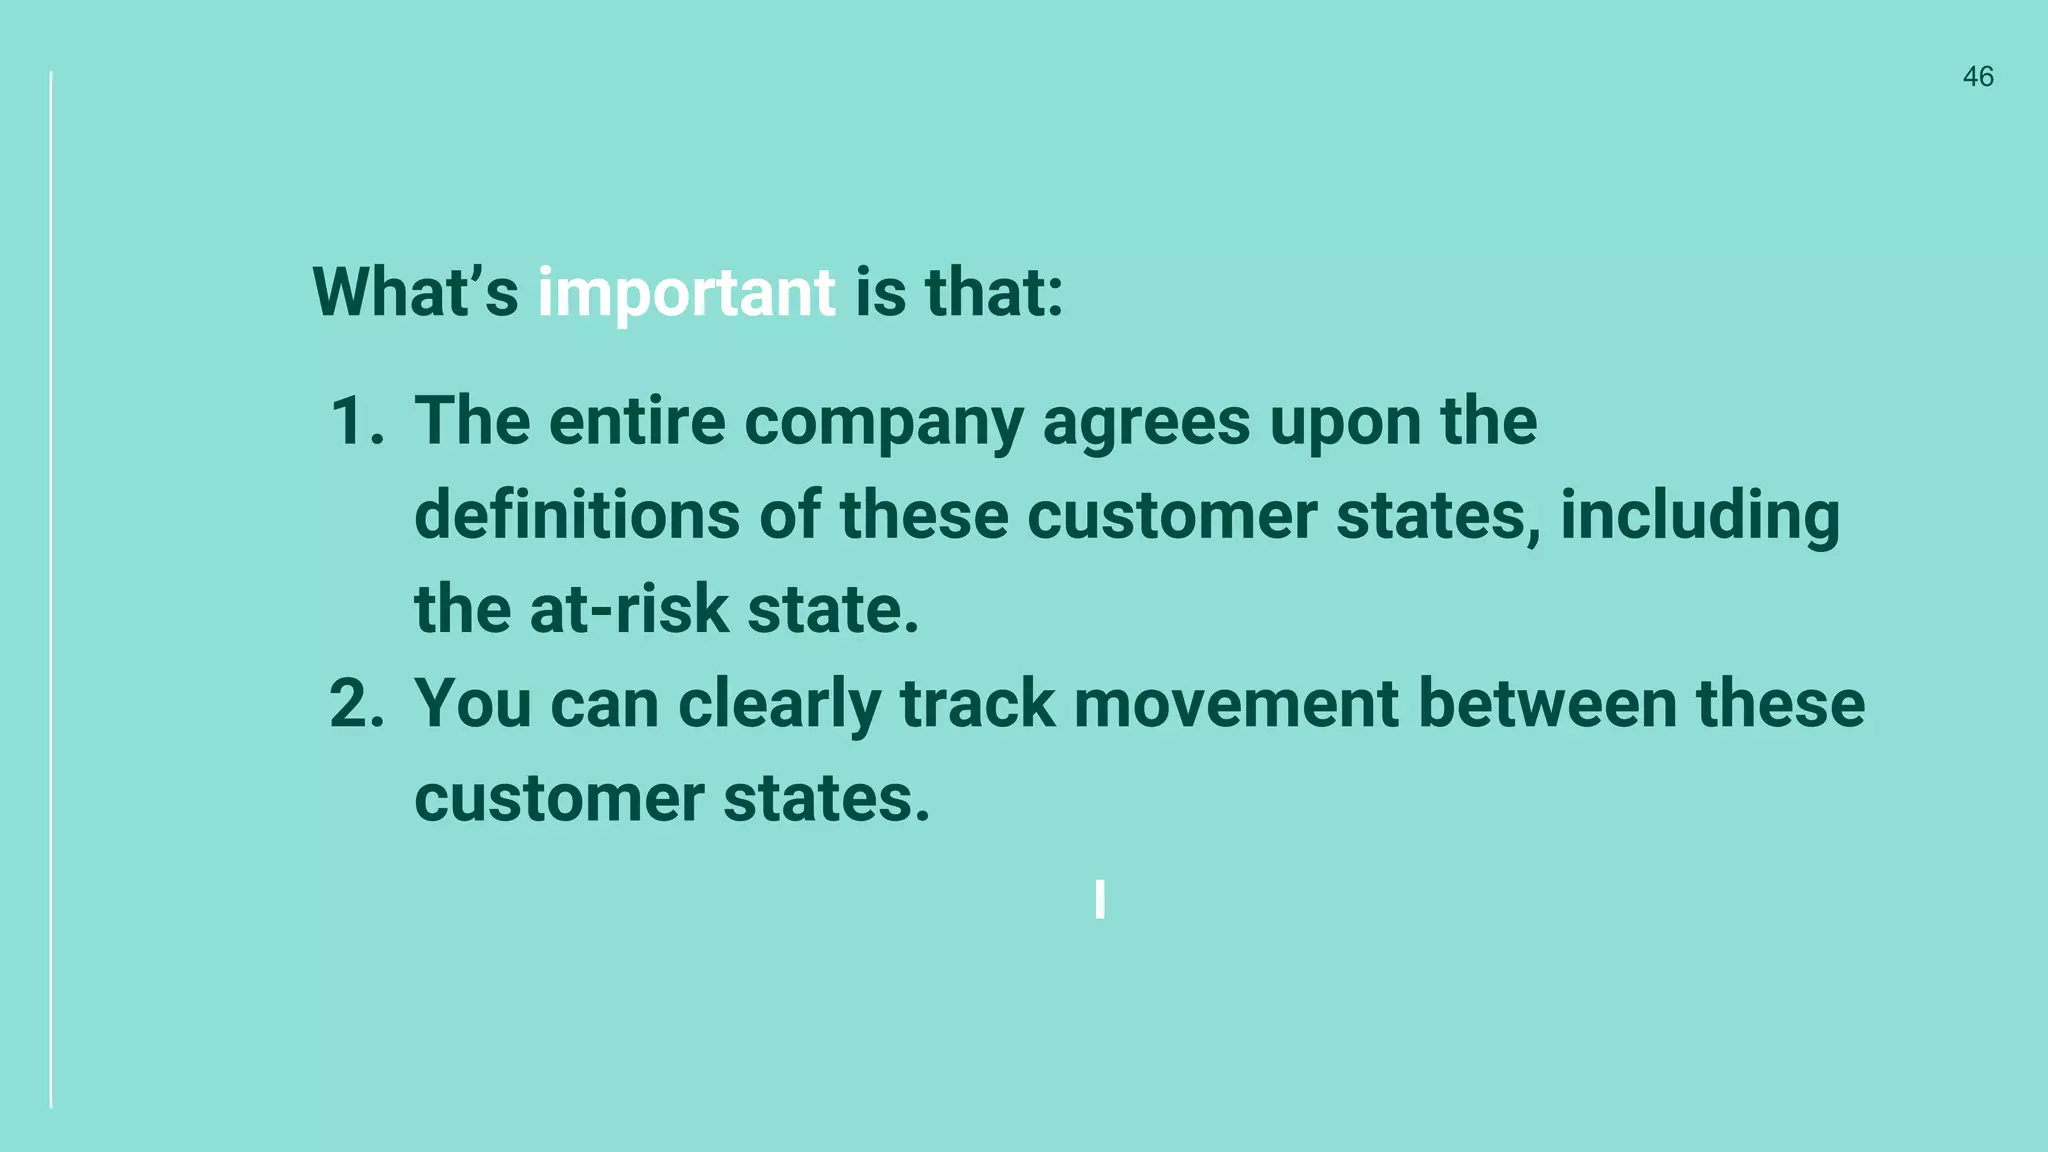
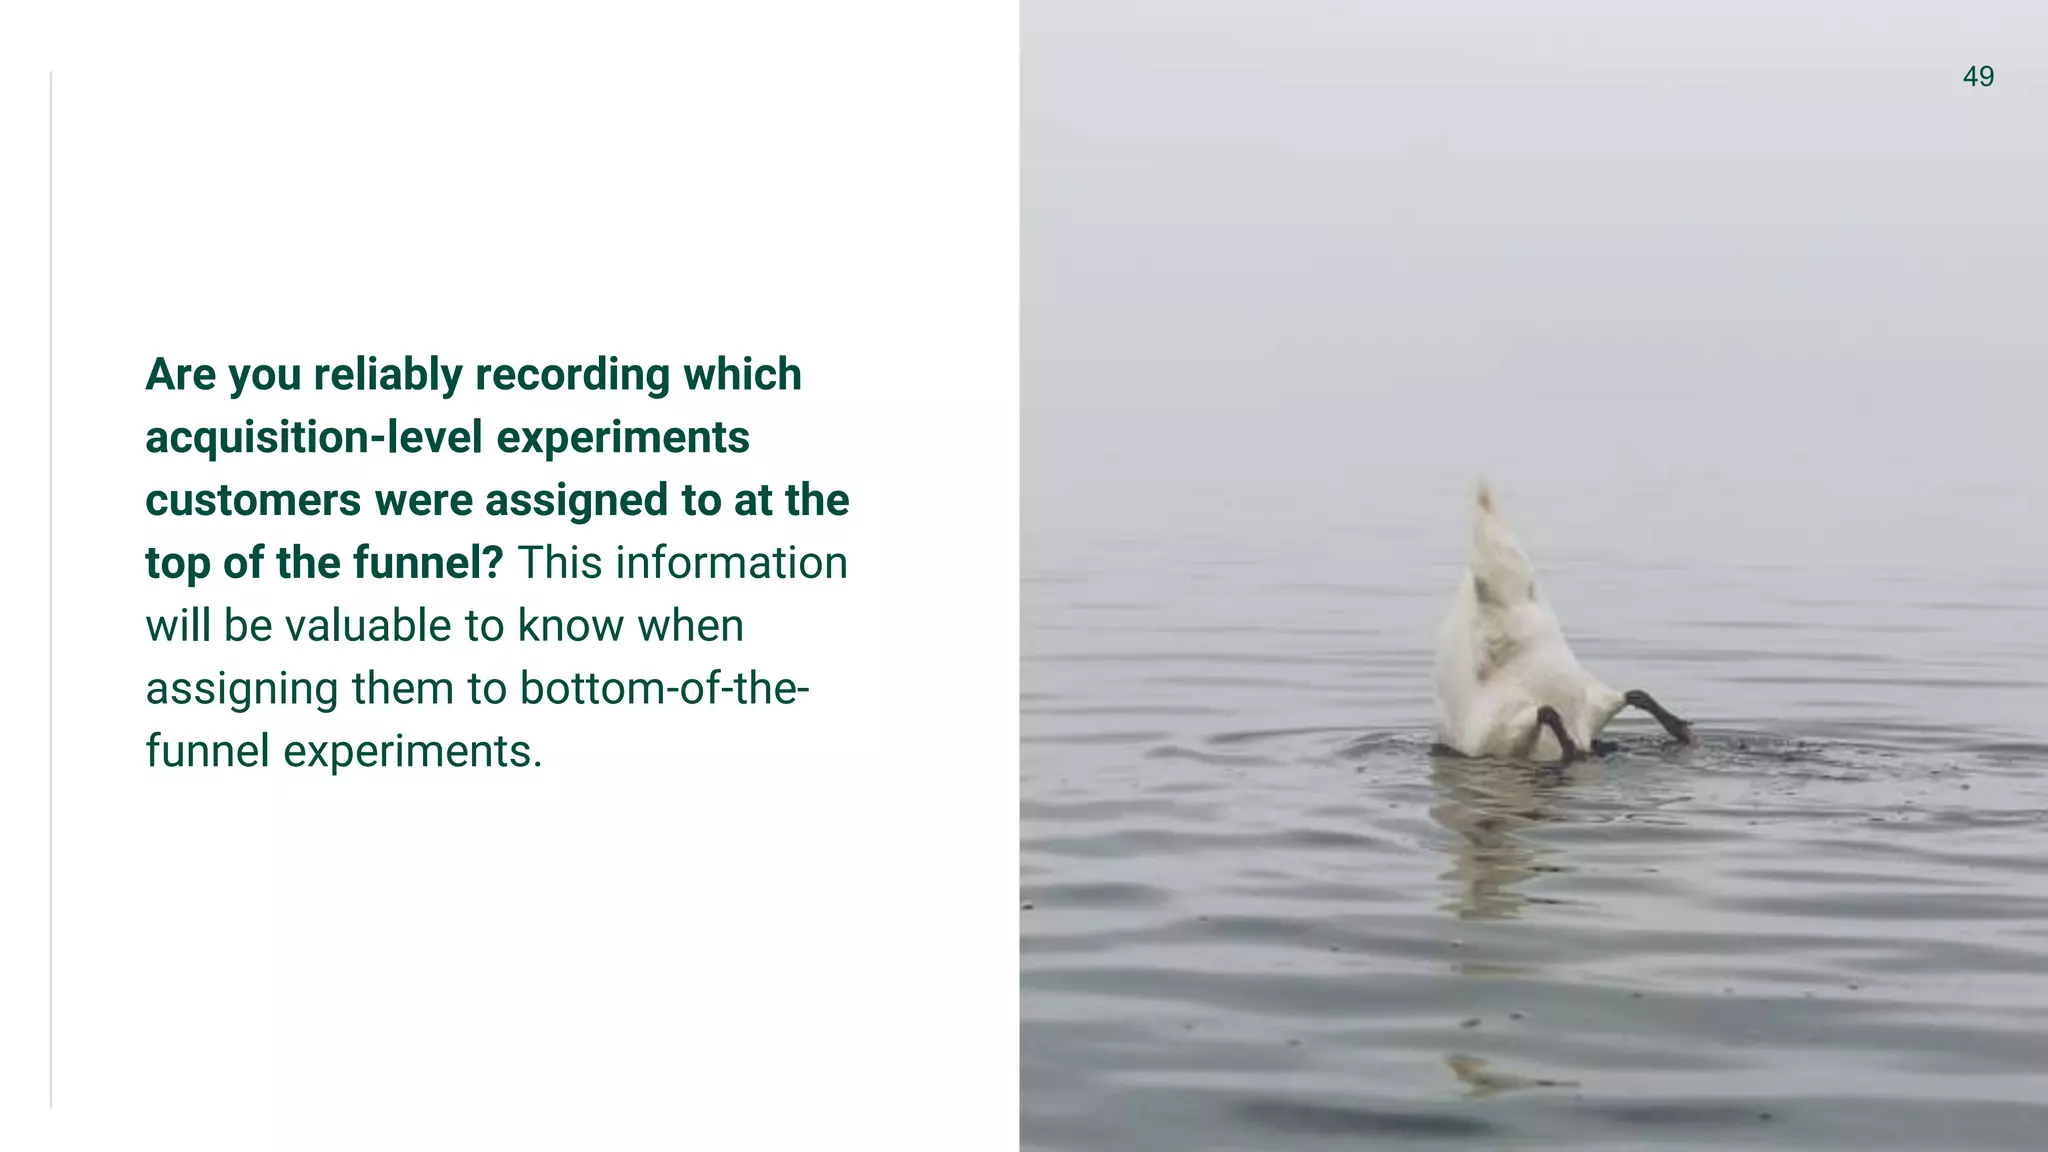
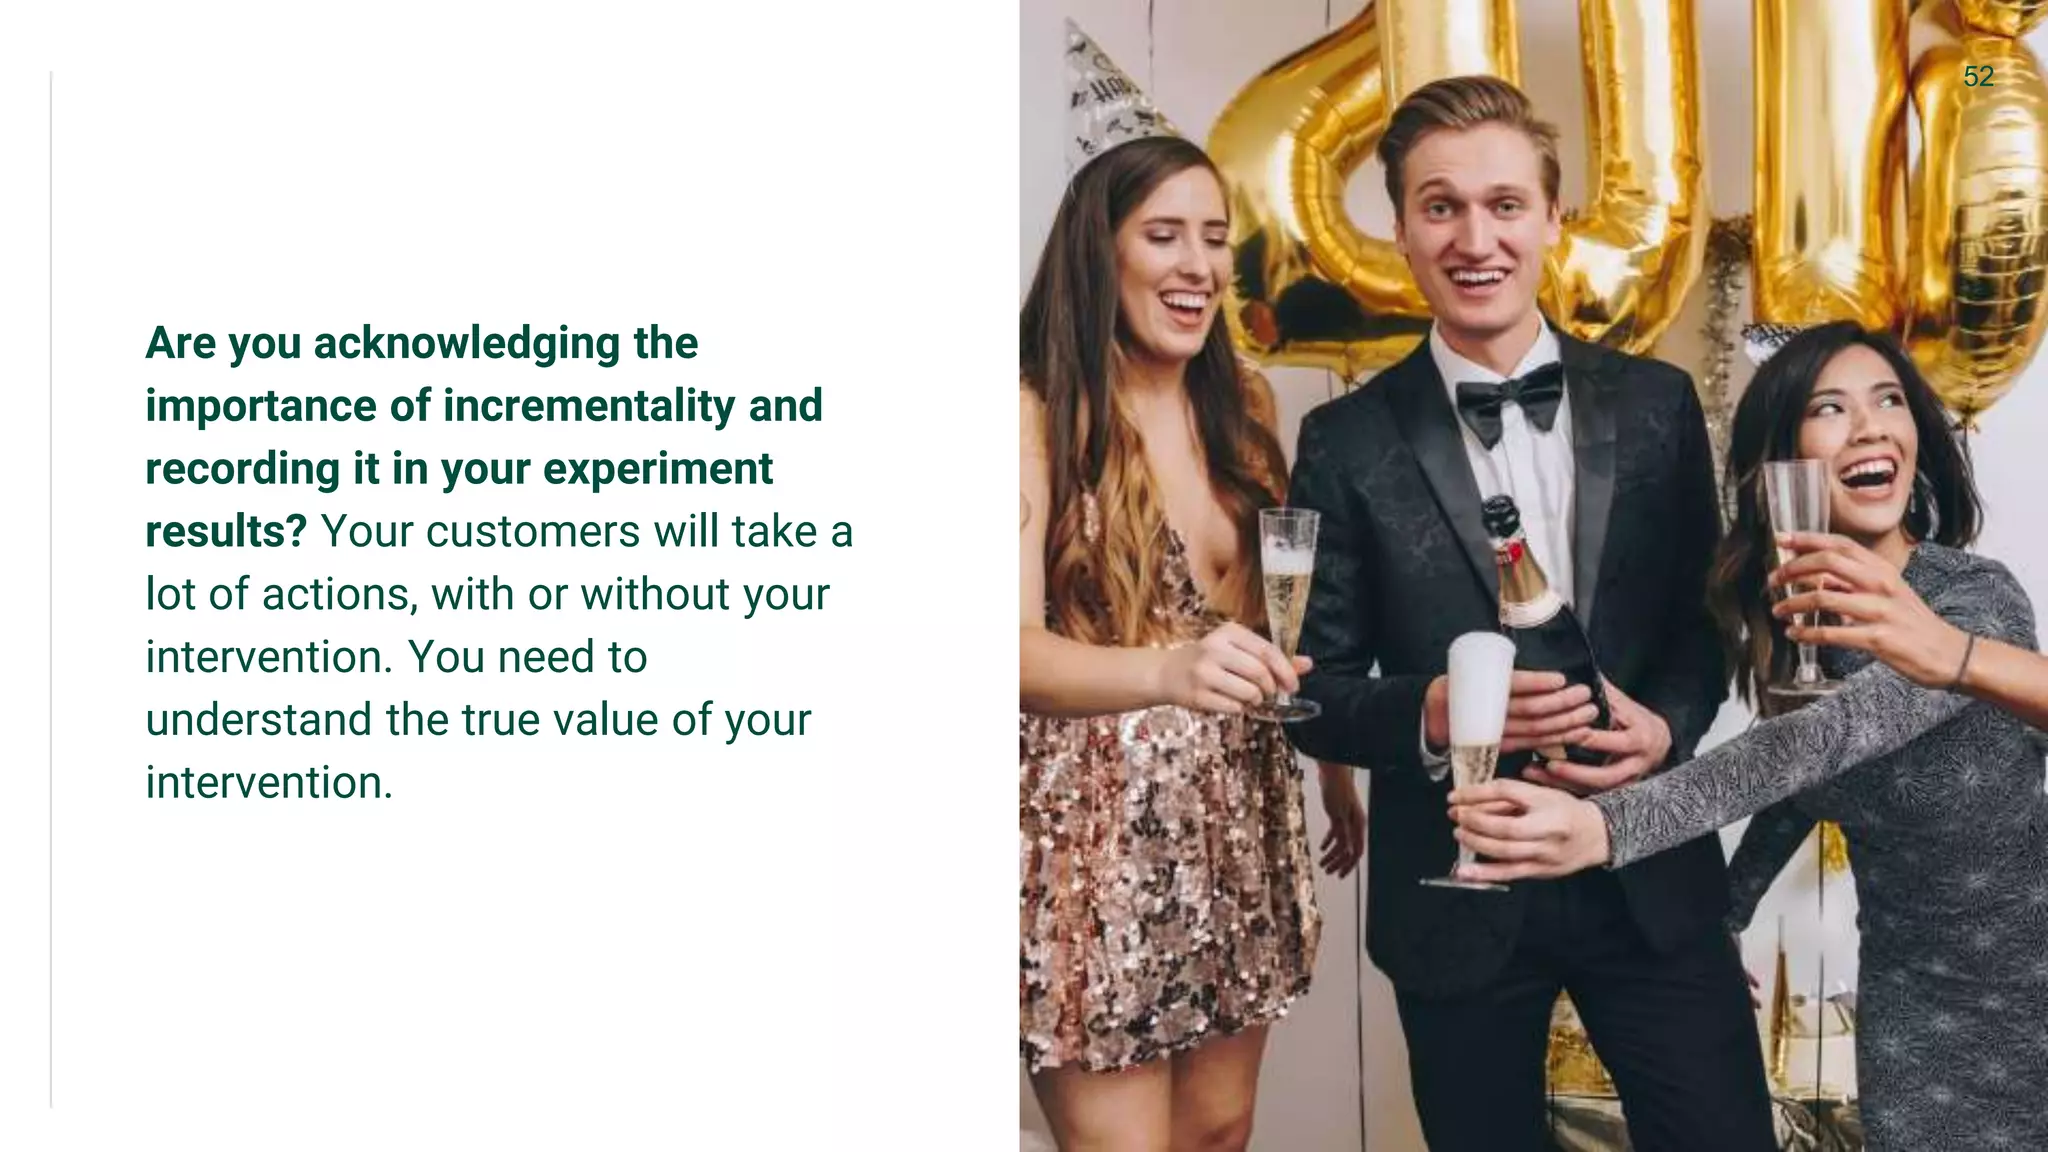
How to Optimize for
SaaS Retention
Shanelle Mullin
Customer Acquisition Program Manager, CRO at Shopify
Do you know how much
money retention marketing
made you last year?
2
Acquiring new customers is 5-
25x more expensive than
retaining existing customers.
3
The Pareto Principle states
that you get 80% of your
revenue from 20% of your
customers.
4
5
It only takes 1-2 bad experiences
to lose a customer forever.
33% of U.S. customers
consider switching companies
immediately following a single
instance of poor service.
6
That number jumps to 60%
after a second instance.
7
An unhappy customer shares a
negative experience with
about 15 people. A positive
experience? Only 11 people.
8
9
Customers trust each other
...more than they trust us.
81% of customers trust
recommendations from
friends and family over
business advice.
10
65% don’t trust ads and 71%
don’t trust sponsored social
media ads, in particular.
11
12
The ROI of an existing customer
is higher than the ROI of a new
customer.
A 5% increase in customer
retention correlates with at
least a 25% increase in profit.
13
Emotionally invested
customers will spend $699
with a company annually while
regular, satisfied customers
will spend only about $275.
14
15
Seriously, retention is lucrative...
let’s get this bread.
60% of loyal customers
purchase more frequently
from their preferred
companies.
16
50% of loyal customers will
purchase more products from
those preferred companies.
17
And yet...
18
This:
19
That:
20
Do you know how much
money retention marketing
made you last year?
21
Do you know how much
money retention marketing
made you last year?
22
LOL, no.
23
Lifecycle Stages01
Activation: The goal at this stage is
to get the customer to experience
your product’s value as quickly and
then as frequently as possible.
Metric examples:
● 30-day retention, 60-day
retention, 90-day retention,
120-day retention, etc.;
● Product or onboarding
milestone completion rates;
● Speed to first value
experience.
24
Adoption: The goal at this stage is to get
the customer to form habits around the
use of your product.
Metric examples:
● Login frequency and consistency;
● Frequency of value experience;
● Product usage (e.g., number of
HubSpot user accounts, number of
Trello cards, number of WordPress
articles, etc.);
● Renewal rate.
25
26
Expansion: The goal at this stage is to
deepen engagement and loyalty, whether
that results directly in monetary gain (e.g.,
upgrading plans) or not (e.g., joining a user
group).
Metric examples:
● Monthly recurring revenue (MRR);
● Average revenue per account (ARPA);
● Engagement;
● Customer lifetime value (LTV);
● Upsell/cross-sell conversion rates.
27
Referral: Whether they’re part of a
formal or informal referral loop, the
goal is to get the customer to
identify with your company and/or
product so heavily that they
become a marketing and sales
vehicle.
Metric examples:
● Product affinity;
● Referral or affiliate revenue;
● Loyalty rewards redemption
rate.
28
Reactivation: The goal at this
stage is to re-engage and
reactivate those who are
demonstrating at-risk behavior
patterns or who have
completely churned.
Metric examples:
● Customer save rate;
● Customer churn rate;
● Re-engagement rate.
29
30
Metrics & Audiences02
31
Clearly define customer lifetime
value (LTV).
First, the model has to assume
the definition of a “lifetime.”
For example, do you use a true
lifetime? Or something more
finite, like three years?
32
Second, the model has to define
revenue and cost items, which can
be complicated in large SaaS
ecosystems. For example, do you
include staff salaries? Do you
include revenue sharing with other
parties?
33
LTV = (Average Revenue Per Account x
The Difference Between Revenue and Cost
of Goods Sold) / Customer Churn Rate
As your retention
experimentation program
matures, you’ll adjust the
formula to account for MRR
fluctuations, non-linear churn,
and enterprise customers, for
example.
35
36
Retention metrics are more
complex for a few reasons.
There’s a whole lot of options for
SaaS customers to choose from.
Deciding what the next most
valuable action for a specific
customer is at any given time is
complicated and contextual.
37
Second, retention metrics are more
difficult to benchmark and forecast.
38
Third, cohorts and segments make
experimentation more difficult.
39
You have to shift your thinking from
something as simple as session-to-lead
conversion rate to something as complicated
as a specific cohort’s adoption and retention
rate for a specific product, for which you may
or may not have a reliable benchmark.
40
Choosing the right retention metrics
comes down to one thing:
understanding what best predicts
the long-term success of your
customers.
41
Use the customer lifecycle to loosely
define “conversion points” (e.g.,
adoption to expansion).
42
43
Choose pockets of customers to
experiment on.
For example:
● Customers who use Product X.
● Customers who have completed milestone Y, but not milestone Z.
● Customers who have hired a partner.
● Customers who have created more than 5 Trello cards in 24 hours.
● Customers who have sent more than 10 FreshBooks invoices this month.
● Customers who are demonstrating at-risk behavioral patterns.
● Customers who pay $XX per month in third-party fees.
44
Another common division is high-value vs.
low-value customers. How do you get more
out of your high-value customers, and how
can you turn more low-value customers into
high-value customers?
These definitions are different for every
company, of course.
45
What’s important is that:
1. The entire company agrees upon the
definitions of these customer states, including
the at-risk state.
2. You can clearly track movement between these
customer states.
46
47
Before You Go...03
It’s easy for a customer to end up
in multiple experiments at the
same time. This isn’t inherently
bad. For example, at any given time,
you’re likely in multiple Netflix
experiments. The problem emerges
when experiments conflict with one
another, skewing the results. How
are you monitoring experiment
interference and preventing this?
48
Are you reliably recording which
acquisition-level experiments
customers were assigned to at the
top of the funnel? This information
will be valuable to know when
assigning them to bottom-of-the-
funnel experiments.
49
Experiment results degrade. Are
you rerunning experiments to
verify initial findings? Are you
measuring down the funnel (in
addition to your primary metric) to
identify this degradation, as well as
false negatives and false positives?
50
Are you using balance metrics (e.g.
gross customer adds vs. net
customer adds) to ensure you’re
not gaming retention metrics? For
example, are you increasing 30-day
retention to the detriment of MRR?
It’s especially easy to unknowingly
game retention metrics at large
companies where different
departments have different key
performance indicators (KPIs).
51
Are you acknowledging the
importance of incrementality and
recording it in your experiment
results? Your customers will take a
lot of actions, with or without your
intervention. You need to
understand the true value of your
intervention.
52
Do you know how much
money retention marketing
made you last year?
53
54
Thanks!
Let’s be friends on Twitter?
@shanelle_mullin
QnA

How to Optimize for SaaS Retention | Masters of Conversion

  • 1.
    How to Optimizefor SaaS Retention Shanelle Mullin Customer Acquisition Program Manager, CRO at Shopify
  • 2.
    Do you knowhow much money retention marketing made you last year? 2
  • 3.
    Acquiring new customersis 5- 25x more expensive than retaining existing customers. 3
  • 4.
    The Pareto Principlestates that you get 80% of your revenue from 20% of your customers. 4
  • 5.
    5 It only takes1-2 bad experiences to lose a customer forever.
  • 6.
    33% of U.S.customers consider switching companies immediately following a single instance of poor service. 6
  • 7.
    That number jumpsto 60% after a second instance. 7
  • 8.
    An unhappy customershares a negative experience with about 15 people. A positive experience? Only 11 people. 8
  • 9.
    9 Customers trust eachother ...more than they trust us.
  • 10.
    81% of customerstrust recommendations from friends and family over business advice. 10
  • 11.
    65% don’t trustads and 71% don’t trust sponsored social media ads, in particular. 11
  • 12.
    12 The ROI ofan existing customer is higher than the ROI of a new customer.
  • 13.
    A 5% increasein customer retention correlates with at least a 25% increase in profit. 13
  • 14.
    Emotionally invested customers willspend $699 with a company annually while regular, satisfied customers will spend only about $275. 14
  • 15.
    15 Seriously, retention islucrative... let’s get this bread.
  • 16.
    60% of loyalcustomers purchase more frequently from their preferred companies. 16
  • 17.
    50% of loyalcustomers will purchase more products from those preferred companies. 17
  • 18.
  • 19.
  • 20.
  • 21.
    Do you knowhow much money retention marketing made you last year? 21
  • 22.
    Do you knowhow much money retention marketing made you last year? 22 LOL, no.
  • 23.
  • 24.
    Activation: The goalat this stage is to get the customer to experience your product’s value as quickly and then as frequently as possible. Metric examples: ● 30-day retention, 60-day retention, 90-day retention, 120-day retention, etc.; ● Product or onboarding milestone completion rates; ● Speed to first value experience. 24
  • 25.
    Adoption: The goalat this stage is to get the customer to form habits around the use of your product. Metric examples: ● Login frequency and consistency; ● Frequency of value experience; ● Product usage (e.g., number of HubSpot user accounts, number of Trello cards, number of WordPress articles, etc.); ● Renewal rate. 25
  • 26.
  • 27.
    Expansion: The goalat this stage is to deepen engagement and loyalty, whether that results directly in monetary gain (e.g., upgrading plans) or not (e.g., joining a user group). Metric examples: ● Monthly recurring revenue (MRR); ● Average revenue per account (ARPA); ● Engagement; ● Customer lifetime value (LTV); ● Upsell/cross-sell conversion rates. 27
  • 28.
    Referral: Whether they’repart of a formal or informal referral loop, the goal is to get the customer to identify with your company and/or product so heavily that they become a marketing and sales vehicle. Metric examples: ● Product affinity; ● Referral or affiliate revenue; ● Loyalty rewards redemption rate. 28
  • 29.
    Reactivation: The goalat this stage is to re-engage and reactivate those who are demonstrating at-risk behavior patterns or who have completely churned. Metric examples: ● Customer save rate; ● Customer churn rate; ● Re-engagement rate. 29
  • 30.
  • 31.
    31 Clearly define customerlifetime value (LTV).
  • 32.
    First, the modelhas to assume the definition of a “lifetime.” For example, do you use a true lifetime? Or something more finite, like three years? 32
  • 33.
    Second, the modelhas to define revenue and cost items, which can be complicated in large SaaS ecosystems. For example, do you include staff salaries? Do you include revenue sharing with other parties? 33
  • 34.
    LTV = (AverageRevenue Per Account x The Difference Between Revenue and Cost of Goods Sold) / Customer Churn Rate
  • 35.
    As your retention experimentationprogram matures, you’ll adjust the formula to account for MRR fluctuations, non-linear churn, and enterprise customers, for example. 35
  • 36.
    36 Retention metrics aremore complex for a few reasons.
  • 37.
    There’s a wholelot of options for SaaS customers to choose from. Deciding what the next most valuable action for a specific customer is at any given time is complicated and contextual. 37
  • 38.
    Second, retention metricsare more difficult to benchmark and forecast. 38
  • 39.
    Third, cohorts andsegments make experimentation more difficult. 39
  • 40.
    You have toshift your thinking from something as simple as session-to-lead conversion rate to something as complicated as a specific cohort’s adoption and retention rate for a specific product, for which you may or may not have a reliable benchmark. 40
  • 41.
    Choosing the rightretention metrics comes down to one thing: understanding what best predicts the long-term success of your customers. 41
  • 42.
    Use the customerlifecycle to loosely define “conversion points” (e.g., adoption to expansion). 42
  • 43.
    43 Choose pockets ofcustomers to experiment on.
  • 44.
    For example: ● Customerswho use Product X. ● Customers who have completed milestone Y, but not milestone Z. ● Customers who have hired a partner. ● Customers who have created more than 5 Trello cards in 24 hours. ● Customers who have sent more than 10 FreshBooks invoices this month. ● Customers who are demonstrating at-risk behavioral patterns. ● Customers who pay $XX per month in third-party fees. 44
  • 45.
    Another common divisionis high-value vs. low-value customers. How do you get more out of your high-value customers, and how can you turn more low-value customers into high-value customers? These definitions are different for every company, of course. 45
  • 46.
    What’s important isthat: 1. The entire company agrees upon the definitions of these customer states, including the at-risk state. 2. You can clearly track movement between these customer states. 46
  • 47.
  • 48.
    It’s easy fora customer to end up in multiple experiments at the same time. This isn’t inherently bad. For example, at any given time, you’re likely in multiple Netflix experiments. The problem emerges when experiments conflict with one another, skewing the results. How are you monitoring experiment interference and preventing this? 48
  • 49.
    Are you reliablyrecording which acquisition-level experiments customers were assigned to at the top of the funnel? This information will be valuable to know when assigning them to bottom-of-the- funnel experiments. 49
  • 50.
    Experiment results degrade.Are you rerunning experiments to verify initial findings? Are you measuring down the funnel (in addition to your primary metric) to identify this degradation, as well as false negatives and false positives? 50
  • 51.
    Are you usingbalance metrics (e.g. gross customer adds vs. net customer adds) to ensure you’re not gaming retention metrics? For example, are you increasing 30-day retention to the detriment of MRR? It’s especially easy to unknowingly game retention metrics at large companies where different departments have different key performance indicators (KPIs). 51
  • 52.
    Are you acknowledgingthe importance of incrementality and recording it in your experiment results? Your customers will take a lot of actions, with or without your intervention. You need to understand the true value of your intervention. 52
  • 53.
    Do you knowhow much money retention marketing made you last year? 53
  • 54.
    54 Thanks! Let’s be friendson Twitter? @shanelle_mullin
  • 55.