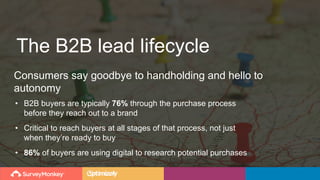
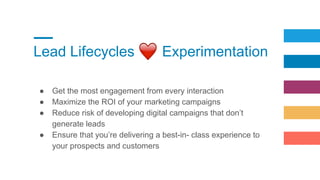
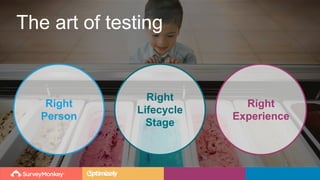
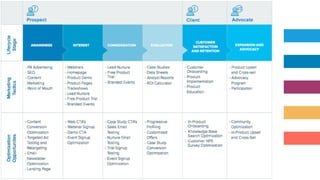
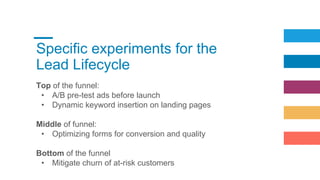
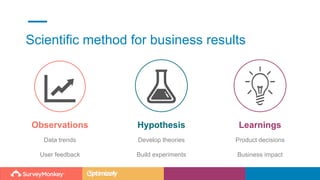
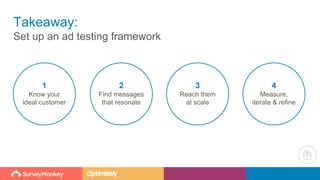
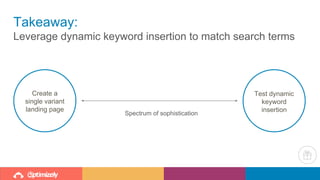
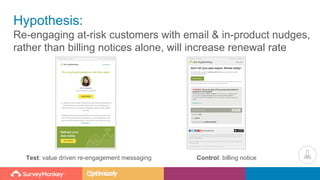
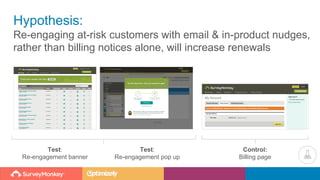
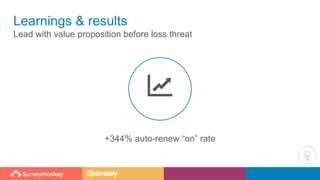
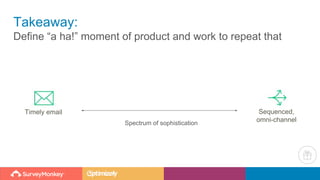
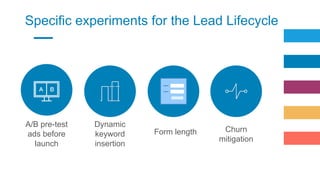
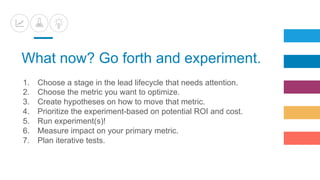
Cara Harshman
Experimentation Evangelist,
Everywhere
Optimizing Your B2B
Demand Generation Machine
How experimentation helps you do more with less
Aliza Edelstein
Senior Manager, Demand Generation,
SurveyMonkey
Hi! We’re Cara and Aliza.
Experimentation
Evangelist,
Everywhere
Senior Manager,
Demand Generation,
SurveyMonkey
Outline for today’s webinar
• Define the Lead Lifecycle /
Buyer’s Journey
• Why experimentation is vital
• Experiments for the Lead Lifecycle
• Takeaways from each
• What you can do today
The B2B lead lifecycle
Consumers say goodbye to handholding and hello to
autonomy
The B2B lead lifecycle
Consumers say goodbye to handholding and hello to
autonomy
• B2B buyers are typically 76% through the purchase process
before they reach out to a brand
• Critical to reach buyers at all stages of that process, not just
when they’re ready to buy
• 86% of buyers are using digital to research potential purchases
Lead Lifecycles
● Get the most engagement from every interaction
● Maximize the ROI of your marketing campaigns
● Reduce risk of developing digital campaigns that don’t
generate leads
● Ensure that you’re delivering a best-in- class experience to
your prospects and customers
Experimentation
The art of testing
Right
Person
Right
Lifecycle
Stage
Right
Experience
Specific experiments for the
Lead Lifecycle
Top of the funnel:
• A/B pre-test ads before launch
• Dynamic keyword insertion on landing pages
Middle of funnel:
• Optimizing forms for conversion and quality
Bottom of the funnel
• Mitigate churn of at-risk customers
Observations
Data trends
User feedback
Learnings
Product decisions
Business impact
Hypothesis
Develop theories
Build experiments
Scientific method for business results
Our survey platform has been the market leader since 1999
SurveyMonkey is the world’s largest feedback company
3M
Survey
responses daily
99%
Fortune 500
25M
Customers
worldwide
Tests across SurveyMonkey’s businesses are unique!
Forms
Platform
Solutions
Surveys
Salesforce Marketo EloquaIntegrations
Observations
Data trends
User feedback
Learnings
Product decisions
Business impact
Hypothesis
Develop theories
Build experiments
Scientific method for business results
TOP OF THE FUNNEL
Experiment #1:
Pre-test ads before launch
Observation:
One ad set had weaker performance on paid social than average of others
Hypothesis:
Offering a clearer value prop & using different copy to emphasize benefits
would increase performance (higher CTR)
B
Stop wasting
money on
terrible ads
Test B: benefitsTest A: features
A
Get “The Lean
Marketer’s Guide
to Concept
Testing”
Learnings & results:
“Features” Ad A scored highest and resonated more with target audience
Attributes Tested Ad A - features Ad B - benefits
Relevance 48% 41%
Quality 28% 14%
Uniqueness 19% 15%
Clarity 55% 49%
Believability 25% 16%
Likeability 50% 40%
Attributes Tested Ad A - features Ad B - benefits
Convincing 51% 38%
Confusing 13% 15%
Irritating 17% 33%
Unique 35% 34%
Memorable 40% 36%
n = 309Statistically significant
Learnings & results:
“Features” Ad A scored highest and resonated more with target audience
Ad A - Features
Save money/time
Tips on testing concepts
More convincing, direct, factual
Too basic
Unclear
Ad B - Benefits
Save money/time
Tips on testing concepts
Too salesy
Too colloquial
Too negative
Not believable
Free alternatives
Learnings & results:
Use qualitative feedback to ideate new ads that target buyers explicitly
told us they’d be receptive to
Explicit DataImplicit Data
+
Improved ad: +43% CTR
=
Learnings & results:
Conduct buyer persona research; honor buyer sophistication
+43% click-through rate
Takeaway:
Set up an ad testing framework
1
Know your
ideal customer
2
Find messages
that resonate
4
Measure,
iterate & refine
3
Reach them
at scale
TOP OF THE FUNNEL
Experiment #2:
Drive more relevance at scale for your prospects
Observation:
Did not have a method of scaling relevance of SEM landing
pages for our vast variety of use cases
Hypothesis:
Dynamically inserting header text on landing pages that
matched search keyword intent would increase sign-up rate
Test: dynamic header text:
“Polls”
Control: static header text
Survey-related terms
Test: dynamic header text:
“Questionnaires”
Learnings & results
Test more relevant landing page copy
+92% sign-up rate
Takeaway:
Leverage dynamic keyword insertion to match search terms
Test dynamic
keyword
insertion
Create a
single variant
landing page
Spectrum of sophistication
MIDDLE OF THE FUNNEL
Experiment #3:
The form dilemma, so many experiments!
Observation:
Forms submissions are synonymous with leads. Our goal as demand gen
marketers is to drive people to complete a form.
Warning:
Be very thoughtful about how you optimize forms because you create a
data/conversion tradeoff.
Form A
- Fewer form fields
- High conversion rate
- Low data quality
Form B
- More form fields,
- Low conversion rate
- Higher data quality
Advice:
Use third party data providers to enrich your lead data (especially when
you experiment and remove fields).
Data Enrichment
providers we like:
- DemandBase
- ClearBit
- StrikeIron
BOTTOM OF THE FUNNEL
Experiment #4:
Mitigate churn of at-risk customers
Observation:
Messages to customers at risk to churn are primarily billing-focused, not
value & utility-focused
Hypothesis:
Re-engaging at-risk customers with email & in-product nudges,
rather than billing notices alone, will increase renewal rate
Control: billing noticeTest: value driven re-engagement messaging
Test:
Re-engagement banner
Control:
Billing page
Test:
Re-engagement pop up
Hypothesis:
Re-engaging at-risk customers with email & in-product nudges,
rather than billing notices alone, will increase renewals
Learnings & results
Lead with value proposition before loss threat
+344% auto-renew “on” rate
Takeaway:
Define “a ha!” moment of product and work to repeat that
Timely email Sequenced,
omni-channelSpectrum of sophistication
Specific experiments for the Lead Lifecycle
A/B pre-test
ads before
launch
Dynamic
keyword
insertion
Form length Churn
mitigation
What now? Go forth and experiment.
1. Choose a stage in the lead lifecycle that needs attention.
2. Choose the metric you want to optimize.
3. Create hypotheses on how to move that metric.
4. Prioritize the experiment-based on potential ROI and cost.
5. Run experiment(s)!
6. Measure impact on your primary metric.
7. Plan iterative tests.
@surveymonkey
surveymonkey.com/business
audience.surveymonkey.com
Question time with Cara and Aliza.
@caraharshman
optimizely.com/get-started
Thanks!

Optimizing Your B2B Demand Generation Machine

  • 1.
    Cara Harshman Experimentation Evangelist, Everywhere OptimizingYour B2B Demand Generation Machine How experimentation helps you do more with less Aliza Edelstein Senior Manager, Demand Generation, SurveyMonkey
  • 2.
    Hi! We’re Caraand Aliza. Experimentation Evangelist, Everywhere Senior Manager, Demand Generation, SurveyMonkey
  • 3.
    Outline for today’swebinar • Define the Lead Lifecycle / Buyer’s Journey • Why experimentation is vital • Experiments for the Lead Lifecycle • Takeaways from each • What you can do today
  • 4.
    The B2B leadlifecycle Consumers say goodbye to handholding and hello to autonomy
  • 5.
    The B2B leadlifecycle Consumers say goodbye to handholding and hello to autonomy • B2B buyers are typically 76% through the purchase process before they reach out to a brand • Critical to reach buyers at all stages of that process, not just when they’re ready to buy • 86% of buyers are using digital to research potential purchases
  • 6.
    Lead Lifecycles ● Getthe most engagement from every interaction ● Maximize the ROI of your marketing campaigns ● Reduce risk of developing digital campaigns that don’t generate leads ● Ensure that you’re delivering a best-in- class experience to your prospects and customers Experimentation
  • 7.
    The art oftesting Right Person Right Lifecycle Stage Right Experience
  • 9.
    Specific experiments forthe Lead Lifecycle Top of the funnel: • A/B pre-test ads before launch • Dynamic keyword insertion on landing pages Middle of funnel: • Optimizing forms for conversion and quality Bottom of the funnel • Mitigate churn of at-risk customers
  • 10.
    Observations Data trends User feedback Learnings Productdecisions Business impact Hypothesis Develop theories Build experiments Scientific method for business results
  • 11.
    Our survey platformhas been the market leader since 1999 SurveyMonkey is the world’s largest feedback company 3M Survey responses daily 99% Fortune 500 25M Customers worldwide
  • 12.
    Tests across SurveyMonkey’sbusinesses are unique! Forms Platform Solutions Surveys Salesforce Marketo EloquaIntegrations
  • 13.
    Observations Data trends User feedback Learnings Productdecisions Business impact Hypothesis Develop theories Build experiments Scientific method for business results
  • 14.
    TOP OF THEFUNNEL Experiment #1: Pre-test ads before launch
  • 15.
    Observation: One ad sethad weaker performance on paid social than average of others
  • 16.
    Hypothesis: Offering a clearervalue prop & using different copy to emphasize benefits would increase performance (higher CTR) B Stop wasting money on terrible ads Test B: benefitsTest A: features A Get “The Lean Marketer’s Guide to Concept Testing”
  • 17.
    Learnings & results: “Features”Ad A scored highest and resonated more with target audience Attributes Tested Ad A - features Ad B - benefits Relevance 48% 41% Quality 28% 14% Uniqueness 19% 15% Clarity 55% 49% Believability 25% 16% Likeability 50% 40% Attributes Tested Ad A - features Ad B - benefits Convincing 51% 38% Confusing 13% 15% Irritating 17% 33% Unique 35% 34% Memorable 40% 36% n = 309Statistically significant
  • 18.
    Learnings & results: “Features”Ad A scored highest and resonated more with target audience Ad A - Features Save money/time Tips on testing concepts More convincing, direct, factual Too basic Unclear Ad B - Benefits Save money/time Tips on testing concepts Too salesy Too colloquial Too negative Not believable Free alternatives
  • 19.
    Learnings & results: Usequalitative feedback to ideate new ads that target buyers explicitly told us they’d be receptive to Explicit DataImplicit Data + Improved ad: +43% CTR =
  • 20.
    Learnings & results: Conductbuyer persona research; honor buyer sophistication +43% click-through rate
  • 21.
    Takeaway: Set up anad testing framework 1 Know your ideal customer 2 Find messages that resonate 4 Measure, iterate & refine 3 Reach them at scale
  • 22.
    TOP OF THEFUNNEL Experiment #2: Drive more relevance at scale for your prospects
  • 23.
    Observation: Did not havea method of scaling relevance of SEM landing pages for our vast variety of use cases
  • 24.
    Hypothesis: Dynamically inserting headertext on landing pages that matched search keyword intent would increase sign-up rate Test: dynamic header text: “Polls” Control: static header text Survey-related terms Test: dynamic header text: “Questionnaires”
  • 25.
    Learnings & results Testmore relevant landing page copy +92% sign-up rate
  • 26.
    Takeaway: Leverage dynamic keywordinsertion to match search terms Test dynamic keyword insertion Create a single variant landing page Spectrum of sophistication
  • 27.
    MIDDLE OF THEFUNNEL Experiment #3: The form dilemma, so many experiments!
  • 28.
    Observation: Forms submissions aresynonymous with leads. Our goal as demand gen marketers is to drive people to complete a form.
  • 29.
    Warning: Be very thoughtfulabout how you optimize forms because you create a data/conversion tradeoff. Form A - Fewer form fields - High conversion rate - Low data quality Form B - More form fields, - Low conversion rate - Higher data quality
  • 30.
    Advice: Use third partydata providers to enrich your lead data (especially when you experiment and remove fields). Data Enrichment providers we like: - DemandBase - ClearBit - StrikeIron
  • 31.
    BOTTOM OF THEFUNNEL Experiment #4: Mitigate churn of at-risk customers
  • 32.
    Observation: Messages to customersat risk to churn are primarily billing-focused, not value & utility-focused
  • 33.
    Hypothesis: Re-engaging at-risk customerswith email & in-product nudges, rather than billing notices alone, will increase renewal rate Control: billing noticeTest: value driven re-engagement messaging
  • 34.
    Test: Re-engagement banner Control: Billing page Test: Re-engagementpop up Hypothesis: Re-engaging at-risk customers with email & in-product nudges, rather than billing notices alone, will increase renewals
  • 35.
    Learnings & results Leadwith value proposition before loss threat +344% auto-renew “on” rate
  • 36.
    Takeaway: Define “a ha!”moment of product and work to repeat that Timely email Sequenced, omni-channelSpectrum of sophistication
  • 37.
    Specific experiments forthe Lead Lifecycle A/B pre-test ads before launch Dynamic keyword insertion Form length Churn mitigation
  • 38.
    What now? Goforth and experiment. 1. Choose a stage in the lead lifecycle that needs attention. 2. Choose the metric you want to optimize. 3. Create hypotheses on how to move that metric. 4. Prioritize the experiment-based on potential ROI and cost. 5. Run experiment(s)! 6. Measure impact on your primary metric. 7. Plan iterative tests.
  • 39.
    @surveymonkey surveymonkey.com/business audience.surveymonkey.com Question time withCara and Aliza. @caraharshman optimizely.com/get-started
  • 40.