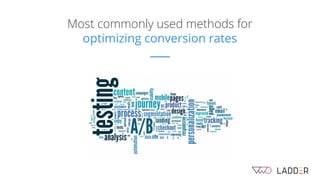
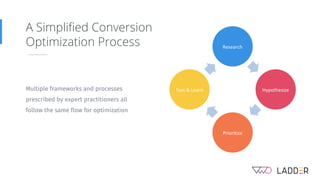
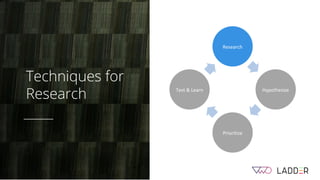
How To Build A Winning Conversion
Optimization Strategy
Srikant Kotapalli
Head of Product, VWO
Missy McCabe
Growth Marketer, Ladder.io
Ask Questions on Twitter
#AskVWO
About VWO
powered by SmartStats
2.5bn+
Users served per
month
Goals FunnelsTrack
Heatmaps Recordings Surveys FormsAnalyze
Test
Plan HypothesisObservation
5000+
Customers across
the globe
600k+
Experiments run on
our platform
91Countries
A/B Testing &
Conversion
Optimization
Platform
About Ladder.io
$25m+
Performance data
300%+
Market avg. success
rate for
experiments
5000+
Growth tactics
launched
Digital
Marketing
Agency
Ladder is a growth marketing agency that uses
proprietary technology and data-driven strategy to
increase your ROI.
Our team has spent millions of dollars and thousands of
hours working with over 100 companies in New York and
London.
Most commonly used methods for
optimizing conversion rates
What is A/B testing
In the most simplest form, A/B
Testing is comparing two versions
of a web page to see which
version performs better for a
defined conversion goal
A Simplified Conversion
Optimization Process
Multiple frameworks and processes
prescribed by expert practitioners all
follow the same flow for optimization
Research
Hypothesize
Prioritize
Test & Learn
Tools & Techniques
r
How many tools do you use for conversion optimization?
Conversion optimization requires
considerable expertise
with multiple
tools throughout the process
Techniques for
Research
Research
Hypothesize
Prioritize
Test & Learn
r
Most commonly used methods to generate User insights
Difficulty in generating insightsDifficult Easy
Valueofinsights
Low
High
*Size of the bubble indicates the popularity or usage of the method
Heuristic Analysis
Evaluation of a website by
a usability expert against a
set heuristics to identify
potential conversion
barriers
Heatmap
Navigation bar distracting
users from the primary
goal of this page which is
to download the app
Scrollmap
A sharp drop-off of 40
%age points happens here
and content below this is
going to be ineffective.
Also acts as a in page
funnel representation
98% (103) views
58% (61) views
Session Replays
Session replays playback
your visitors actual page
interactions and how they
navigate through your
website without
distracting the visitor from
their desired goals
98% (103) views
58% (61) views
Surveys
Understanding Word of
mouth effect on your
direct traffic
98% (103) views
58% (61) views
Surveys
Understanding why
visitors abandon your
site
98% (103) views
58% (61) views
Form Analytics
Go beyond tracking form
submission rates. Form
analytics help you
understand how visitors
interact with every form
field. It gives you insights
on where visitors hesitate
and drop off
98% (103) views
58% (61) views
27%
34%
of the visitors
submitted the form
20.5
seconds
Total time spent on
completing this field
10.3
seconds
Time spent by
visitors hesitating to
give this data
20%
of the visitors drop
off on this field
of the visitors refill
this field
Usability Testing
Task Analysis or usability
testing helps you evaluate
how visitors would use the
website to achieve a
desired goal.
98% (103) views
58% (61) views
Card Sorting
Helps you understand
how your visitors would
logically group
information into
categories.
98% (103) views
58% (61) views
Clear winners
Ambiguous
classification,
might need
follow up
tests
Tests run using Optimal workshop
Building
structured
Hypothesis
Research
Hypothesize
Prioritize
Test & Learn
Five Second test
Helps you understand
how visitors perceive your
messaging
98% (103) views
58% (61) views
What solution are they selling?
Tests run using Usabilityhub
Build a structured Hypothesis
Based on Observations
I believe Solution
will address Problem
for Audience
and impact Goal by uplift %
Evidence or
Research that
identifies a pattern
or a problem that
needs solving
If you are just starting
to test, then Audience
is probably all visitors.
But as you mature in
optimization your
audience is a subset Brings in
accountability on
what your team was
trying to achieve
Prioritizing
Hypothesis
Research
Hypothesize
Prioritize
Test & Learn
r
What %age of ideas do you test from your backlog?
There are always more
ideas than you can actually
test. Prioritizationof
which ideas to test is essential
Frameworks to prioritize Hypothesis
Potential
Importance
Ease
Time
Impact
Resources
Bryan
Eisenberg
Impact
Confidence
Ease
Sean Ellis
PXL model
by by by by
What we use
Confidence Importance Ease
How confident are you of
achieving the uplift in
conversion rates from this
test?
How valuable are the
audience you are testing
for?
How Easy is it implement
this test?
Generally higher confidence
can be achieved with high
level of research
Not just effort for design
and dev, but also take into
account how easy is it to get
all stakeholders to agree to
doing this
For example a test
conducted on bottom of
the funnel could be more
important than a test on
top of the funnel
ANALYZE YOUR FUNNEL
What to look for without getting “analysis paralysis”
● Lead gen?
● Revenue for e-commerce?
● A tight tracking set-up and knowledge of your
funnel is key to any CRO strategy
What metrics matter to you?
Finding the largest area of opportunity
YOUR CRO ANALYSIS CHECKLIST:
1. Analyze your full funnel for
key areas of drop off
2. Where does most of your
traffic come from and where
do most people land?
3. Split traffic by device - what
is your conversion rate on
mobile vs. desktop?
Full funnel analysis
Identify key pages
Desktop vs. mobile behavior
A/B testing best practices
Testing for B2B lead generation
A/B testing above the fold - social proof
A/B testing above the fold
A/B testing form fields
Metric for success: Leads
generated
Hypothesis:
Including fewer form fields
will boost our conversion
rate, as it reduces friction.
Result:
10% lift in CVR on this variant
Social proof
Metric for success: Leads
generated
Hypothesis:
Moving client logos from the very
bottom of our site to a prominent
spot above the fold will increase
conversions on our contact form,
as strong social proof legitimizes
us.
Result:
65% lift in CVR
Positive reviews
Metric for success: Leads
generated
Hypothesis:
Moving positive reviews from
Shopper Approved above the
fold would increase conversion
rate, as it adds a sense that we
are trusted by customers.
Result:
17% lift in CVR
A/B testing for e-commerce
GA Shopping Behavior Analysis
Dynamic free shipping bar
Implementation tools: Free Shipping Bar
by Hextom for Shopify, or other plugin
VWO installation: Install the plugin within
your site. In order to run the A/B test,
your developer can write a line of code to
show or hide the shipping bar to measure
conversion rate with and without it
displaying.
Metric for success: average order value
Hypothesis: Adding a free shipping bar
that updates as a user puts items in their
basket will increase average order value,
as it incentivizes spending to the limit
needed to achieve free shipping.
Urgency language
Urgency language
Metric for success: adds to cart
Hypothesis: Removing language
around items being low in stock
will boost conversion rate, as the
current display of that language
makes it appear as though
products are unavailable.
Result: decrease in CVR -- and the
learning that urgency language is
actually a positive for client
Social proof
Implementation tools: fomo or
proof
VWO installation: Install the
plugin within your site. In
order to run the A/B test, your
developer can write a line of
code to show or hide Fomo on
either variant.
Metric for success: Checkouts
completed (can also be used
for B2B lead gen businesses)
SEGMENTATION BY DEVICE:
Desktop vs. Mobile traffic
Optimize for mobile
Optimize for mobile
TESTING ON LOW TRAFFIC SITES
Set realistic metrics for success
Set mid-funnel goals
● Traffic: 3,000 monthly site
sessions
● Conversion rate: 1% conversion
rate.
● Adds to cart: 4%
● Views to collections page: 50%
Statistical significance
1% to 1.7% CVR
to purchase
50% to 53% to
collections
page
Goal: Purchases
Goal: collections page view
Page overhaul
Page overhaul
Thank You!
Q&A

How To Build a Winning Conversion Optimization Strategy

  • 1.
    How To BuildA Winning Conversion Optimization Strategy Srikant Kotapalli Head of Product, VWO Missy McCabe Growth Marketer, Ladder.io
  • 2.
    Ask Questions onTwitter #AskVWO
  • 3.
    About VWO powered bySmartStats 2.5bn+ Users served per month Goals FunnelsTrack Heatmaps Recordings Surveys FormsAnalyze Test Plan HypothesisObservation 5000+ Customers across the globe 600k+ Experiments run on our platform 91Countries A/B Testing & Conversion Optimization Platform
  • 4.
    About Ladder.io $25m+ Performance data 300%+ Marketavg. success rate for experiments 5000+ Growth tactics launched Digital Marketing Agency Ladder is a growth marketing agency that uses proprietary technology and data-driven strategy to increase your ROI. Our team has spent millions of dollars and thousands of hours working with over 100 companies in New York and London.
  • 5.
    Most commonly usedmethods for optimizing conversion rates
  • 6.
    What is A/Btesting In the most simplest form, A/B Testing is comparing two versions of a web page to see which version performs better for a defined conversion goal
  • 7.
    A Simplified Conversion OptimizationProcess Multiple frameworks and processes prescribed by expert practitioners all follow the same flow for optimization Research Hypothesize Prioritize Test & Learn
  • 8.
  • 9.
    r How many toolsdo you use for conversion optimization? Conversion optimization requires considerable expertise with multiple tools throughout the process
  • 10.
  • 11.
    r Most commonly usedmethods to generate User insights Difficulty in generating insightsDifficult Easy Valueofinsights Low High *Size of the bubble indicates the popularity or usage of the method
  • 12.
    Heuristic Analysis Evaluation ofa website by a usability expert against a set heuristics to identify potential conversion barriers
  • 13.
    Heatmap Navigation bar distracting usersfrom the primary goal of this page which is to download the app
  • 14.
    Scrollmap A sharp drop-offof 40 %age points happens here and content below this is going to be ineffective. Also acts as a in page funnel representation 98% (103) views 58% (61) views
  • 15.
    Session Replays Session replaysplayback your visitors actual page interactions and how they navigate through your website without distracting the visitor from their desired goals 98% (103) views 58% (61) views
  • 16.
    Surveys Understanding Word of moutheffect on your direct traffic 98% (103) views 58% (61) views
  • 17.
    Surveys Understanding why visitors abandonyour site 98% (103) views 58% (61) views
  • 18.
    Form Analytics Go beyondtracking form submission rates. Form analytics help you understand how visitors interact with every form field. It gives you insights on where visitors hesitate and drop off 98% (103) views 58% (61) views 27% 34% of the visitors submitted the form 20.5 seconds Total time spent on completing this field 10.3 seconds Time spent by visitors hesitating to give this data 20% of the visitors drop off on this field of the visitors refill this field
  • 19.
    Usability Testing Task Analysisor usability testing helps you evaluate how visitors would use the website to achieve a desired goal. 98% (103) views 58% (61) views
  • 20.
    Card Sorting Helps youunderstand how your visitors would logically group information into categories. 98% (103) views 58% (61) views Clear winners Ambiguous classification, might need follow up tests Tests run using Optimal workshop
  • 21.
  • 22.
    Five Second test Helpsyou understand how visitors perceive your messaging 98% (103) views 58% (61) views What solution are they selling? Tests run using Usabilityhub
  • 23.
    Build a structuredHypothesis Based on Observations I believe Solution will address Problem for Audience and impact Goal by uplift % Evidence or Research that identifies a pattern or a problem that needs solving If you are just starting to test, then Audience is probably all visitors. But as you mature in optimization your audience is a subset Brings in accountability on what your team was trying to achieve
  • 24.
  • 25.
    r What %age ofideas do you test from your backlog? There are always more ideas than you can actually test. Prioritizationof which ideas to test is essential
  • 26.
    Frameworks to prioritizeHypothesis Potential Importance Ease Time Impact Resources Bryan Eisenberg Impact Confidence Ease Sean Ellis PXL model by by by by
  • 27.
    What we use ConfidenceImportance Ease How confident are you of achieving the uplift in conversion rates from this test? How valuable are the audience you are testing for? How Easy is it implement this test? Generally higher confidence can be achieved with high level of research Not just effort for design and dev, but also take into account how easy is it to get all stakeholders to agree to doing this For example a test conducted on bottom of the funnel could be more important than a test on top of the funnel
  • 28.
    ANALYZE YOUR FUNNEL Whatto look for without getting “analysis paralysis”
  • 29.
    ● Lead gen? ●Revenue for e-commerce? ● A tight tracking set-up and knowledge of your funnel is key to any CRO strategy What metrics matter to you?
  • 30.
    Finding the largestarea of opportunity YOUR CRO ANALYSIS CHECKLIST: 1. Analyze your full funnel for key areas of drop off 2. Where does most of your traffic come from and where do most people land? 3. Split traffic by device - what is your conversion rate on mobile vs. desktop?
  • 31.
  • 32.
  • 33.
  • 34.
    A/B testing bestpractices Testing for B2B lead generation
  • 35.
    A/B testing abovethe fold - social proof
  • 36.
  • 37.
  • 38.
    A/B testing formfields Metric for success: Leads generated Hypothesis: Including fewer form fields will boost our conversion rate, as it reduces friction. Result: 10% lift in CVR on this variant
  • 39.
    Social proof Metric forsuccess: Leads generated Hypothesis: Moving client logos from the very bottom of our site to a prominent spot above the fold will increase conversions on our contact form, as strong social proof legitimizes us. Result: 65% lift in CVR
  • 40.
    Positive reviews Metric forsuccess: Leads generated Hypothesis: Moving positive reviews from Shopper Approved above the fold would increase conversion rate, as it adds a sense that we are trusted by customers. Result: 17% lift in CVR
  • 41.
    A/B testing fore-commerce
  • 42.
  • 43.
    Dynamic free shippingbar Implementation tools: Free Shipping Bar by Hextom for Shopify, or other plugin VWO installation: Install the plugin within your site. In order to run the A/B test, your developer can write a line of code to show or hide the shipping bar to measure conversion rate with and without it displaying. Metric for success: average order value Hypothesis: Adding a free shipping bar that updates as a user puts items in their basket will increase average order value, as it incentivizes spending to the limit needed to achieve free shipping.
  • 44.
  • 45.
    Urgency language Metric forsuccess: adds to cart Hypothesis: Removing language around items being low in stock will boost conversion rate, as the current display of that language makes it appear as though products are unavailable. Result: decrease in CVR -- and the learning that urgency language is actually a positive for client
  • 46.
    Social proof Implementation tools:fomo or proof VWO installation: Install the plugin within your site. In order to run the A/B test, your developer can write a line of code to show or hide Fomo on either variant. Metric for success: Checkouts completed (can also be used for B2B lead gen businesses)
  • 47.
  • 48.
  • 49.
  • 50.
    TESTING ON LOWTRAFFIC SITES
  • 51.
    Set realistic metricsfor success Set mid-funnel goals ● Traffic: 3,000 monthly site sessions ● Conversion rate: 1% conversion rate. ● Adds to cart: 4% ● Views to collections page: 50%
  • 52.
    Statistical significance 1% to1.7% CVR to purchase 50% to 53% to collections page Goal: Purchases Goal: collections page view
  • 53.
  • 54.
  • 55.