


![Cost/Revenue
The only difference in drawing
the diagrams for perfect
competition or any other
market structure is the shape P D = MR = AR
of the demand curve(AR)
For perfect competition the Output/Sales
AR=MR is perfectly elastic
Cost/Revenue
whereas for other market
structures the demand curve
(AR] curve is normal i.e. slopes P
downward to the right and the
MR curve is place below the AR D =AR
curve (twice the distance] MR
Output/Sales](https://image.slidesharecdn.com/howtodrawmarketstructurediagrams-121108000741-phpapp02/75/How-to-draw-market-structure-diagrams-8-2048.jpg)
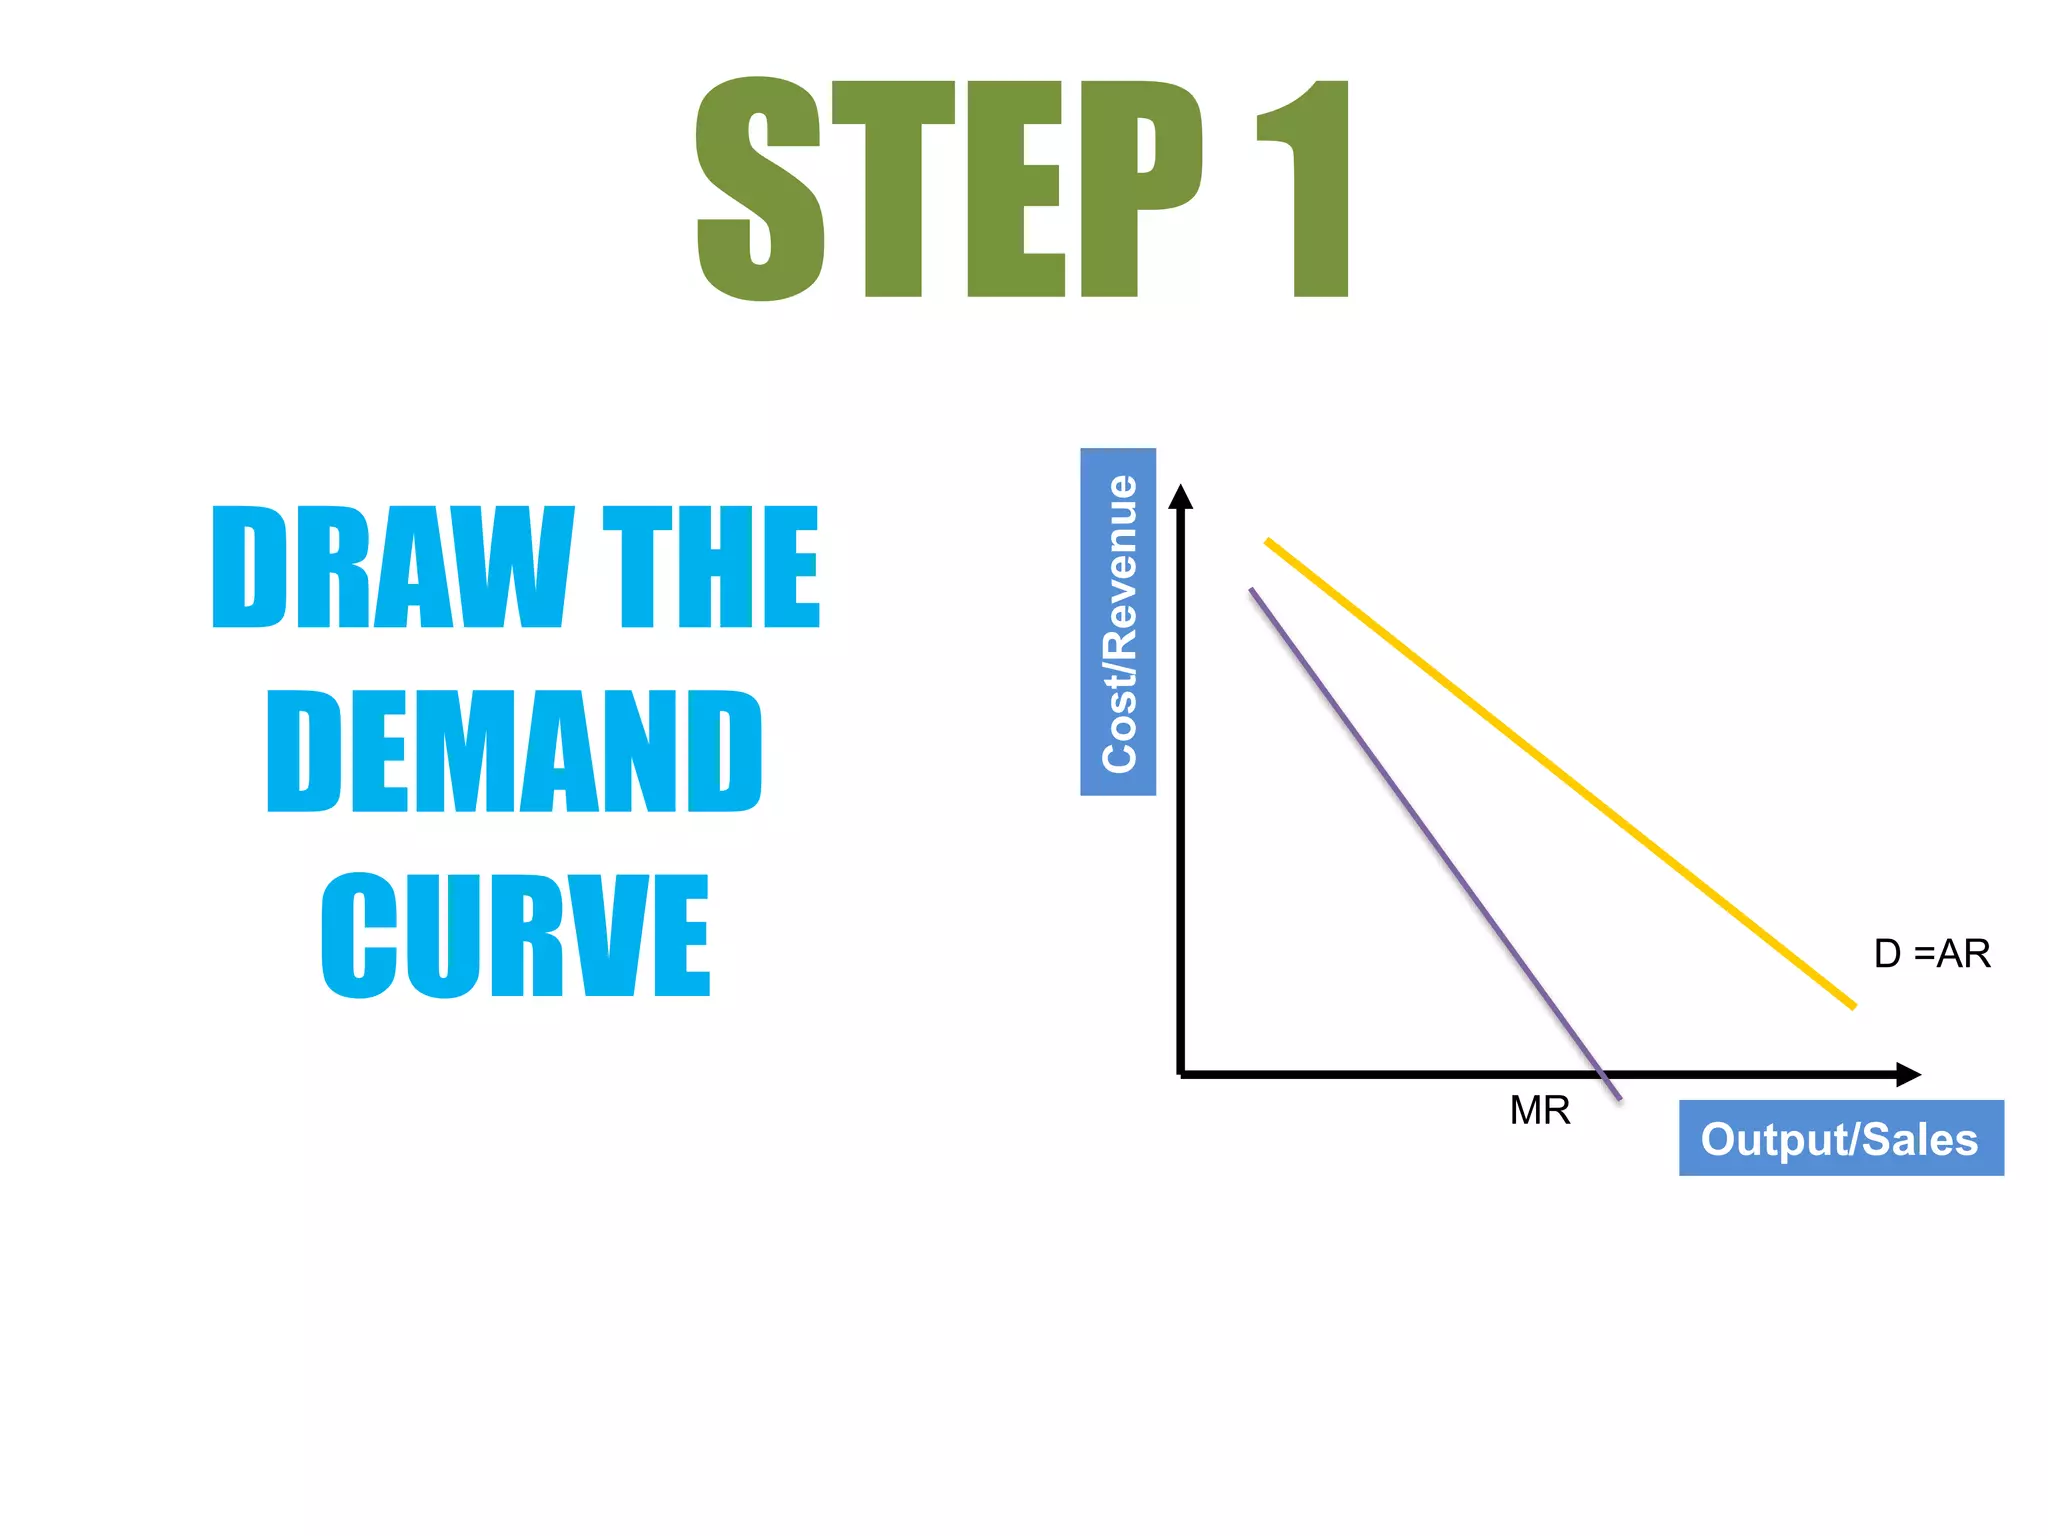
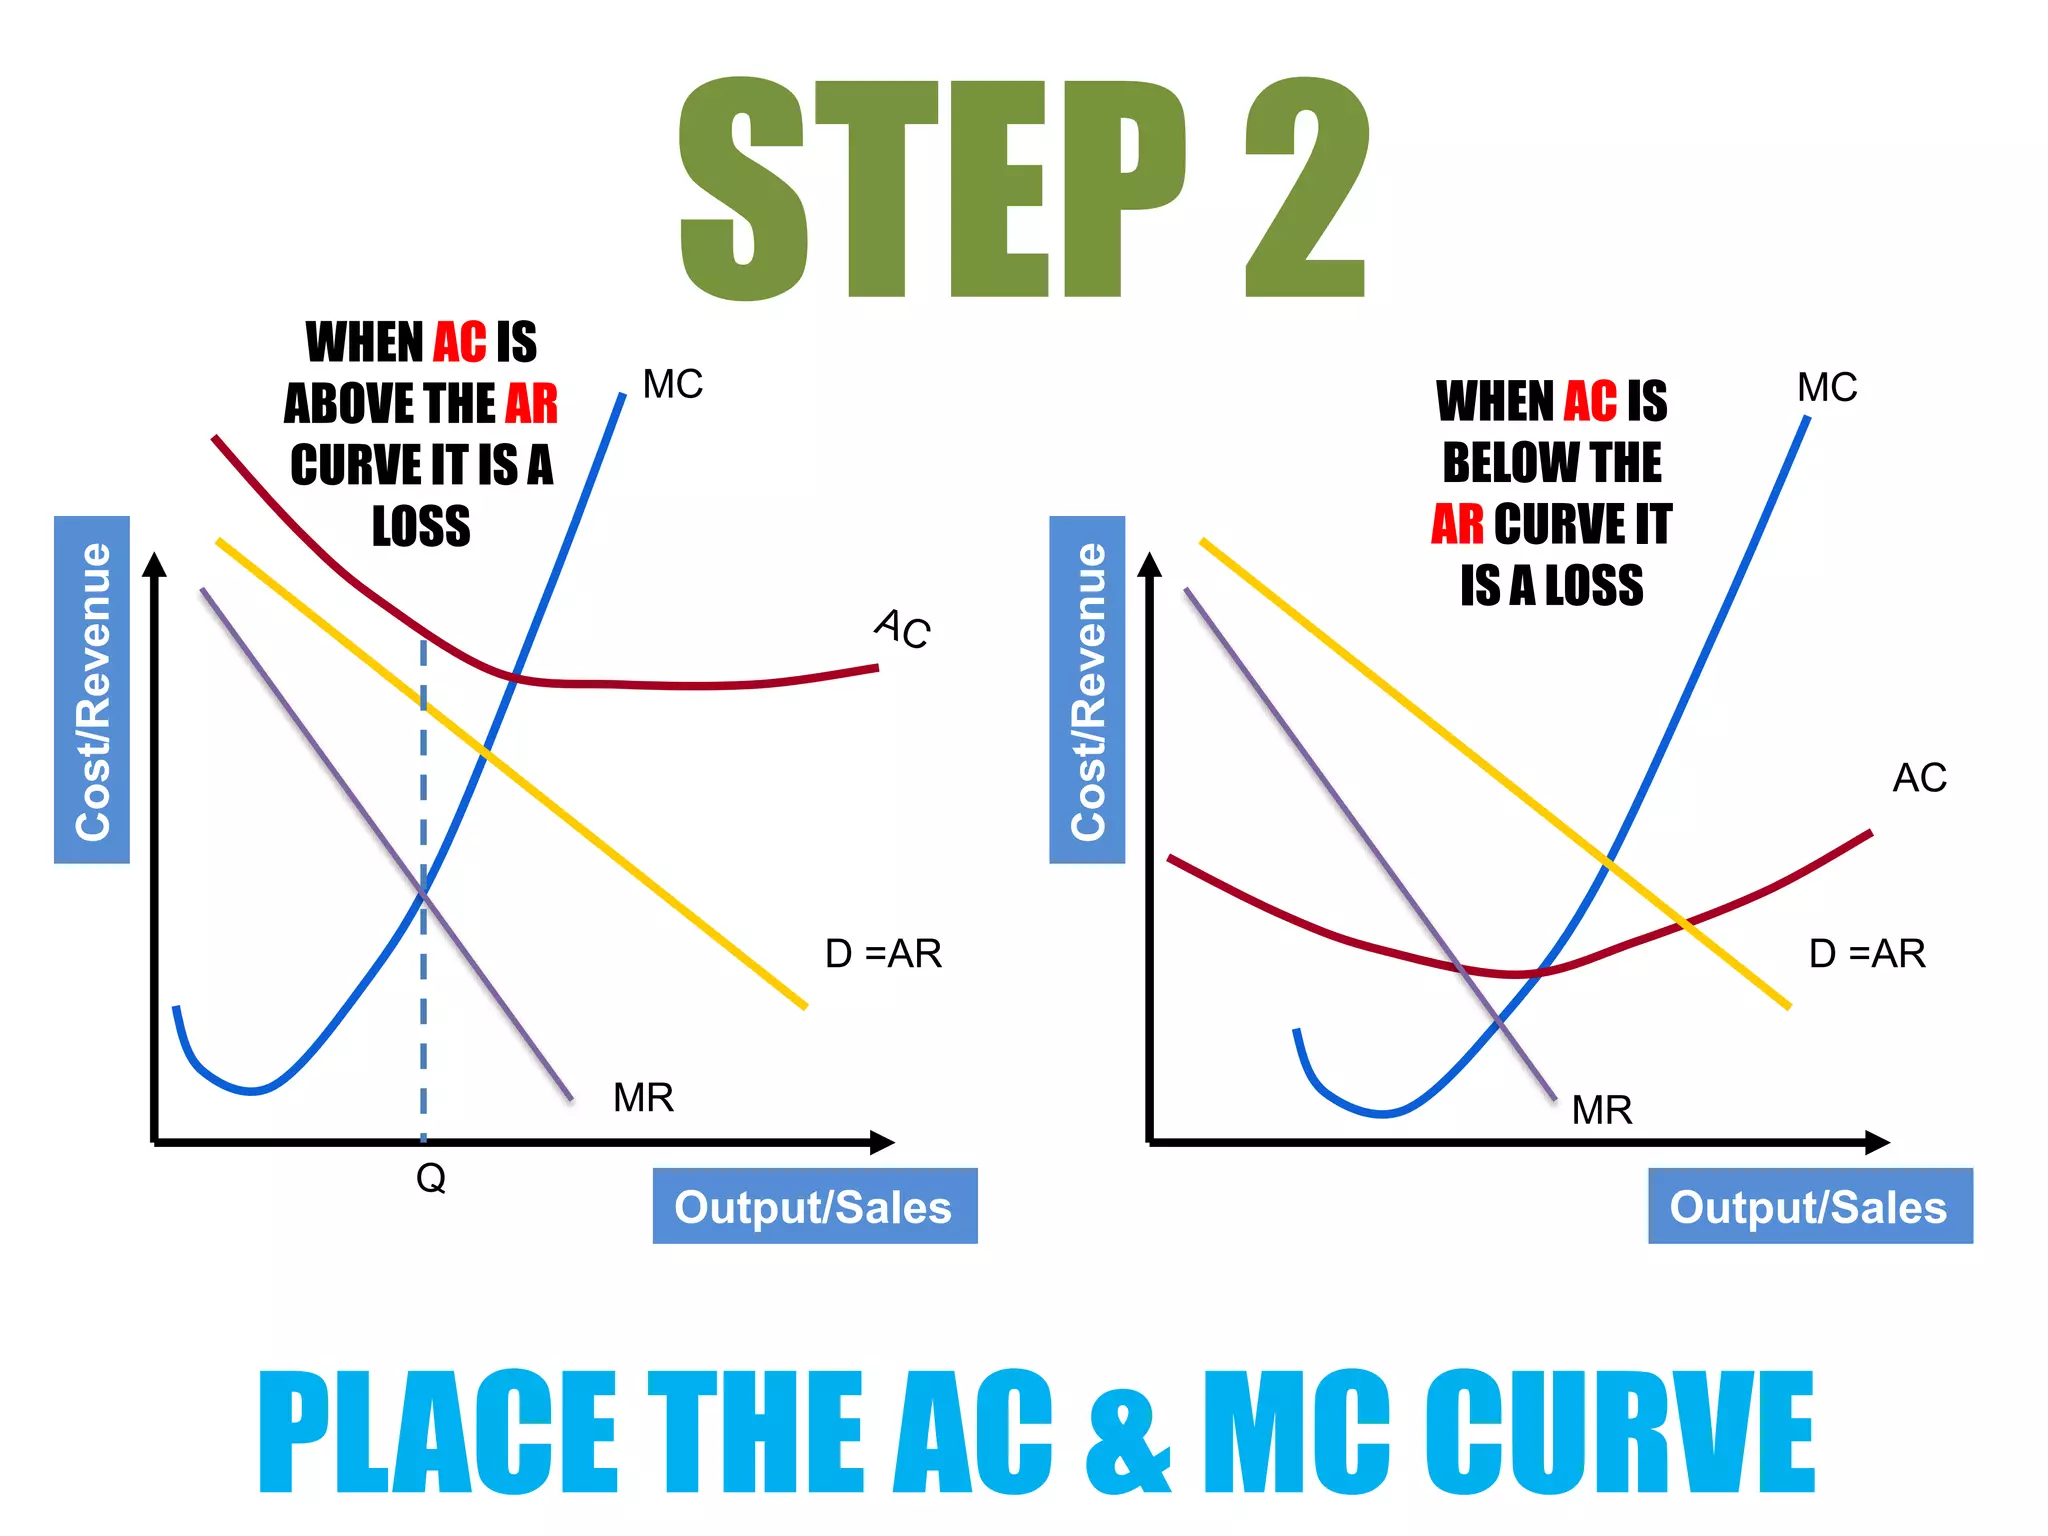
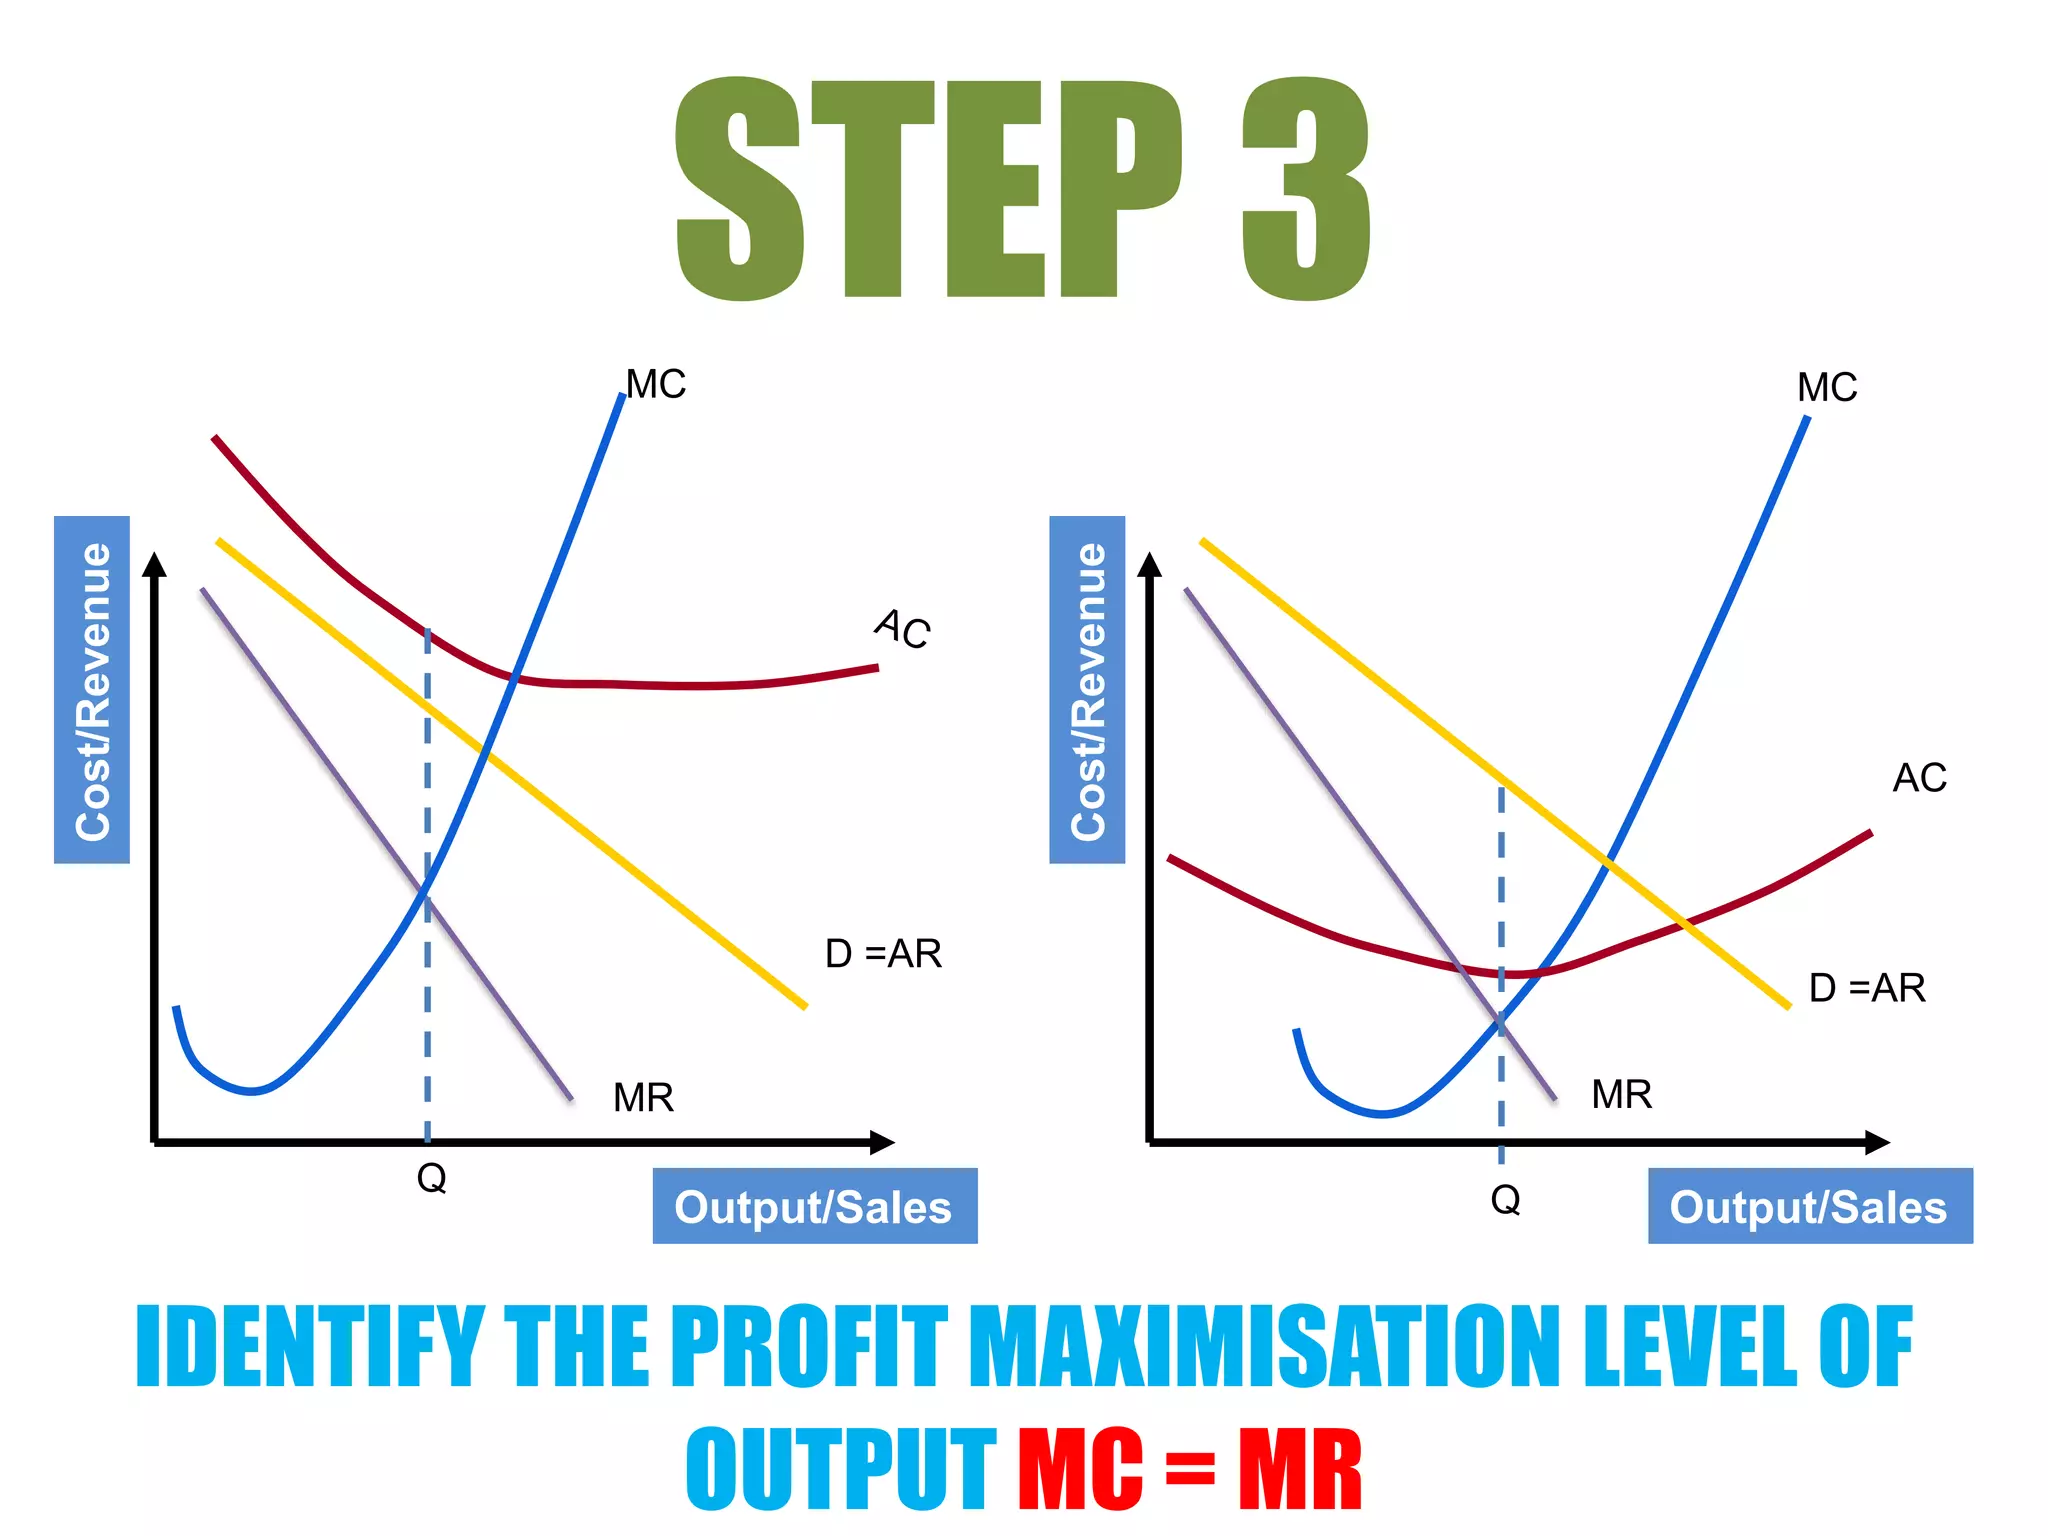
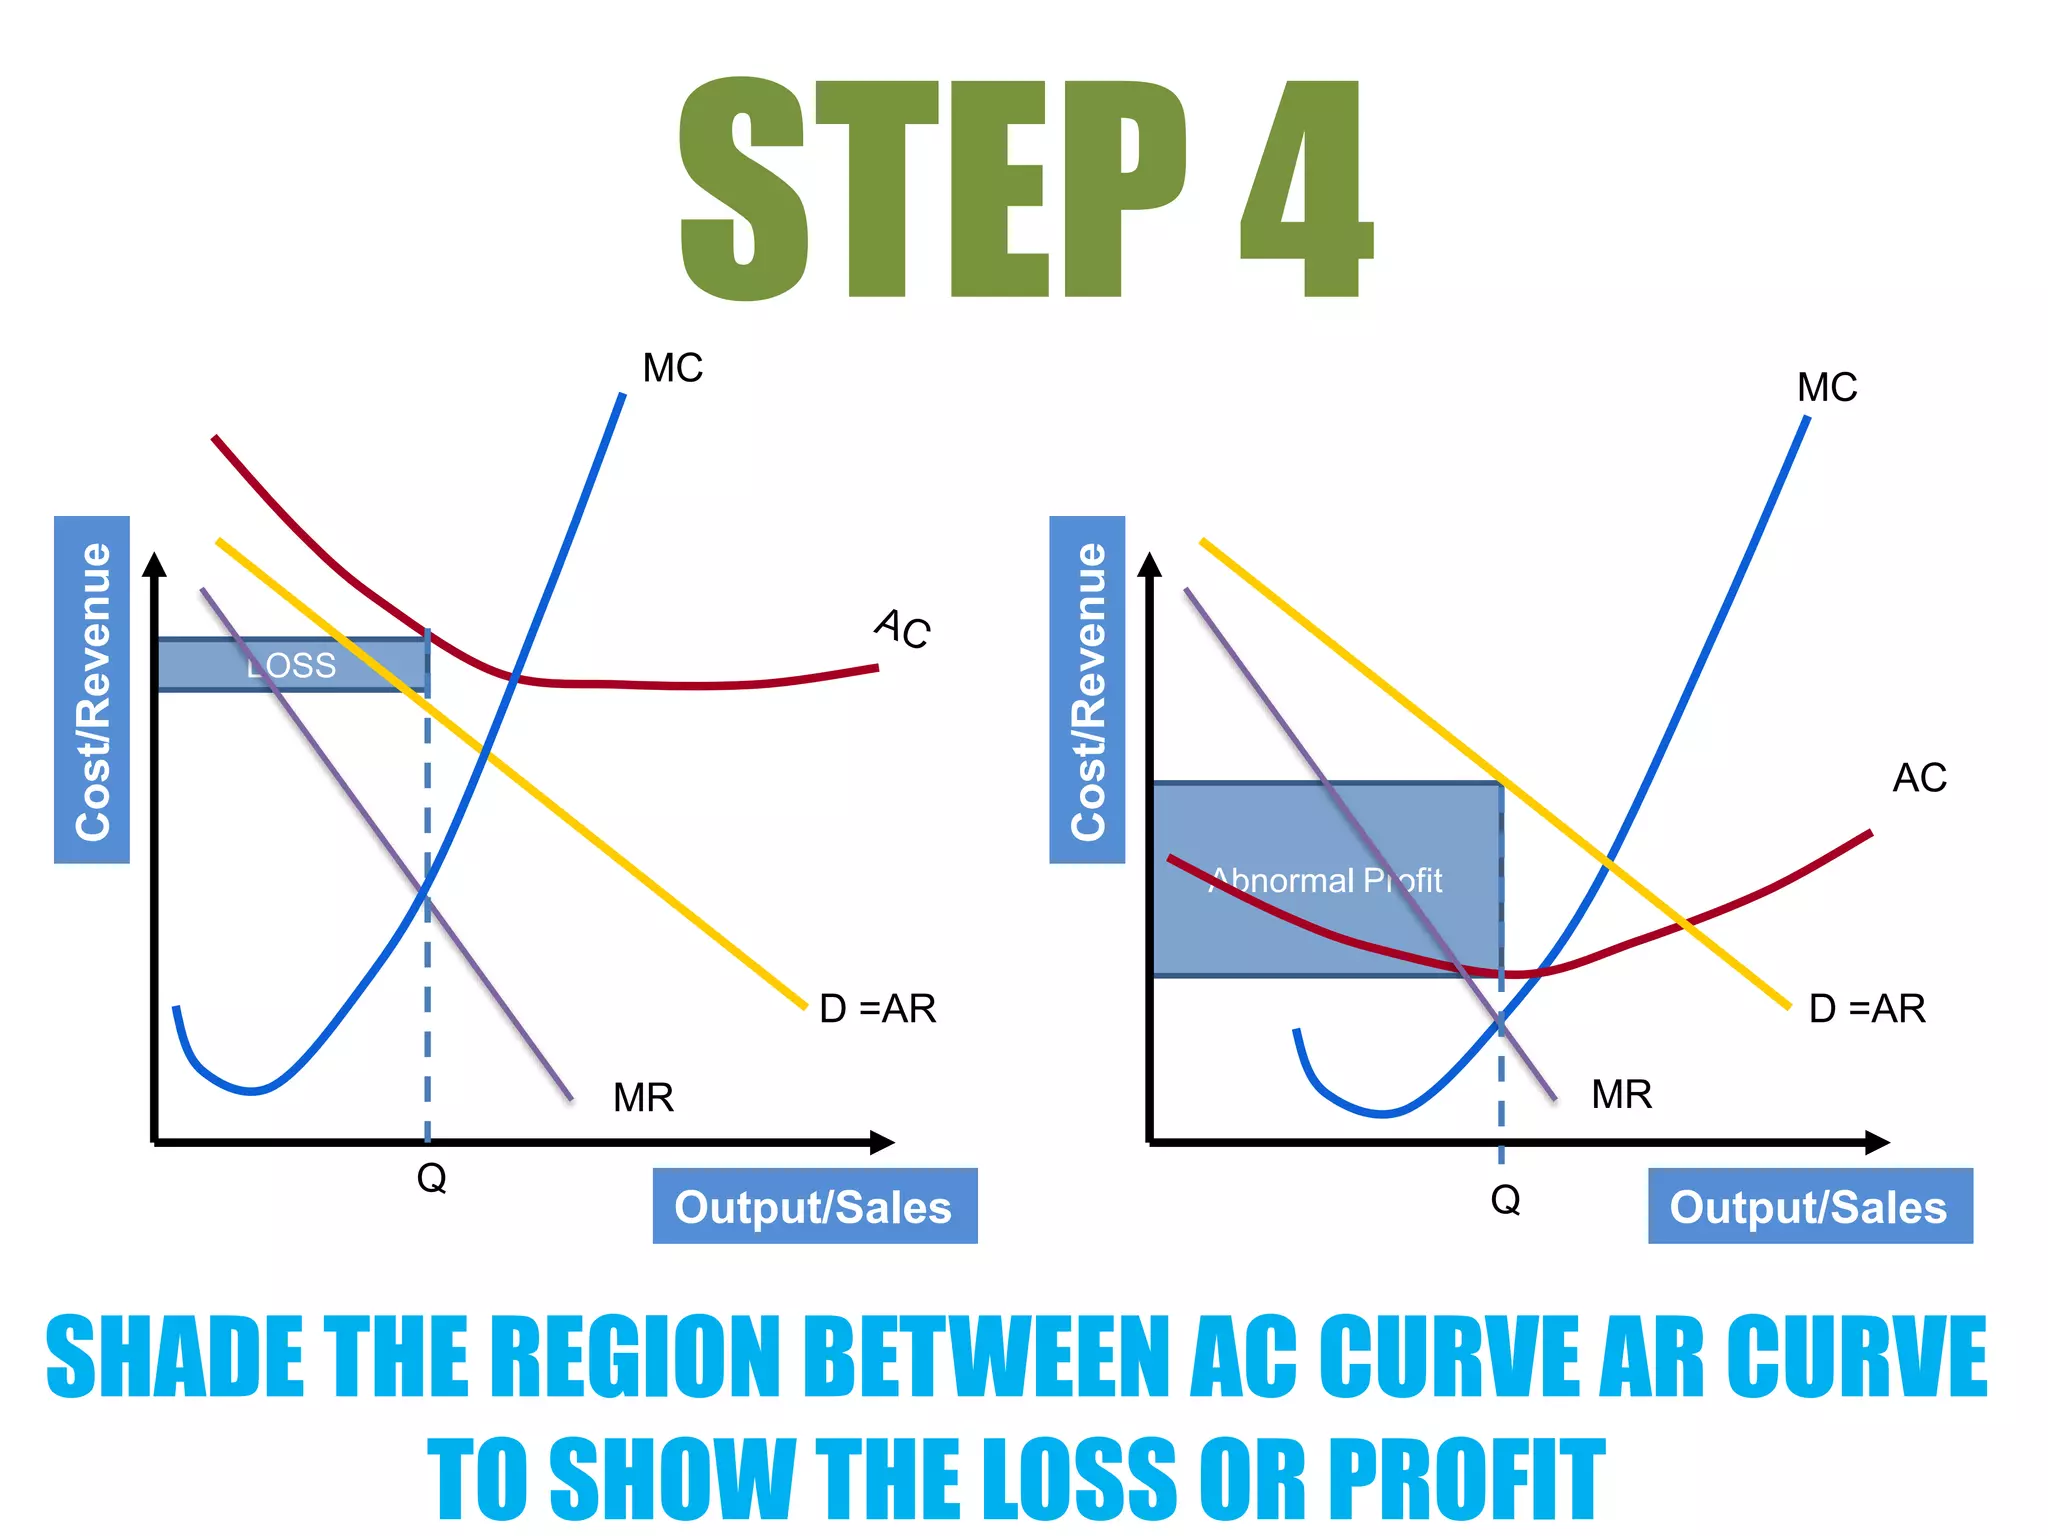


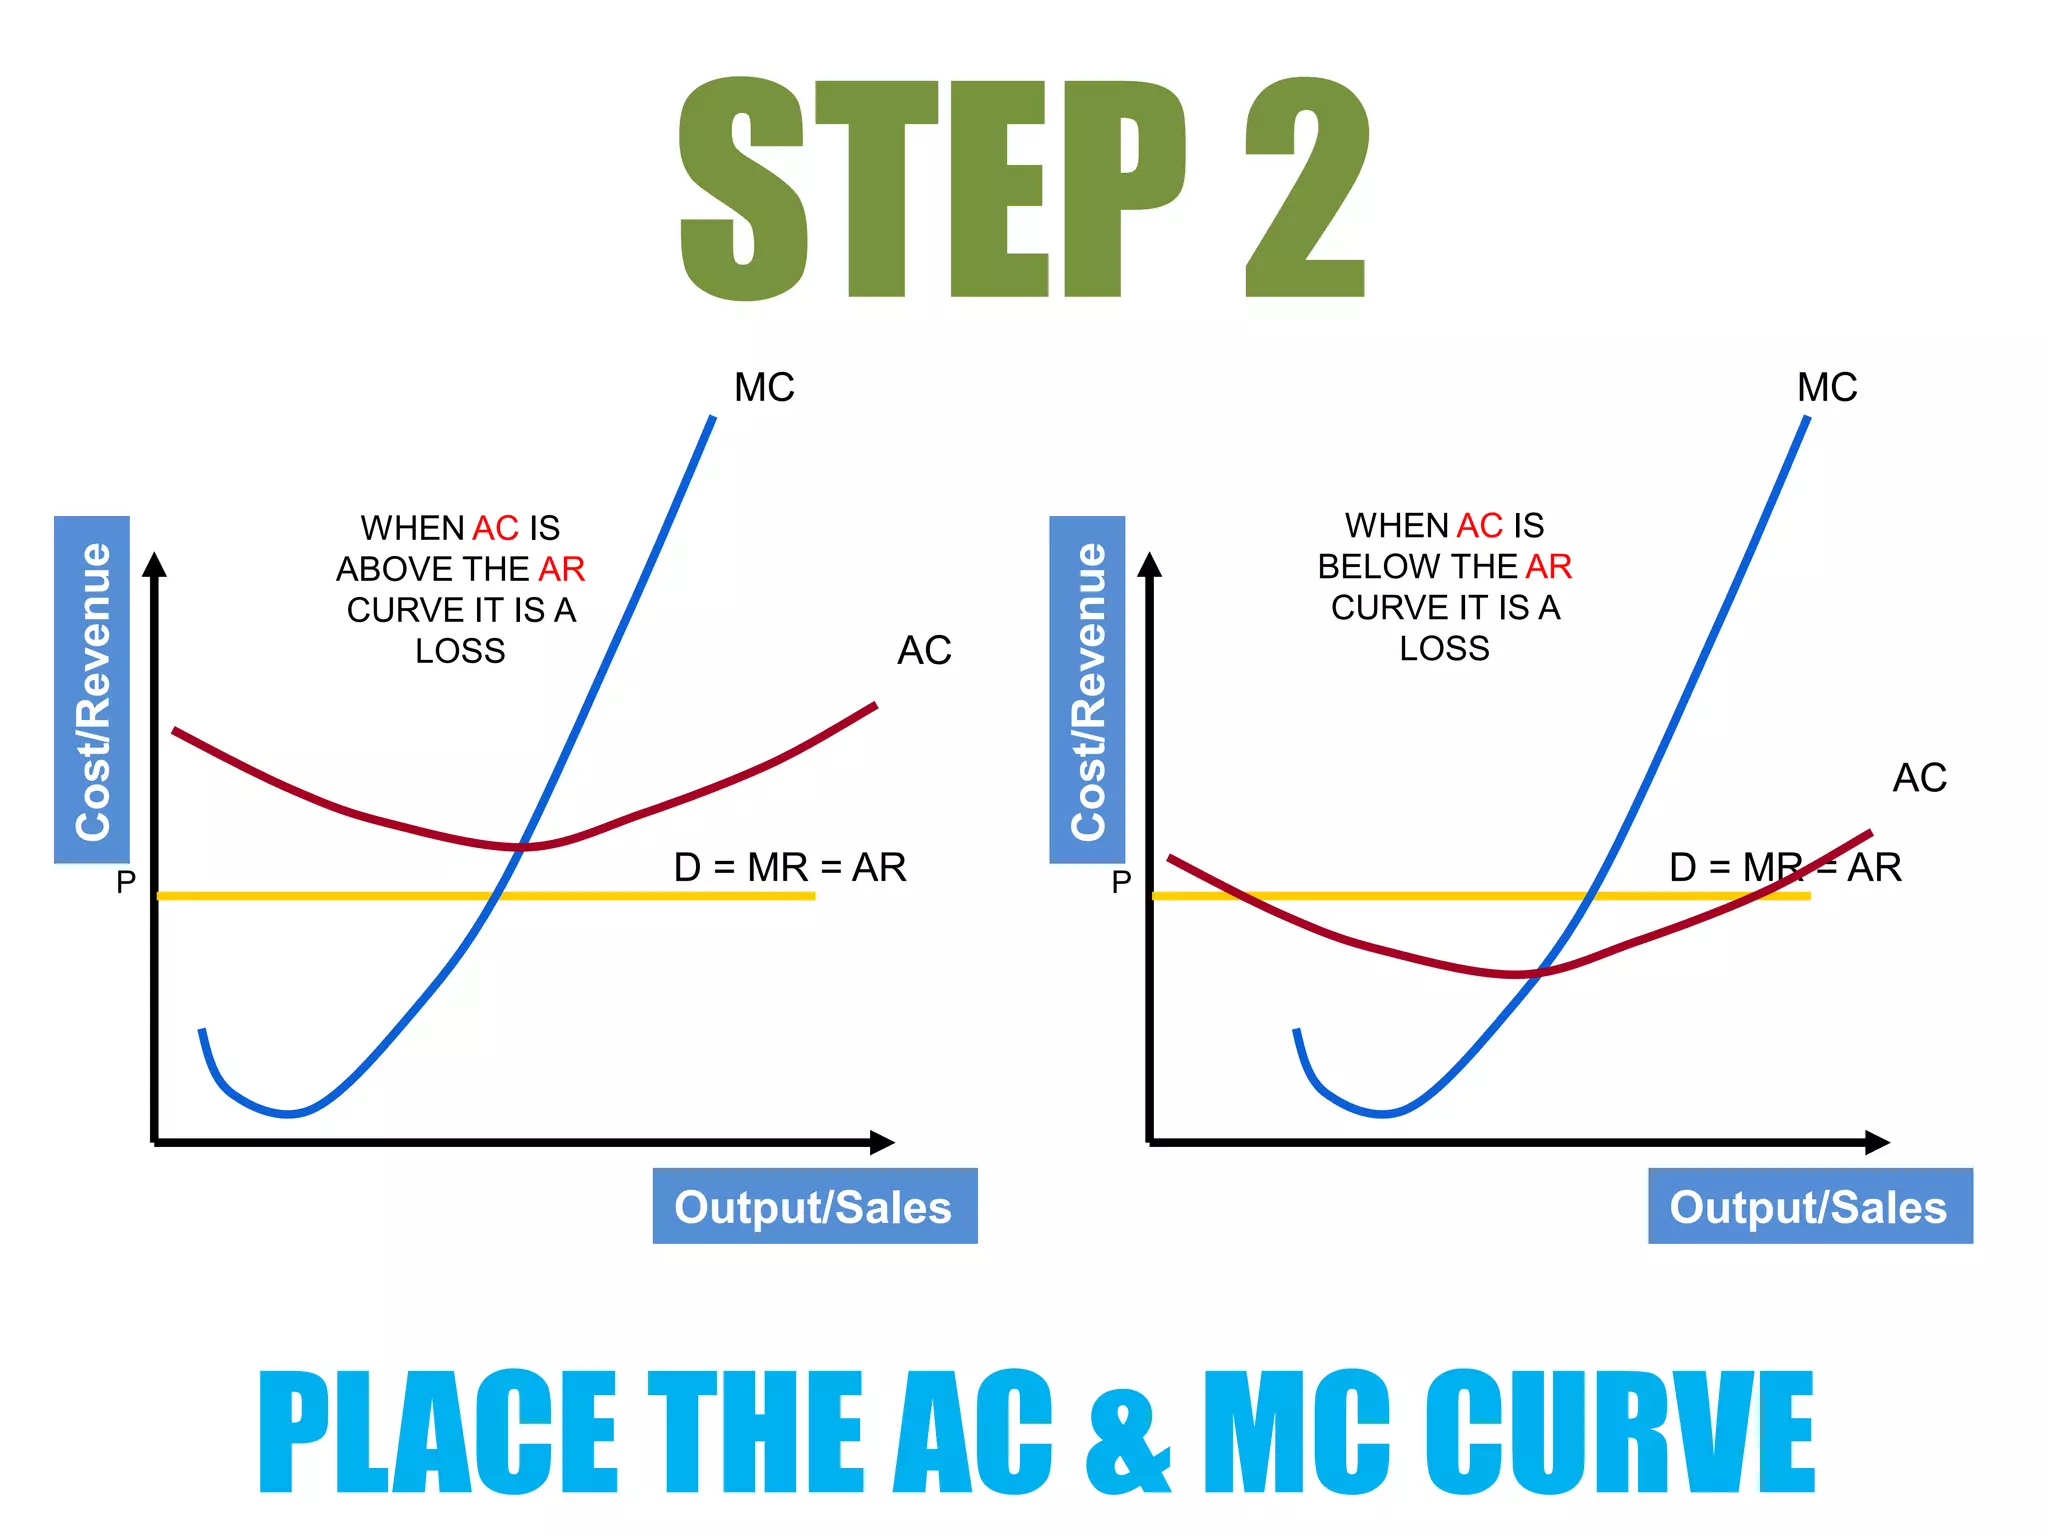
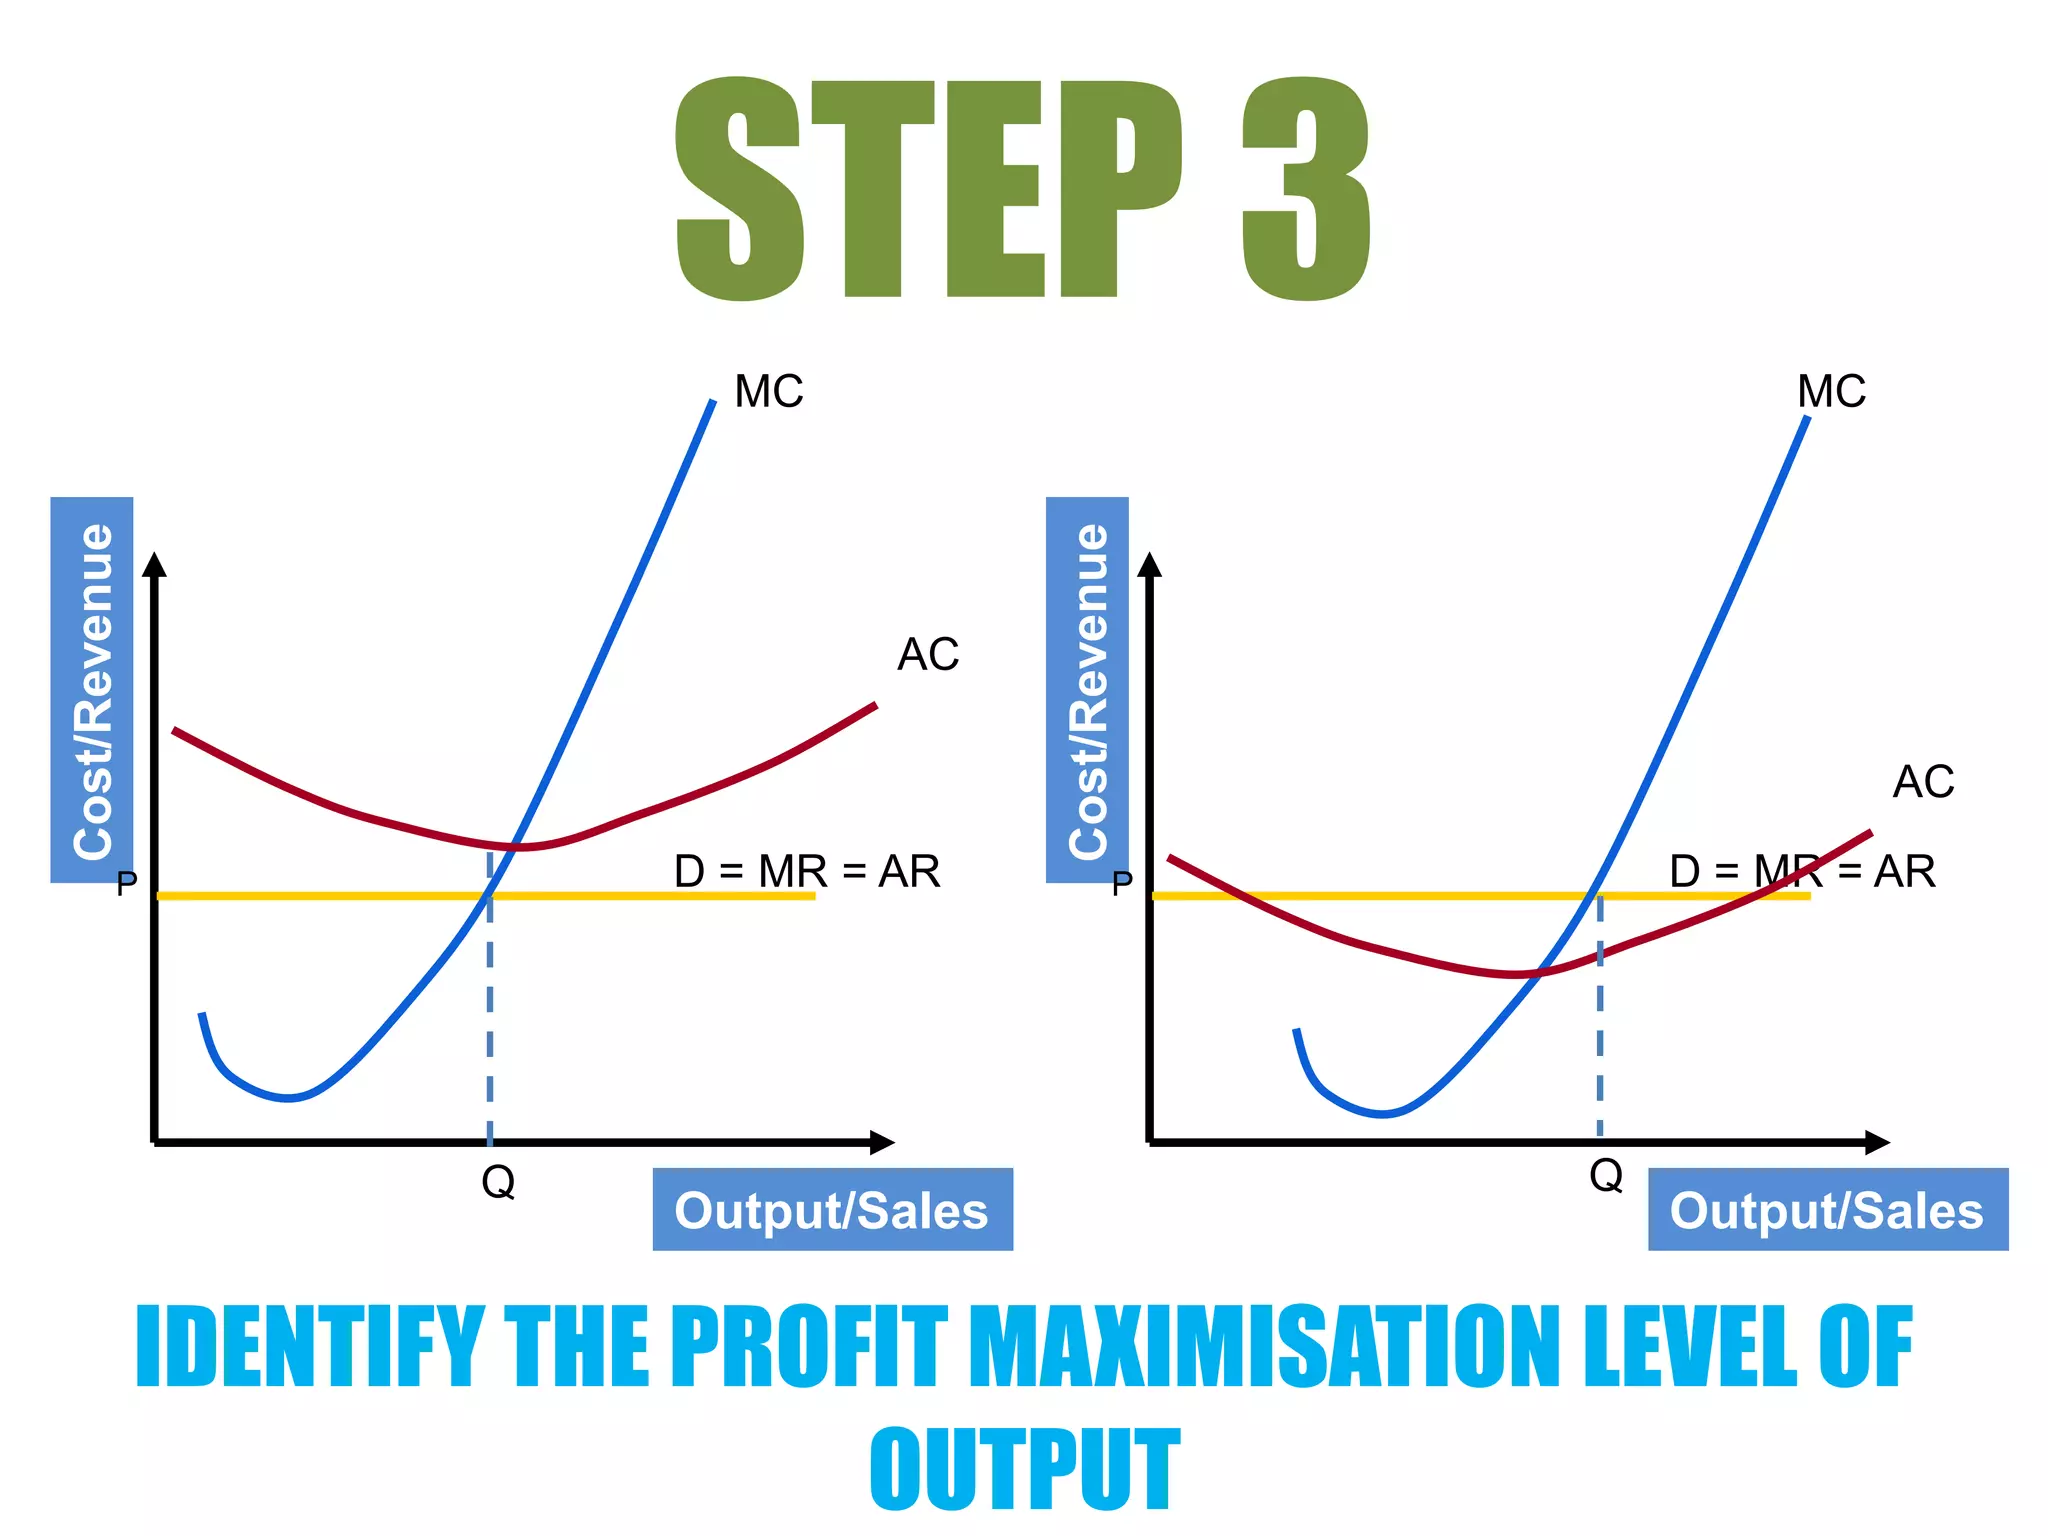
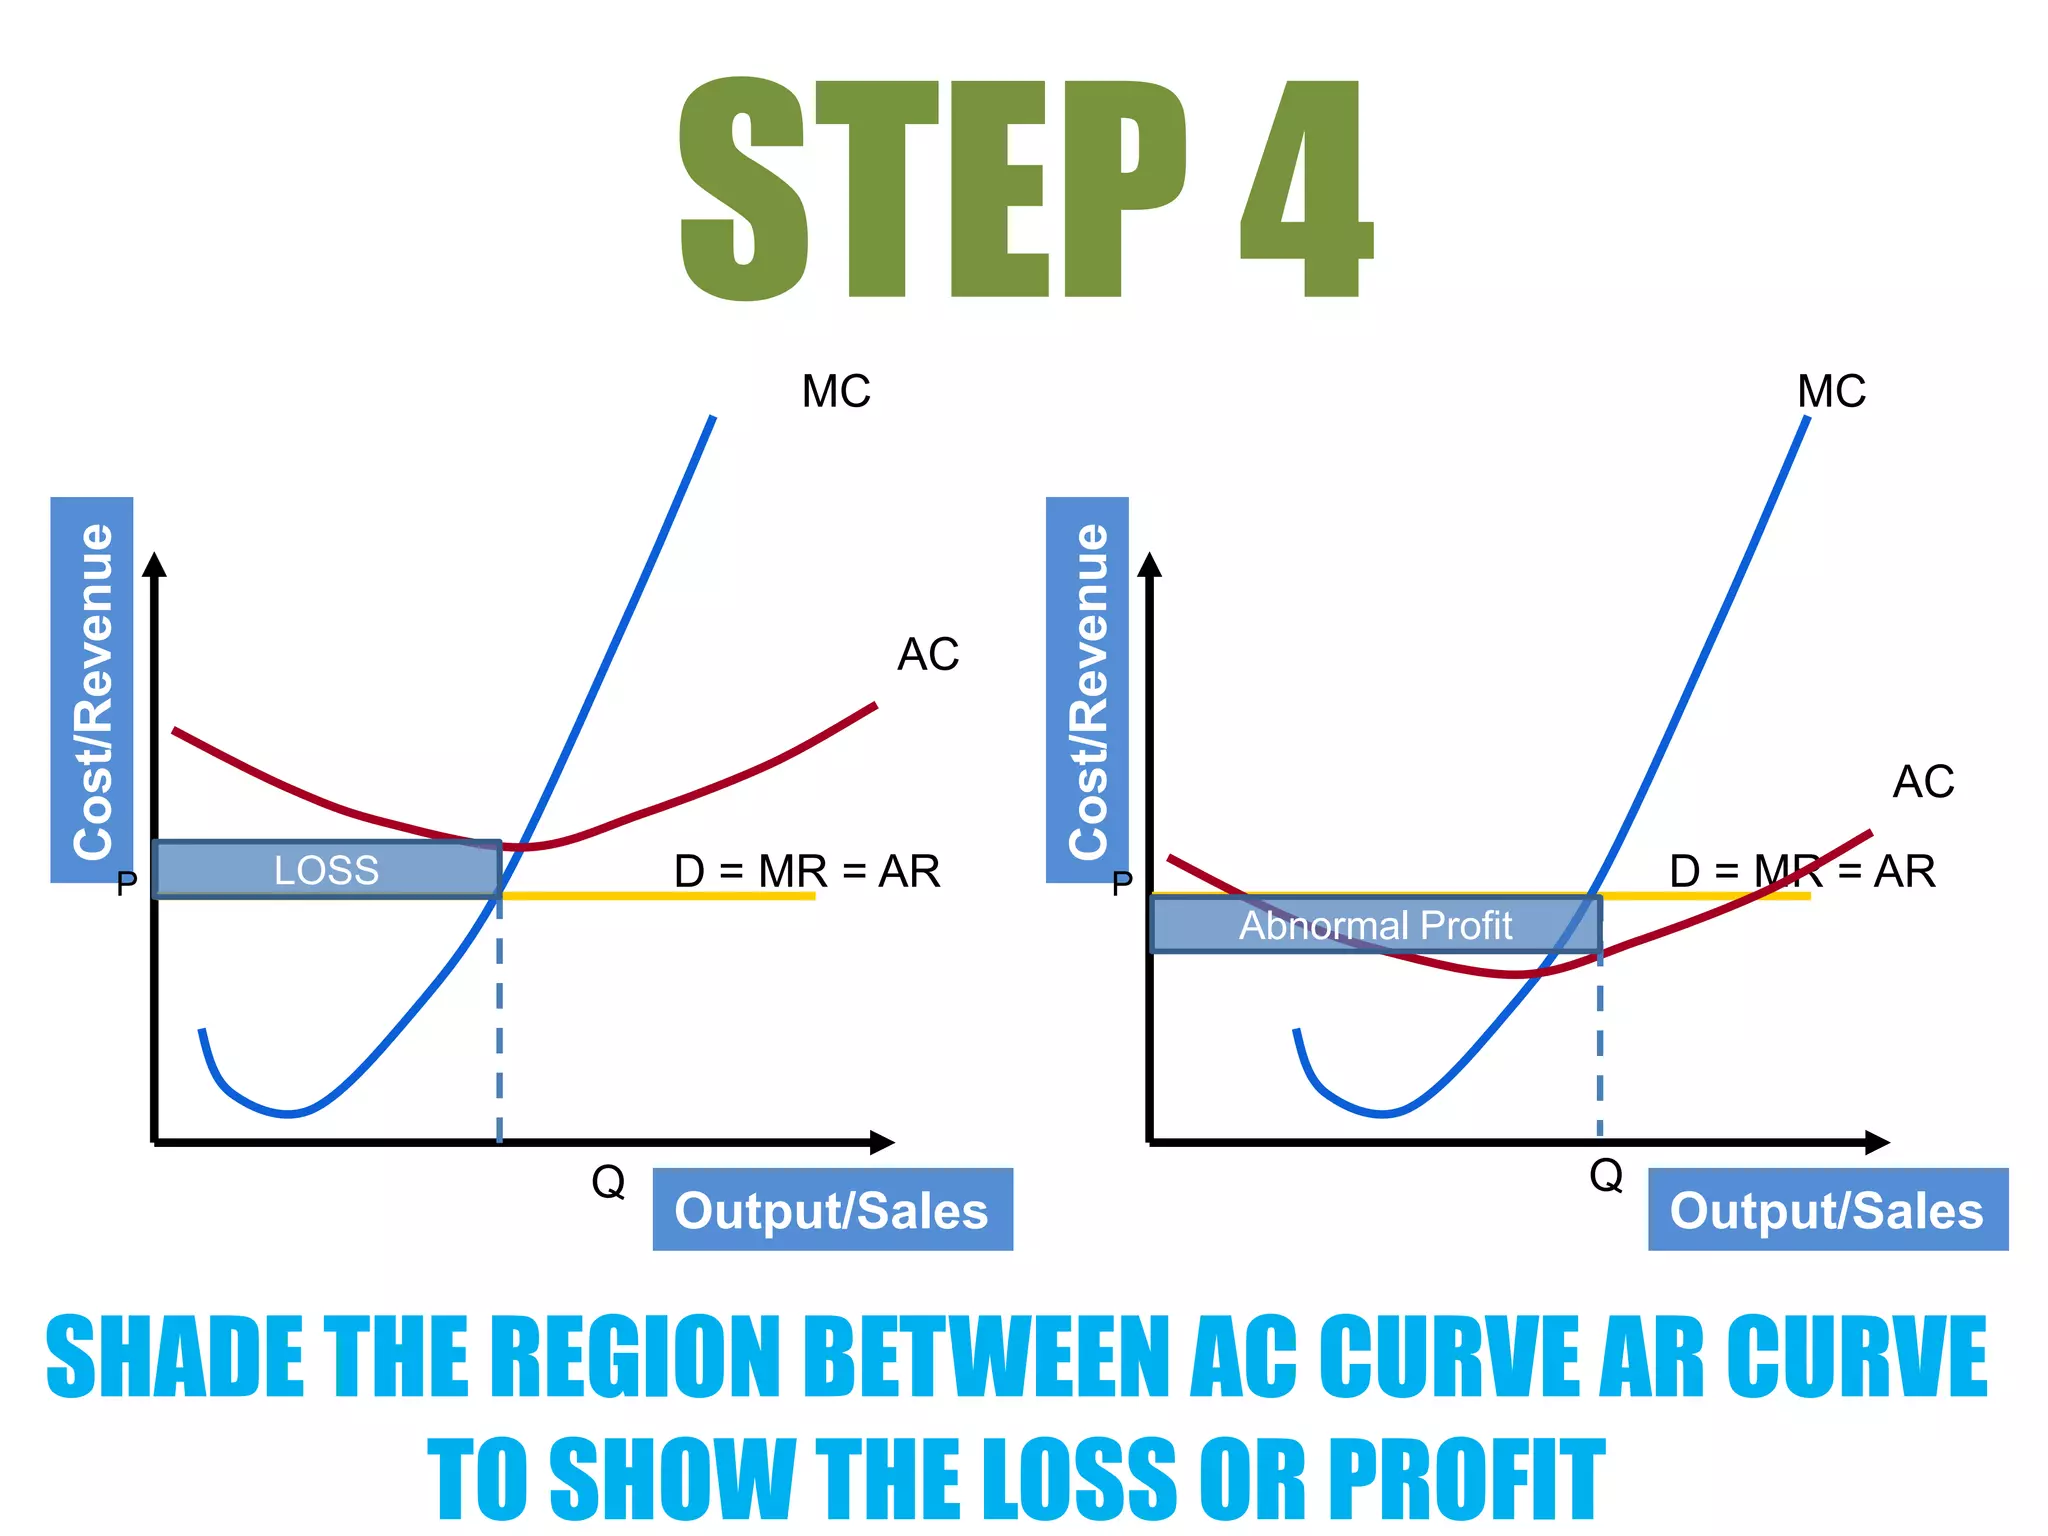
1) There are 4 steps to drawing effective market structure diagrams: draw the demand curve, place the average cost and marginal cost curves, identify the profit-maximizing output level where marginal cost equals marginal revenue, and shade the profit or loss regions. 2) The key difference between perfect competition and other market structures is that perfect competition has a perfectly elastic demand curve, while other structures have downward-sloping demand curves with marginal revenue curves below them. 3) Following the 4 steps allows you to draw diagrams that identify the optimal output level and show profits or losses for different market structures.