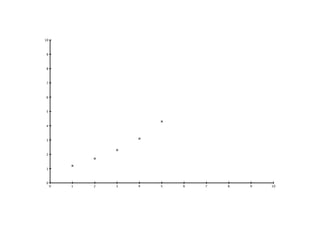
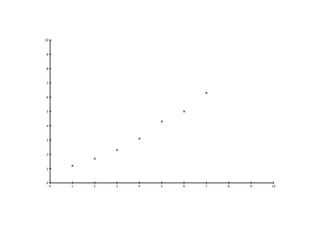
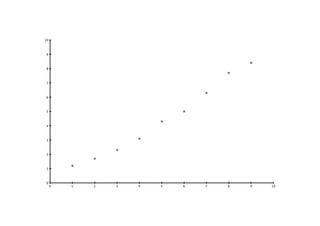
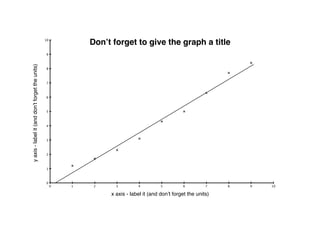
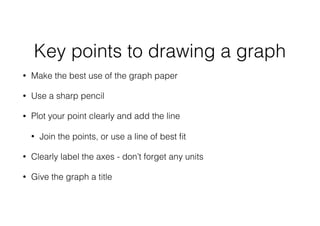
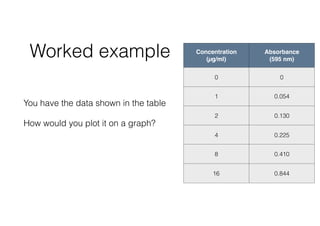
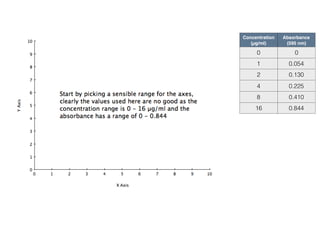
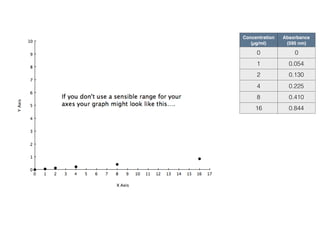
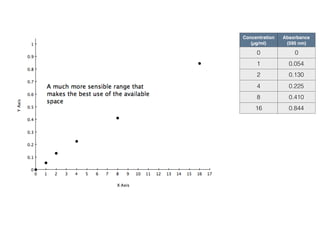
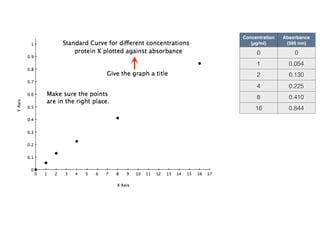
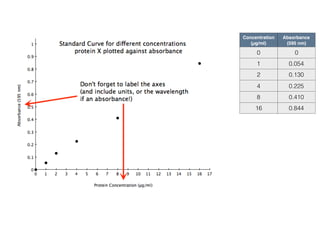
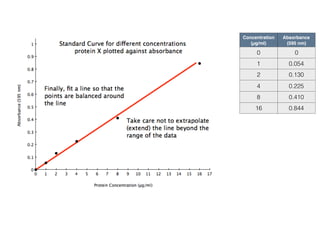
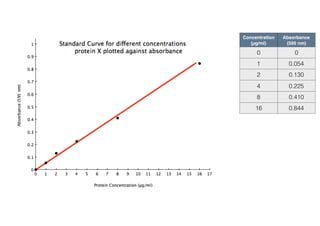
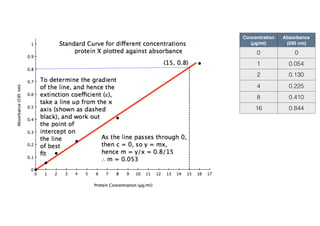
How to draw a graph
http://maths4biosciences.com
Key points to drawing a graph
• Make the best use of the graph paper
• Use a sharp pencil
• Plot your point clearly and add the line
• Join the points, or use a line of best fit
• Clearly label the axes - don’t forget any units
• Give the graph a title
100 1 2 3 4 5 6 7 8 9
10
0
1
2
3
4
5
6
7
8
9
100 1 2 3 4 5 6 7 8 9
10
0
1
2
3
4
5
6
7
8
9
100 1 2 3 4 5 6 7 8 9
10
0
1
2
3
4
5
6
7
8
9
Don’t forget to give the graph a title
x axis - label it (and don’t forget the units)
yaxis-labelit(anddon’tforgettheunits)
Key points to drawing a graph
• Make the best use of the graph paper
• Use a sharp pencil
• Plot your point clearly and add the line
• Join the points, or use a line of best fit
• Clearly label the axes - don’t forget any units
• Give the graph a title
Worked example
You have the data shown in the table
How would you plot it on a graph?
Concentration 

(µg/ml)
Absorbance 

(595 nm)
0 0
1 0.054
2 0.130
4 0.225
8 0.410
16 0.844
Concentration 

(µg/ml)
Absorbance 

(595 nm)
0 0
1 0.054
2 0.130
4 0.225
8 0.410
16 0.844
Concentration 

(µg/ml)
Absorbance 

(595 nm)
0 0
1 0.054
2 0.130
4 0.225
8 0.410
16 0.844
Concentration 

(µg/ml)
Absorbance 

(595 nm)
0 0
1 0.054
2 0.130
4 0.225
8 0.410
16 0.844
Concentration 

(µg/ml)
Absorbance 

(595 nm)
0 0
1 0.054
2 0.130
4 0.225
8 0.410
16 0.844
Concentration 

(µg/ml)
Absorbance 

(595 nm)
0 0
1 0.054
2 0.130
4 0.225
8 0.410
16 0.844
Concentration 

(µg/ml)
Absorbance 

(595 nm)
0 0
1 0.054
2 0.130
4 0.225
8 0.410
16 0.844
Concentration 

(µg/ml)
Absorbance 

(595 nm)
0 0
1 0.054
2 0.130
4 0.225
8 0.410
16 0.844
Concentration 

(µg/ml)
Absorbance 

(595 nm)
0 0
1 0.054
2 0.130
4 0.225
8 0.410
16 0.844
Concentration 

(µg/ml)
Absorbance 

(595 nm)
0 0
1 0.054
2 0.130
4 0.225
8 0.410
16 0.844
Unknown
Absorbance 

(595 nm)
Conc.

(µg/ml)
1 0.500
Concentration 

(µg/ml)
Absorbance 

(595 nm)
0 0
1 0.054
2 0.130
4 0.225
8 0.410
16 0.844
Unknown
Absorbance 

(595 nm)
Conc.

(µg/ml)
1 0.500
Concentration 

(µg/ml)
Absorbance 

(595 nm)
0 0
1 0.054
2 0.130
4 0.225
8 0.410
16 0.844
Unknown
Absorbance 

(595 nm)
Conc.

(µg/ml)
1 0.500 9.23
Amount 

(µgl)
Absorbance 

(595 nm)
0 0
3 0.066
6 0.130
12 0.255
24 0.481
48 0.966
Unknown
Absorbance 

(595 nm)
Amount

(µg)
1 0.187
2 0.406
3 0.703
4 1.189
Concentration 

(µgl)
Absorbance 

(595 nm)
0 0
3 0.066
6 0.130
12 0.255
24 0.481
48 0.966
Unknown
Absorbance 

(595 nm)
Amount

(µg)
1 0.187 9.0
2 0.406 19.6
3 0.703 33.9
4 1.189 ???
Summary
• Make the best use of the graph paper
• Use a sharp pencil
• Plot your point clearly and add the line
• Join the points, or use a line of best fit
• Clearly label the axes - don’t forget any units
• Give the graph a title
• Use different point styles if showing more than one data set
For more information and a free course please visit:
http://maths4biosciences.com
Maths course for biology and chemistry students:
http://mathsbiosciences.usefedora.com
If you have found this presentation useful then please share:

How to draw a graph