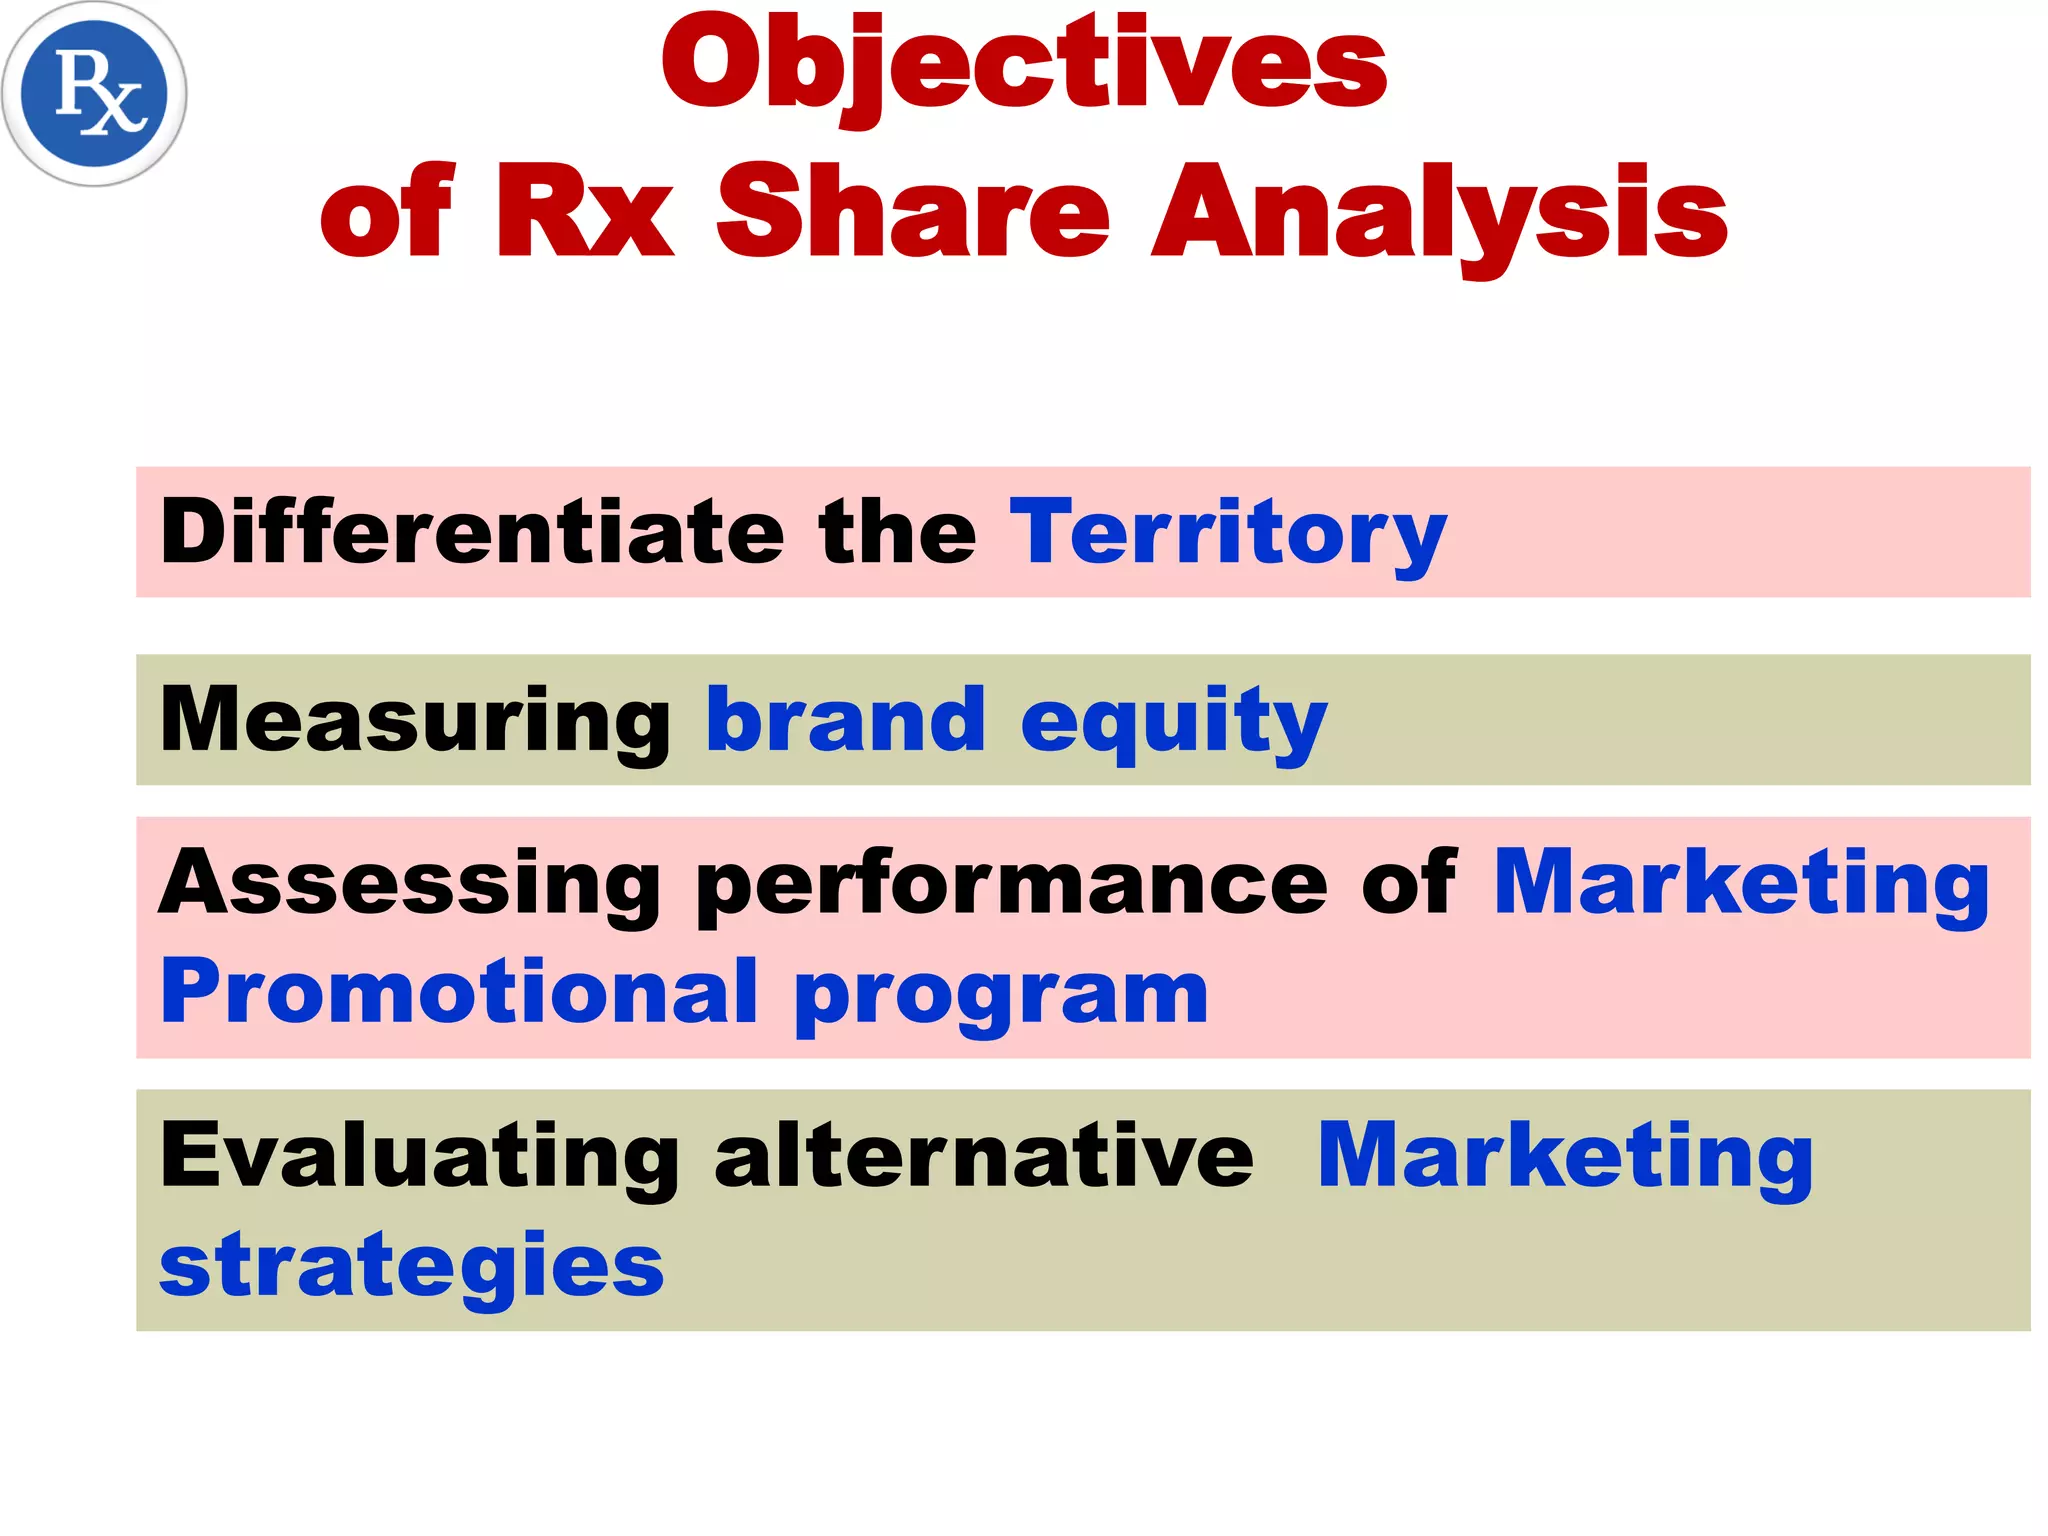
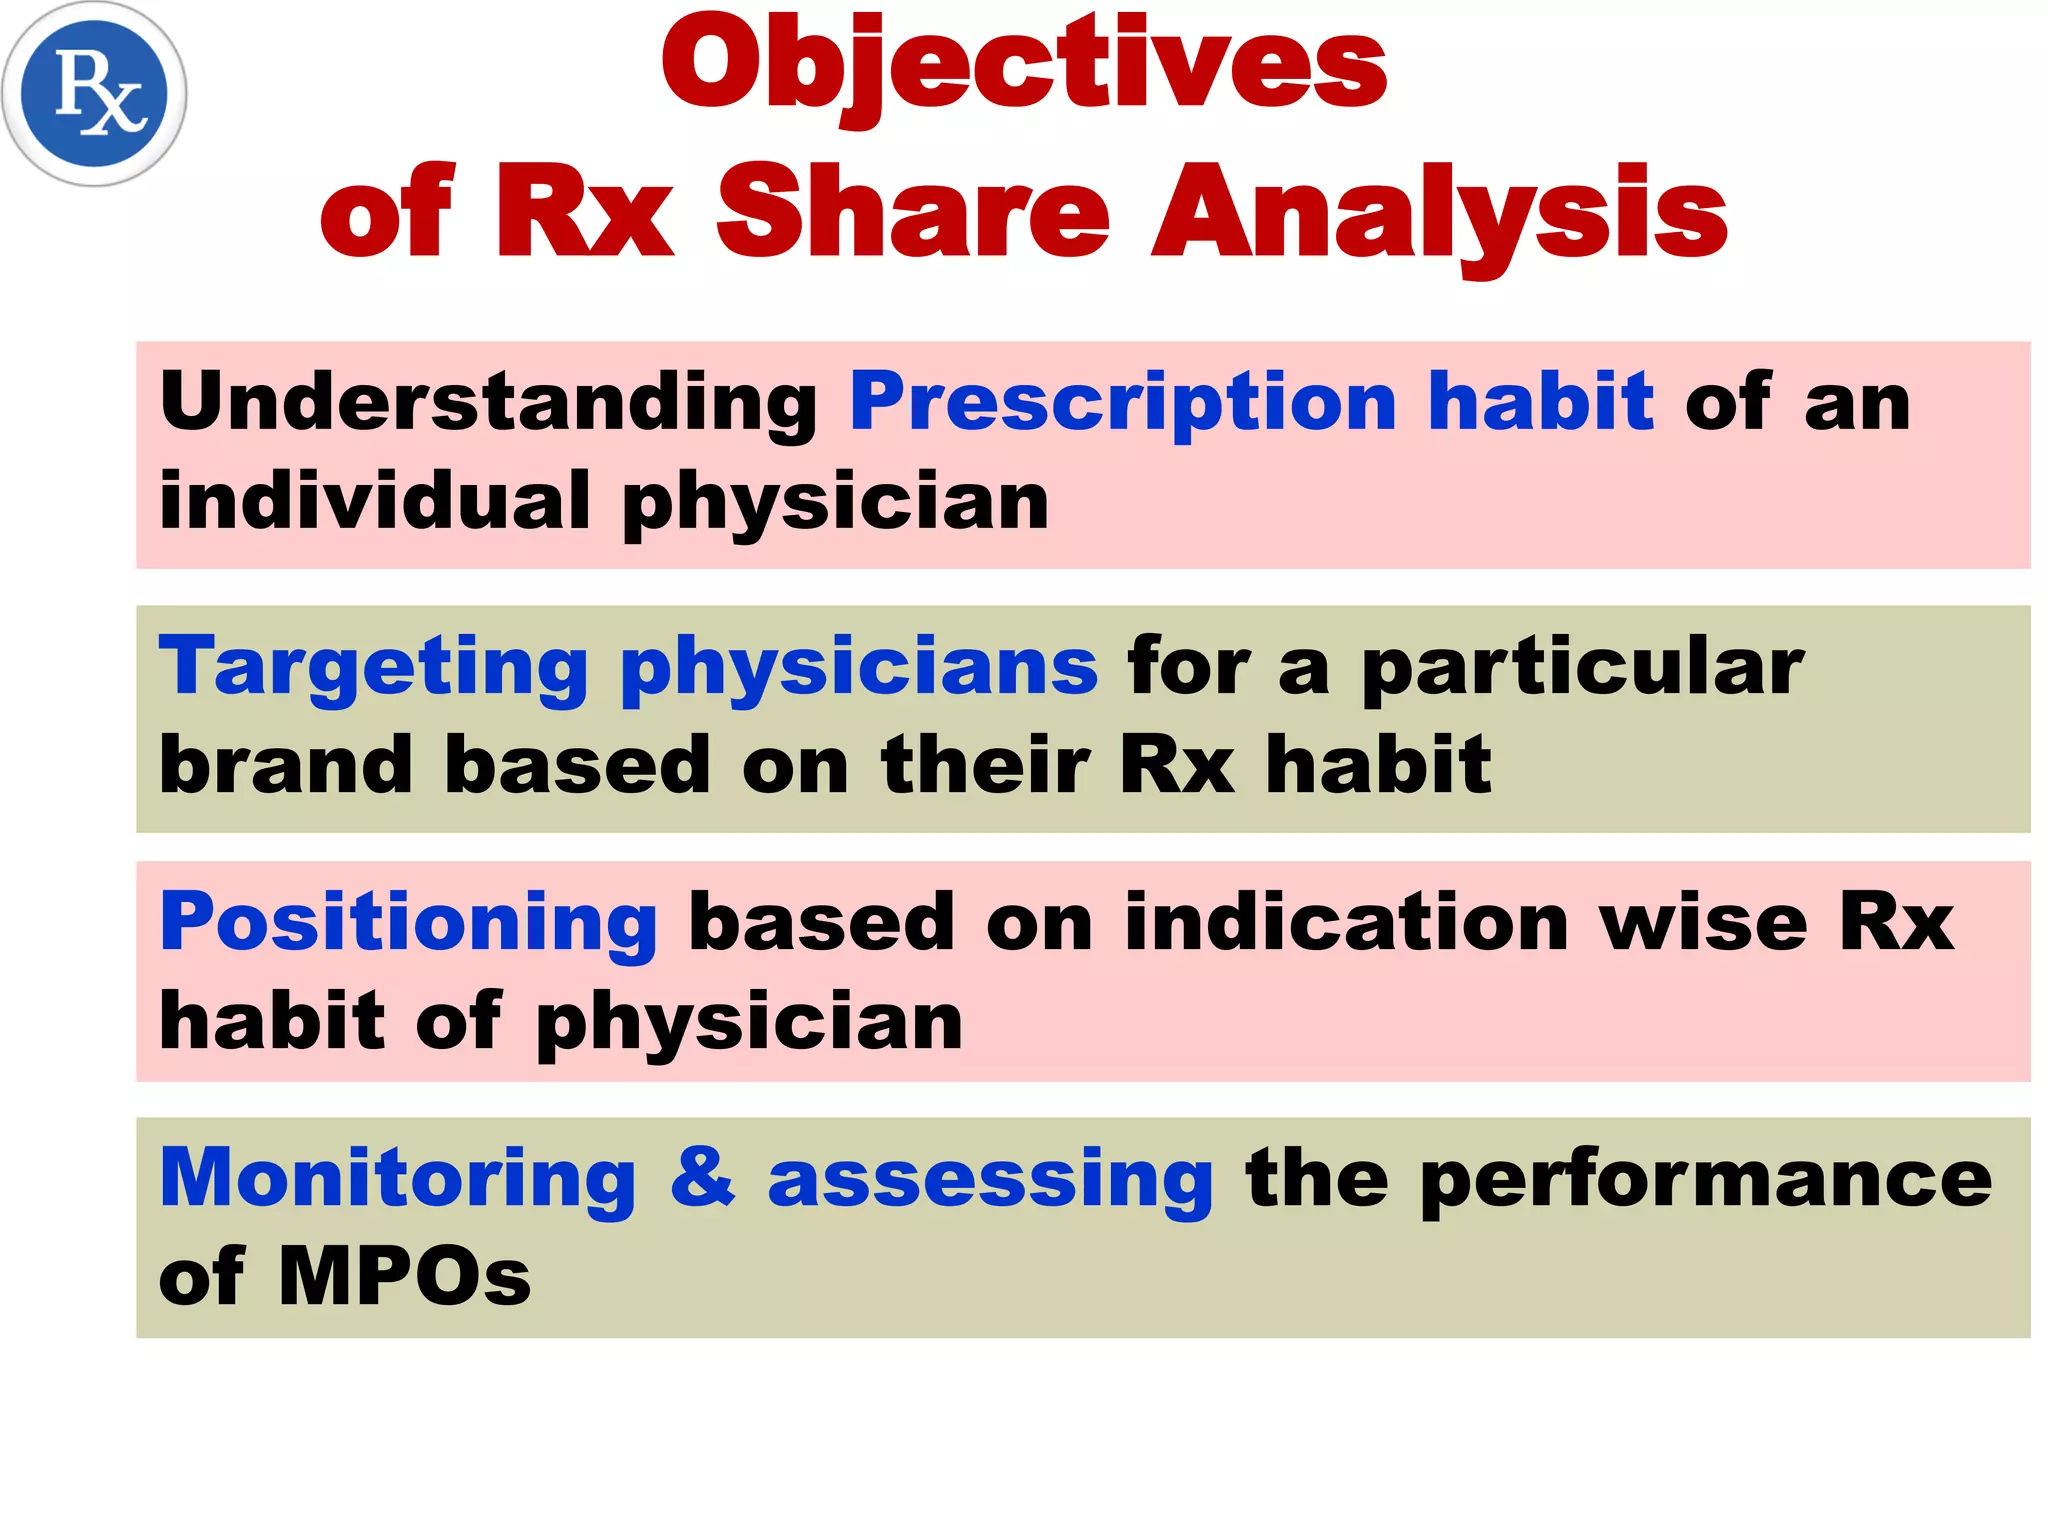
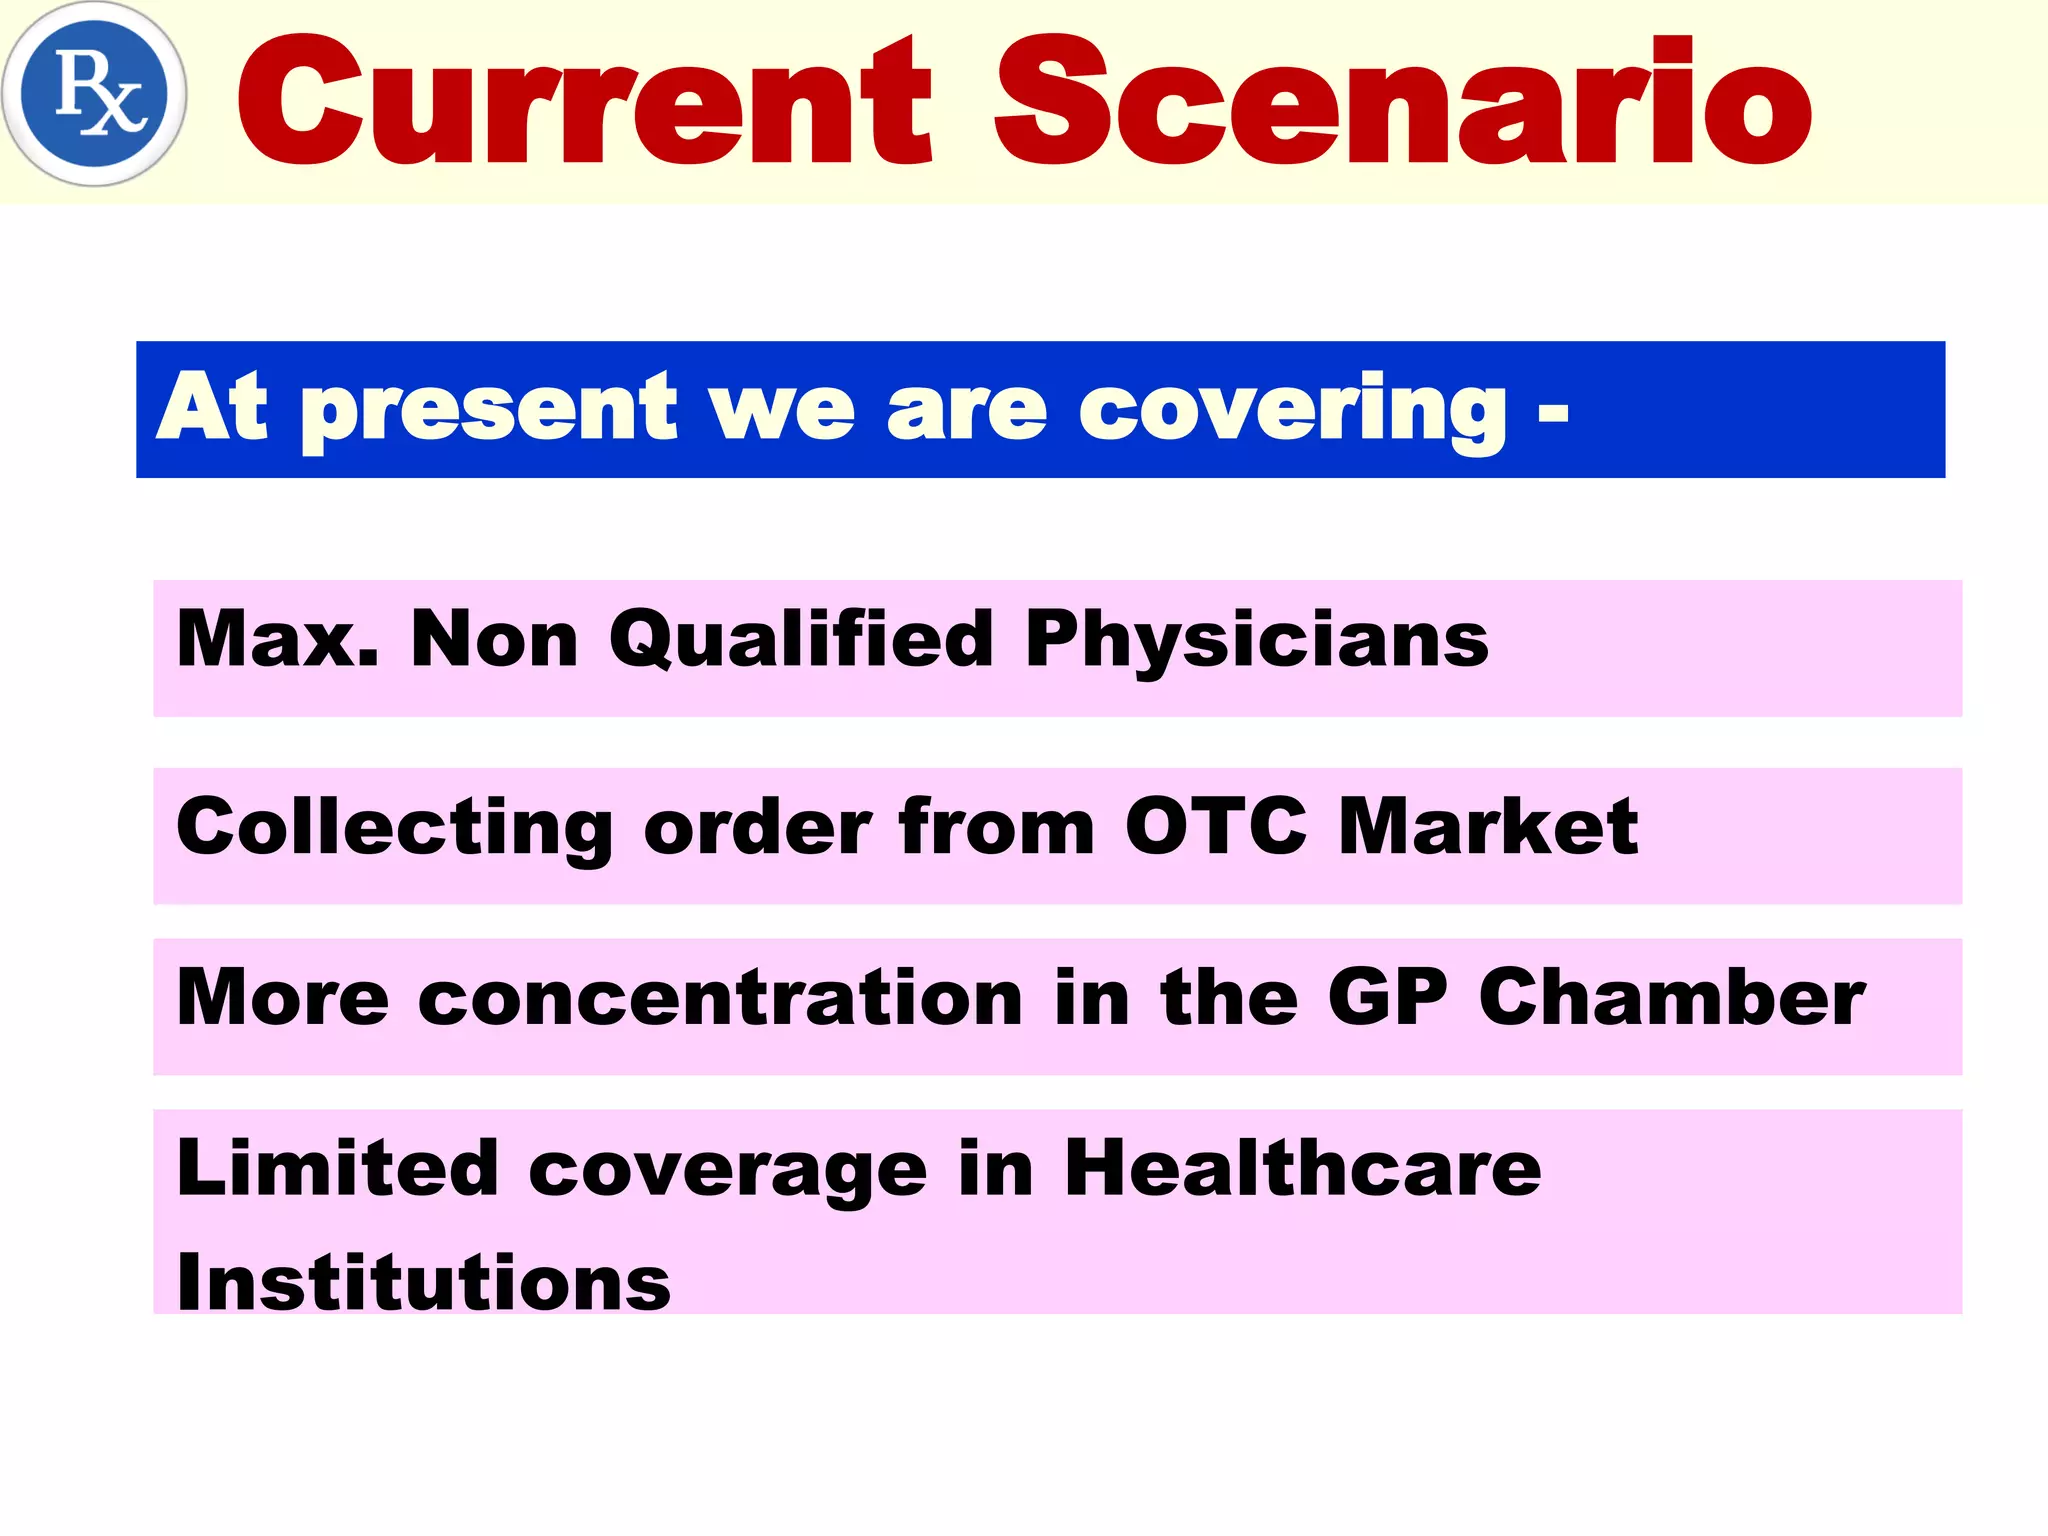
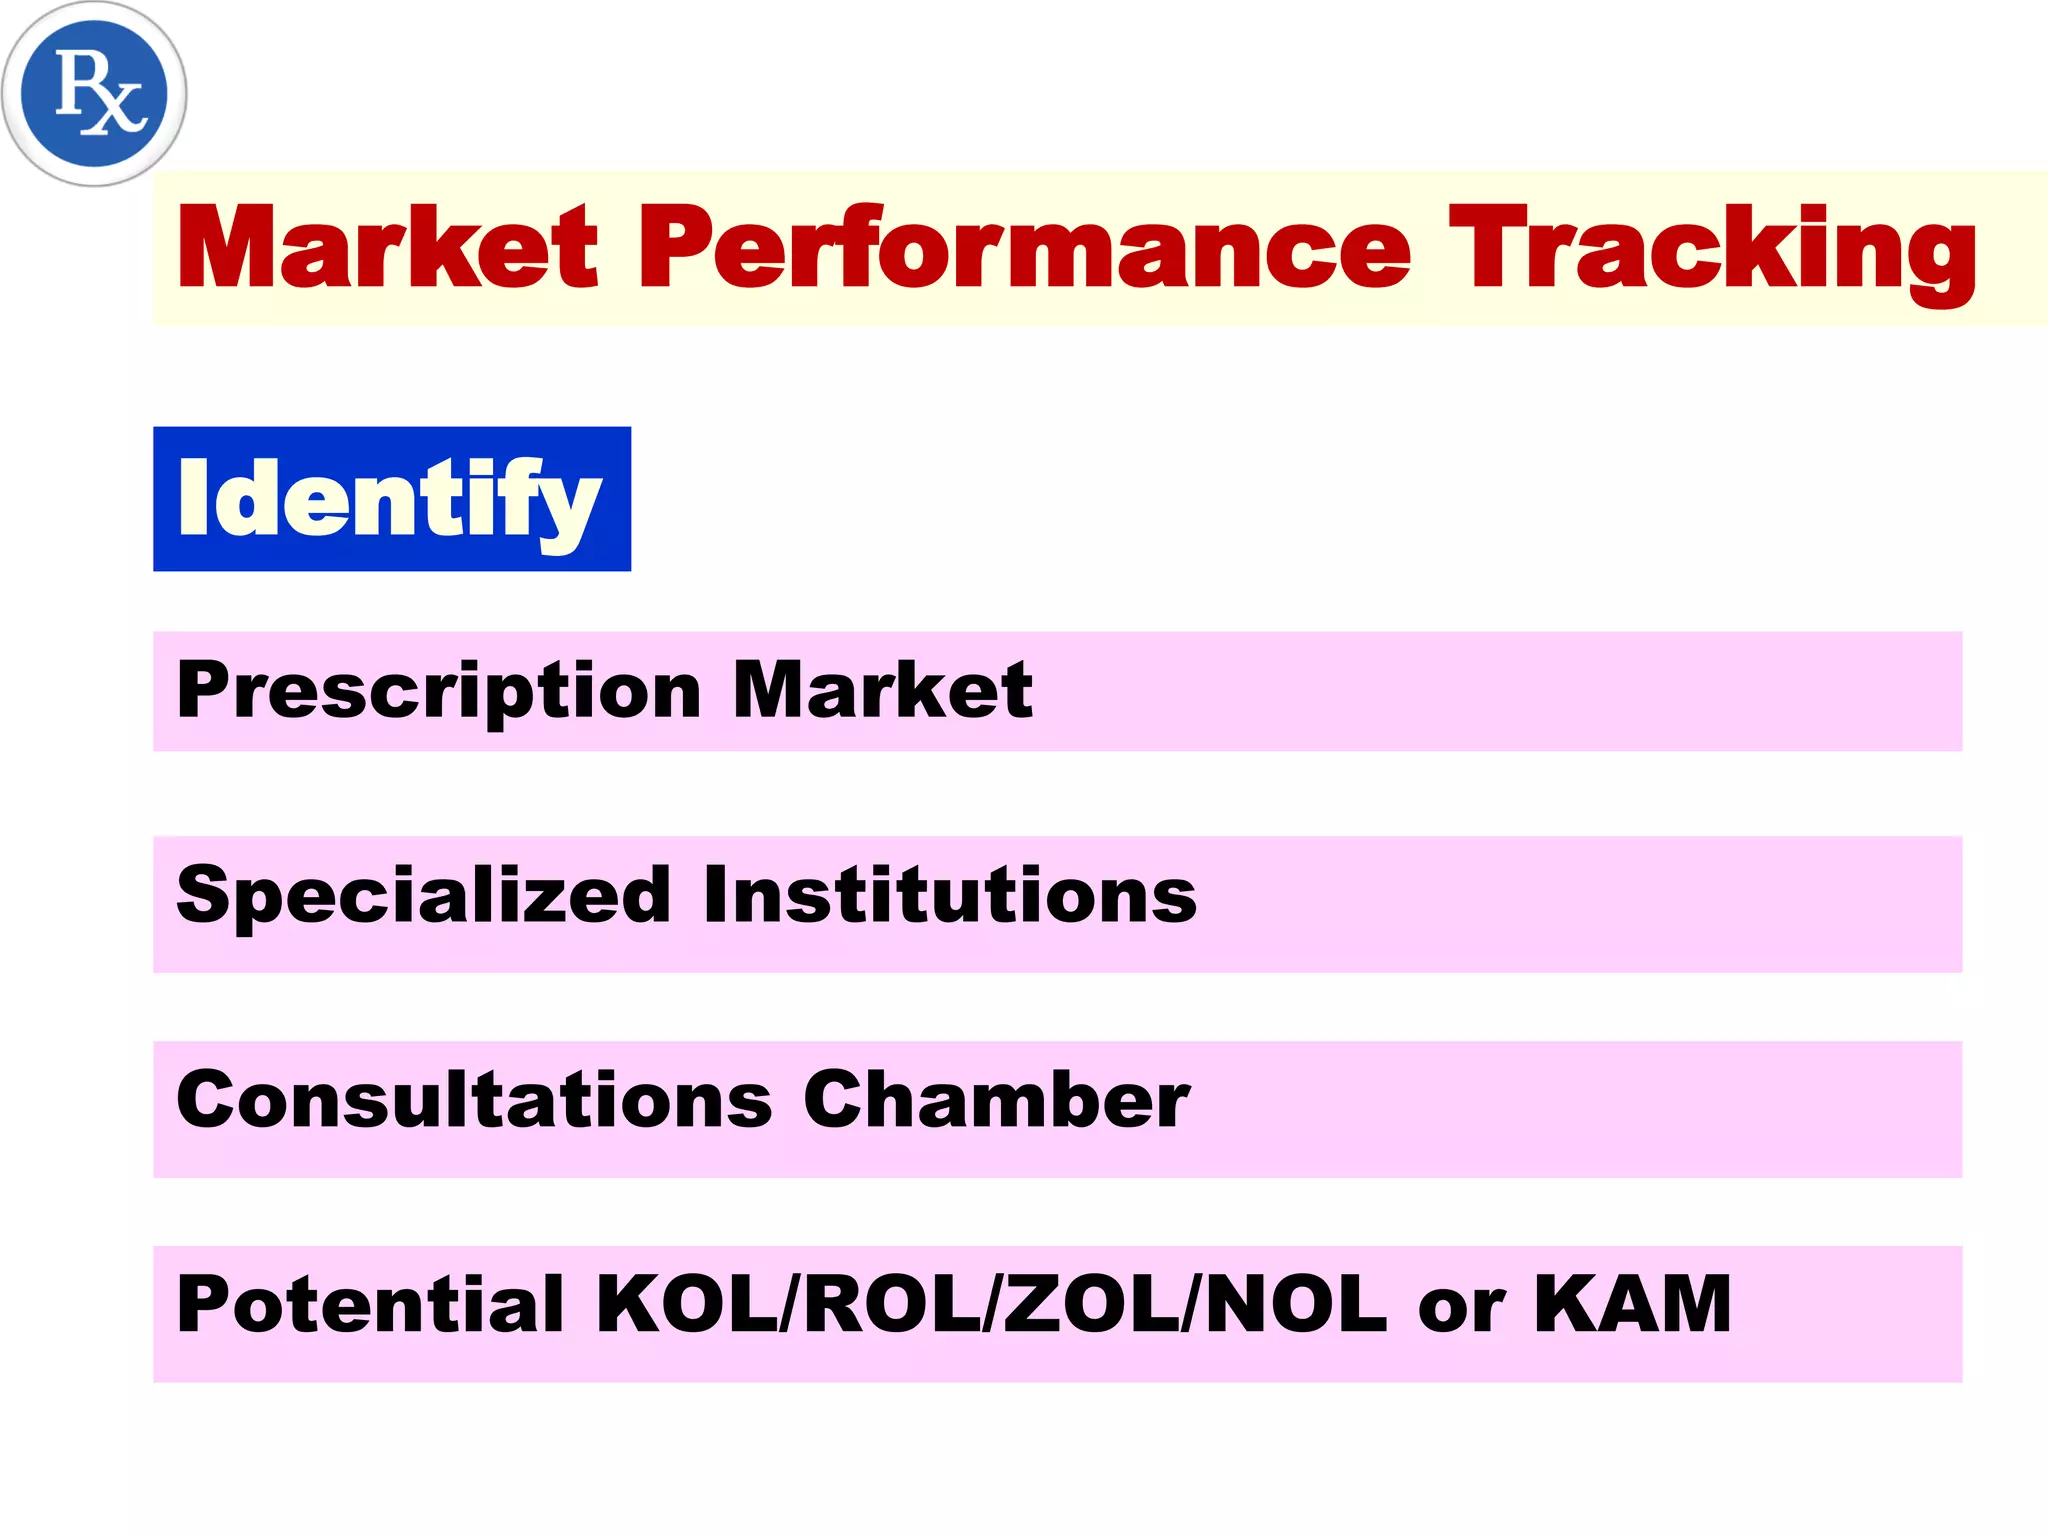
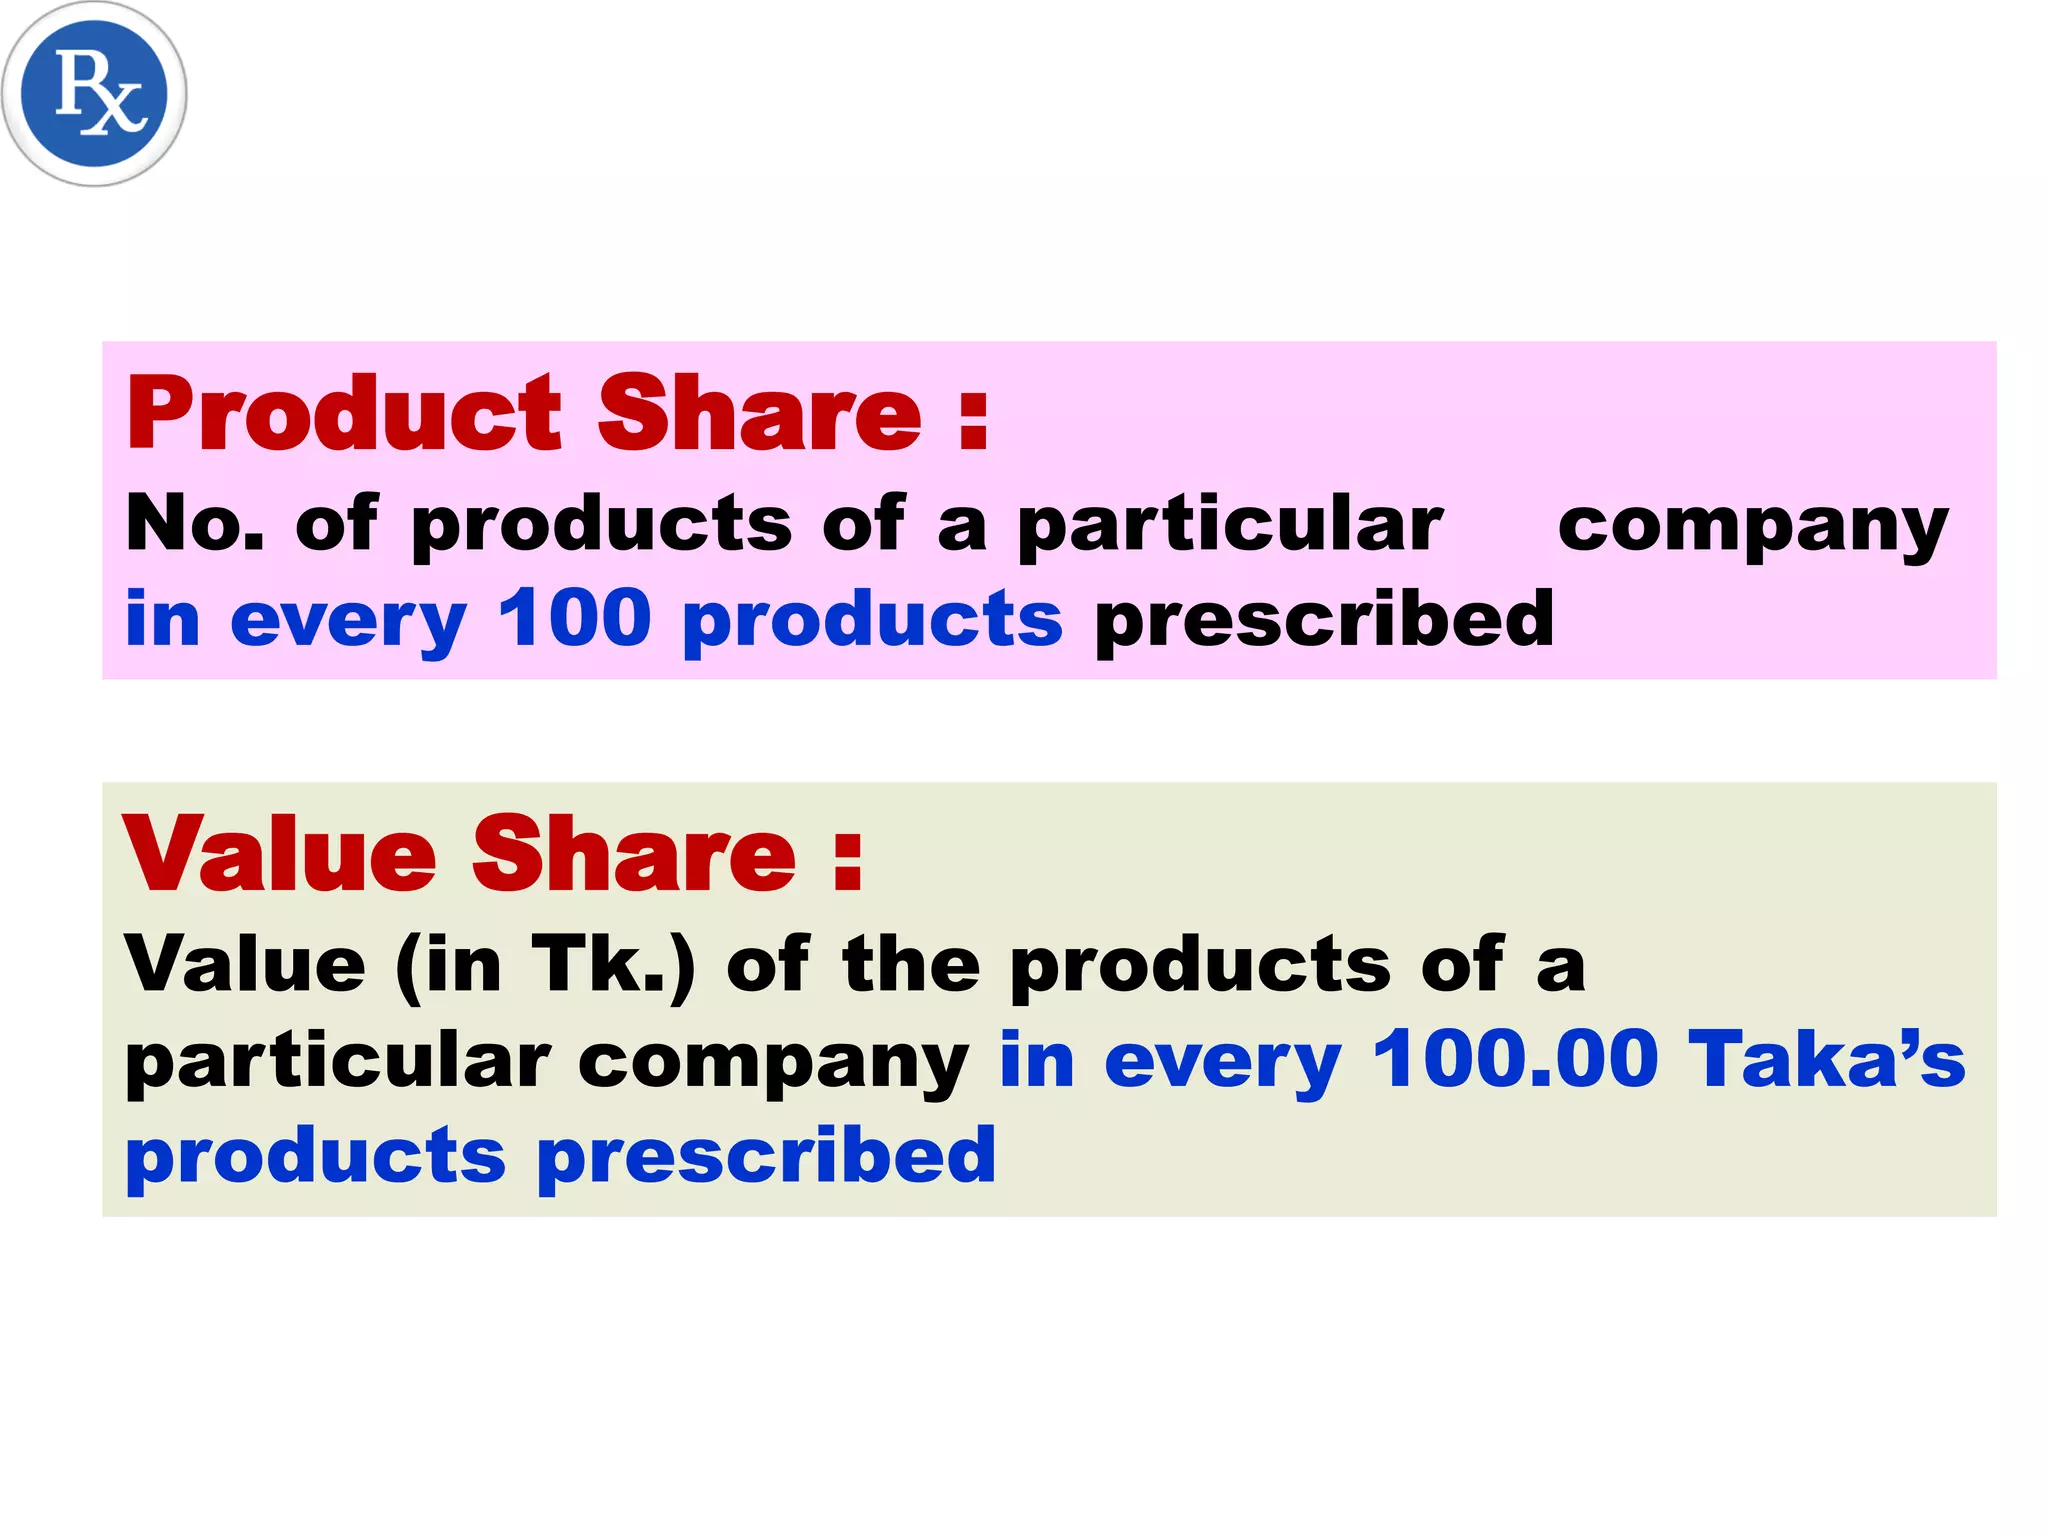
Maximize Your Business
by utilizing Rx Share Report
By
Masum Chowdhury
BPharm, MBA (Marketing), PGDSCM,
PGDHRM, ACMC & CIBS (IBA,DU),
masum.pha@gmail.com
0171 7642874
Differentiate the Territory
Measuring brand equity
Assessing performance of Marketing
Promotional program
Evaluating alternative Marketing
strategies
Objectives
of Rx Share Analysis
Understanding Prescription habit of an
individual physician
Targeting physicians for a particular
brand based on their Rx habit
Positioning based on indication wise Rx
habit of physician
Monitoring & assessing the performance
of MPOs
Objectives
of Rx Share Analysis
Territory must have
Healthcare Institution
Redefine the Territory
Consultation Centre
Specialized Institution
No of Markets
No of Chemists
Healthcare Institution
20 Child Hospitals
85 Diabetic Hospitals
48 Eye Hospitals
63 Sadar Hospitals
40 Medical College Hospitals
13 Specialized Hospitals
389 Upazila Health Complex
Total
Healthcare Institution
658
Healthcare Institutions
Total
Consultation Centers
320
Consultation Centers
Current Scenario
At present we are covering -
Max. Non Qualified Physicians
Collecting order from OTC Market
More concentration in the GP Chamber
Limited coverage in Healthcare
Institutions
Redefine the territory
To change this scenario, we must
Rx Share Analysis
Rx Share Analysis Report
A tool for marketing success
Potential KOL/ROL/ZOL/NOL or KAM
Prescription Market
Consultations Chamber
Specialized Institutions
Identify
Market Performance Tracking
Potential uncovered
Potential covered
Potential uncovered KAM
A Specific Target Group Customers who
are very potential for us but they are
totally uncovered.
Potential uncovered KAM means -
Rx Share Analysis
Product Share
Value Share
Which Share is Important ?
Value Share
Product Share :
No. of products of a particular company
in every 100 products prescribed
Value Share :
Value (in Tk.) of the products of a
particular company in every 100.00 Taka’s
products prescribed
All Therapeutic Class :
Your Share% among the universe, irrespective
of your presence in All Therapeutic Classes (365)
Identical Therapeutic Class :
Your Share% among the Identical Therapeutic
Classes (220) (Only the Classes in where you
are operating)
Company Share
Brand Track
Institute Share
Company Track
Brand Share
Institute Track
Physician Track (By Company)
Physician Track (24 Month)
Brand Share (By Specialization )
Brand Share
Brand Track
Brand Share
(By Specialization)
Company Share
Company Track
Institute Share
Institute Track
Physician Track
(By Company)
Physician Track
(24 Months)
Raw Prescription Data
What You Will Get
Name,
Address, Degree, Speciality etc.
Name,
Strength, Dosage Form, Qty, Unit
Value etc.
Physician’s Details
Brand’s Details
Raw Prescription Data
Prescription Date, Collection
Date
Prescription Date
What You Will Get
Raw Prescription Data
You will Know Updated Current Generic
Preference
You Will Know the Prescription Habit of
a Physician
Raw Prescription Data
Analysis
How Raw Data will help you
Helps to Make Effective Visit Plan (Selecting the
Right Physician for a Particular Brand)
Helps to Make Efficient Visit Plan (Allocating
Time for a Brand, Based on the Potentiality of a
Particular Physician for that Brand)
Allocate Promo Materials According to the
Potentiality
Raw Data Analysis
Brand Track for
Brand Development
How to use Brand Track ?
Select the potential Brands for Active Promotion
Active Promotion means Continuous Promotion
Variety of Promotional Tools and events are very
important factors for Brand Development.
Brand Development Factors
Variety of Promotional Tools
Potential MPOs/FMs
Potential KAM/KOLs
Marketer’s Success
Marketers success is
totally dependent on
understanding the market….
Success of a Brand
Why the generic is prescribed ?
Who are the prescriber ?
Who are the KOLs/KAM ?
Success of a
Brand Executive
Brand Executive must develop
Strategic promotional plan
based on Facts rather
experience.
Facts ?
Indication Tracking
Indication Generic
(%)
Your
Brand
Prophylaxis of NSAID induced
Hyperacidity
66.55
Peptic Ulcer Diseases 28.20
Dyspepsia 3.39
Acidity 0.73
Major Indication Prophylaxis & PUD
0.39%
0.42%
1%
0.67%
0.55%
0.34%
0.33%
0.00%
0.57%
0.00%
0.00%
0.00%
0.16%
1.20%
0.00%
0.00%
0.00%
0%
0.00%
0.00%
0.20%
0.40%
0.60%
0.80%
1.00%
1.20%
1.40%
Performance Analysis
of O-20 Capsule
Findings:
Performance Analysis
of O-20 Capsule
Medicine Specialist 0.00%
Gastroenterologist 0.00%
Active Focus should be given to all KOL
to Keep O-20 Capsule Positive.
Indication Tracking will increase
the success probability of a Brand
Executive.
Product Positioning
An effective marketing tool
Optimum utilization of Resource
Indication wise PPM
Increased acceptance of FFs& BE
to Physicians
Development of Brand value
Product Positioning of a
Pharma Brand Depends on -
Assessing KOL (Key Opinion Leader)
Must be specialists
Most frequent prescriber of the generic
Prescribing frequency of the generic is
significantly higher than that GP
Prescribe the generic for special
indication
Product Positioning of a
Pharma Brand Depends on -
Assessing KOL (Key Opinion Leader)
Identifying major prescribing indications
Identifying reach/strength of the
organization
Benefits over other Generics for same
Pharmacolgical indication
Strength & Opportunity
of Asiatic
4.10%
3.50%
3%
2.90%
2.70%
2.60%
2.30%
2.10% 2.10%
2.00%
1.80%
1.60% 1.60%
1.30% 1.30%
1.20%
1.10%
0% 0.00%
0.00%
0.50%
1.00%
1.50%
2.00%
2.50%
3.00%
3.50%
4.00%
4.50%
Review

How to develop Rx share for continuous business growth