
Recommended
More Related Content
What's hot
Similar to How do we determine prices?
Similar to How do we determine prices? (20)
More from Susanna Pierce
More from Susanna Pierce (20)
Recently uploaded
Recently uploaded (20)
How do we determine prices?
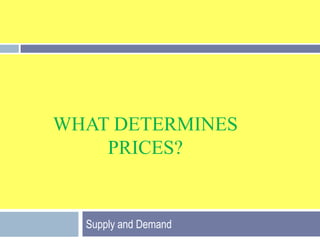
- 1. What Determines PriceS? Supply and Demand
- 2. A Competitive Market Any arrangement that brings buyers and sellers together Physical or virtual
- 3. Since Economics is about Choices… Demand Supply We see how all buyers’ and sellers’ decisions interact in the market to create prices.
- 4. What is DEMAND? Individual: how one person’s decisions affect price Market: total sum of all buyers in a market Consumers’ willingness and ability to buy an item at a given price Wants within budget constraints Refers to a behavior
- 5. THE LAW OF DEMAND Shows an inverse relationship between price (P) and quantity (Q) Price affects the quantity demanded Higher prices lower quantity demanded Lower prices more quantity demanded Sales!
- 6. THE LAW OF DEMAND Why does the curve go down?
- 7. The Demand Law exists… Income effect $ increase you feel poorer, you buy less $ decrease you feel richer, you buy more Substitution effect Pepsi vs. Coke Marginal Utility Ex. All You Can Eat Buffet Each plate makes you less happy than the plate before
- 8. DemandSchedule vs. Curve Curve Schedule shows all of the combinations of quantities demanded at different prices, ceteris paribus Curve Plots the relationship between price and quantity demanded
- 9. How do you shift the Demand Curve? Tastes or Preferences Related Goods’ Prices Income Population (# of buyers) Expectations
- 10. The 5 Determinants of Demand Affected by trends and health considerations Related Prices Complements Hot dogs and buns If P goes up of complement, demand decreases and vice virsa Substitutes Pepsi vs. Coke If P of substitute goes up demand increases Tastes (Preferences)
- 11. The 5 Determinants of Demand If income increases Buy more luxury/normal goods If income decreases Buy more normal/inferior goods More buyers = more demand Less buyers = less demand Income Population (# of Buyers)
- 12. The Five Determinants of Demand Expectations If P is expected to go up in the future, demand increases NOW If P is expected to go down in the future, demand decreases NOW
- 13. SHIFT IT…
- 14. Shift Vs. Change in Quantity Demanded
- 15. GROUP ACTIVITY You are in charge of opening a firm offering a specific good or service. Decide on a product name, slogan, and then answer the three basic questions of production: what you will produce, how you will produce it, and for whom you will produce it. After, draw a potential demand curve for your expected market of the good or service. Explain how your demanders’ curves could shift in or out using the determinants of demand. Be prepared to justify your answers as expert economists.
- 16. Supply Producers’ willingness and ability to sell a good or service Refers to a behavior
- 17. THE LAW OF Supply Shows a direct relationship between price (P) and quantity (Q) Price affects the quantity supplied Higher prices higher quantity supplied Lower prices less quantity supplied PRODUCERS LOVE HIGHER PRICES!
- 18. THE LAW OF SUPPLY Why does the curve go up?
- 21. Need more space
- 22. Can’t add factories and machines fast enough
- 23. Labor is used
- 25. Movement along the Curve vs. Shift Changes in the quantity supplied comes because of a price change A shift in the Curve comes because of a change in a determinant of supply.
- 26. How do you shift the Supply Curve? Sellers (#) Productivity Input Costs Expectations Related Prices Cash Change Taxes or subsidies
- 27. The 6 Determinants of Supply If more suppliers Shifts right If less suppliers Shifts left Increase supply Technology, capital innovation Decrease supply Natural phenomenon hinders productivity Sellers Productivity
- 28. The 6 Determinants of Supply If inputs price increases Shifts left If inputs price decreases Shifts right If price will go up in the future, the supply NOW decreases If price will decrease in the future, the supply NOW increases Input Prices Expectations
- 29. The 6 Determinants of Supply If related price increases Shifts left If related price decreases Shifts right Subsidy Supply shifts right Tax Supply shifts left Related Prices Cash Change
- 30. Market Equilibrium P= $1.00 Qs = 10 million bottles WHEN SUPPLY MEETS DEMAND