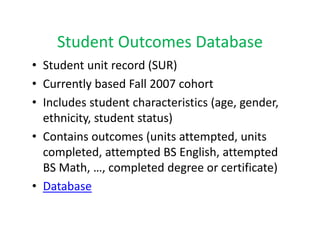
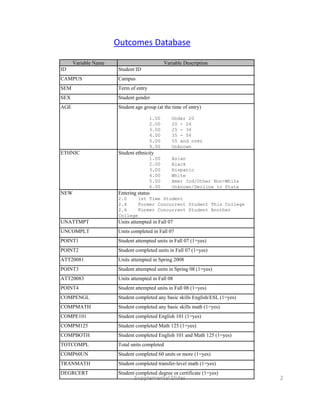
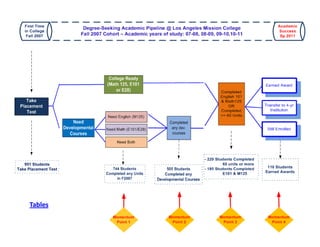
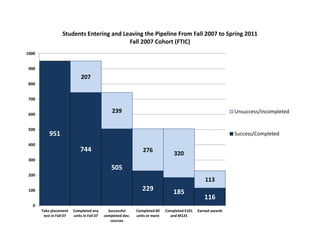
1) The document discusses developing data to assess student progression at the Los Angeles Community College District.
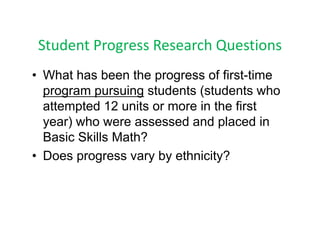
2) It presents research questions about the progress of first-time students placed in basic skills math, including whether progress varies by ethnicity.
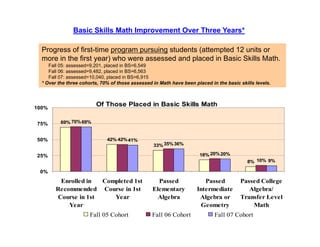
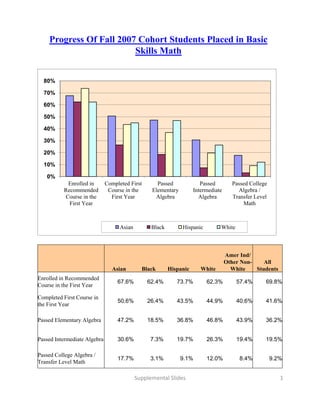
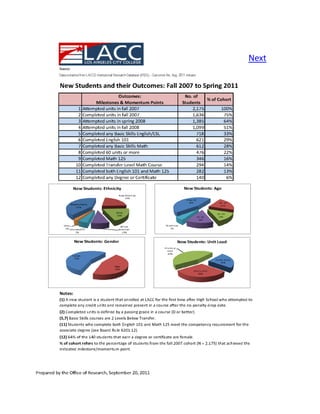
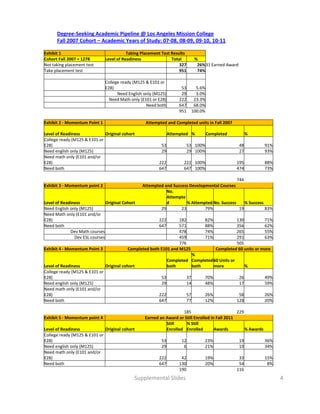
3) Tables show outcomes like course completion rates over three years for different ethnic groups of students placed in basic skills math.