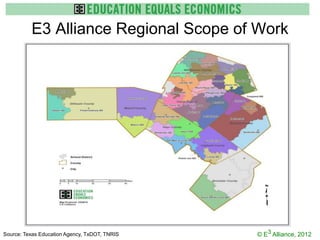
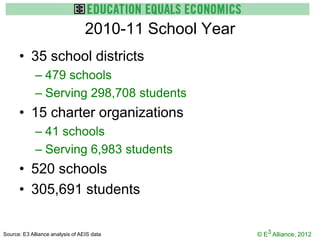
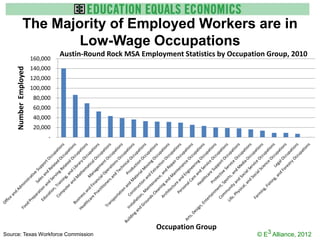
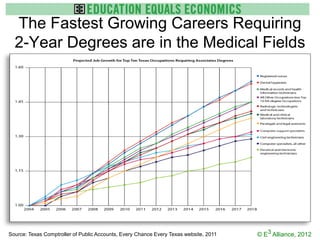
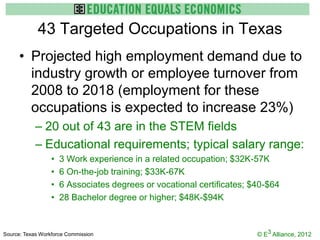
2012 Central Texas Profile
  Made possible through the investment of:


            www.e3alliance.org
E3 Alliance Regional Scope of Work


Source: Texas Education Agency, TxDOT, TNRIS   © E3 Alliance, 2012
Top 10 Manufactures for Central Texas

      Vrc Industries


Source: Texas Workforce Commission, County Narrative Profile data, February 2012   © E3 Alliance, 2012
Economics: Texas Highlights
      • The 129,000 high school dropouts from the
        Class of 2011 will cost the Texas economy $18
        Billion in lost wages over their lifetimes*
      • If half of these students had graduated, they
        would provide Texas $61 million in increased
        annual state tax revenue*
      • If Texas’s high schools were to graduate all
        students ready for college, the state would likely
        save as much as $462 million in college
        remediation costs and lost earnings**
*Source: Alliance for Excellent Education (Alliance), “The High Cost of High School Dropouts,” 2011
**Source: Alliance, “Saving Now and Saving Later,” 2011                                               © E3 Alliance, 2012
CENTRAL TEXAS FACTS &
FIGURES

                    © E3 Alliance, 2012
2010-11 School Year
      • 35 school districts
             – 479 schools
             – Serving 298,708 students
      • 15 charter organizations
             – 41 schools
             – Serving 6,983 students
      • 520 schools
      • 305,691 students

Source: E3 Alliance analysis of AEIS data               © E3 Alliance, 2012
Migration into Texas
      • The population of Texas is over 25 million
            – 85% of population growth is due to new births
            – 15% of population growth is due to immigration
      • 74% of immigration comes from U.S.A.


     Texas Population                                                                       Domestic
         Increase
      (2009 to 2010)                                                                        International


                              0       150,000      300,000   450,000   600,000   750,000
Source: US Census Bureau, American Community Survey, 2010                             © E3 Alliance, 2012
Texas Immigration vs. Emigration
                                              Texas Immigration vs. Emigration
                                    600,000
          Number of People Moving


                                    500,000


                                    400,000


                                    300,000


                                    200,000


                                    100,000
                                                                                       ???
                                         0
                                                Other State                   Other Country
                                                     Immigrants   Emigrants


Source:                                                                                  © E3 Alliance, 2012
Central Texans Have Higher Levels of
         Education than the State Average
               Educational Attainment, Texas vs. Central Texas Region, 2010
                     Texas                           Central Texas


                                                                            Less than
                   College       Less than                                   HS, 13%
                  Graduate,       HS, 19%                   College
                     23%                                   Graduate,
                                                              35%
                                                                                       HS
                                                                                    Graduate,
                                                                                       20%
                                        HS
                  Some
                                     Graduate,
                 College, 3                                             Some
                                        26%
                    1%                                                 College, 3
                                                                          2%


Source: US Census Bureau American Community Survey, 2010                            © E3 Alliance, 2012
Educational Attainment is Increasing
                 Across Central Texas
             Educational Attainment for Adult Population, Central Texas
                           2003                                  2010


                                                                     Less than
                                  Less than
                                                                      HS, 13%
                                   HS, 16%
                College                               College
               Graduate,                             Graduate,
                 37%                                   35%
                                                                                 HS
                                           HS
                                                                              Graduate,
                                        Graduate,
                                                                                20%
                                          19%


                            Some                                  Some
                           College, 2                            College, 3
                              8%                                    2%


Source: US Census Bureau American Community Survey                            © E3 Alliance, 2012
CENTRAL TEXAS ECONOMY


                   © E3 Alliance, 2012
The Majority of Employed Workers are in
                      Low-Wage Occupations
                                 Austin-Round Rock MSA Employment Statistics by Occupation Group, 2010
                       160,000
                       140,000
     Number Employed


                       120,000
                       100,000
                        80,000
                        60,000
                        40,000
                        20,000
                             -


                                                           Occupation Group
Source: Texas Workforce Commission                                                      © E3 Alliance, 2012
The Fastest Growing Careers Requiring
  2-Year Degrees are in the Medical Fields


Source: Texas Comptroller of Public Accounts, Every Chance Every Texas website, 2011   © E3 Alliance, 2012
Statewide Projected Job Growth, By Cluster

                     Information and Computer


            Petroleum and Chemical Products


                                        Energy


              Biotechnology and Life Sciences


 Advanced Technologies and Manufacturing


                        Aerospace and Defense


                       -15%      -10%   -5%      0%   5%    10%   15%   20%      25%      30%
                                          2001-2011   2008-2018

Source: Texas Workforce Commission                                            © E3 Alliance, 2012
43 Targeted Occupations in Texas
      • Projected high employment demand due to
        industry growth or employee turnover from
        2008 to 2018 (employment for these
        occupations is expected to increase 23%)
            – 20 out of 43 are in the STEM fields
            – Educational requirements; typical salary range:
                  •   3 Work experience in a related occupation; $32K-57K
                  •   6 On-the-job training; $33K-67K
                  •   6 Associates degrees or vocational certificates; $40-$64
                  •   28 Bachelor degree or higher; $48K-$94K


Source: Texas Workforce Commission                                      © E3 Alliance, 2012
Unemployment Rate


                                                                                                         0%
                                                                                                              2%
                                                                                                                    4%
                                                                                                                          6%
                                                                                                                                8%
                                                                                                                                       10%
                                                                                                                                             12%
                                                                                              2001 Jun
                                                                                             2001 Sep
                                                                                             2001 Dec
                                                                                             2002 Mar
                                                                                              2002 Jun
                                                                                             2002 Sep
                                                                                             2002 Dec
                                                                                             2003 Mar
                                                                                              2003 Jun
                                                                                             2003 Sep
                                                                                             2003 Dec
                                                                                             2004 Mar
                                                                                              2004 Jun
                                                                                             2004 Sep


                                                                           MSA Unemp. Rate
                                                                                             2004 Dec
                                                                                             2005 Mar
                                                                                              2005 Jun
                                                                                             2005 Sep
                                                                                             2005 Dec
                                                                                             2006 Mar
                                                                                              2006 Jun


 Source: Texas Comptroller of Public Accounts, Texas Ahead website, 2011
                                                                                             2006 Sep
                                                                                             2006 Dec


                                                                           TX Unemp. Rate
                                                                                             2007 Mar
                                                                                              2007 Jun
                                                                                             2007 Sep
                                                                                             2007 Dec
                                                                                             2008 Mar
                                                                                              2008 Jun
                                                                                             2008 Sep
                                                                                                                                                            Austin-Round Rock-San Marcos MSA


                                                                                             2008 Dec
                                                                           US Unemp. Rate


                                                                                             2009 Mar
                                                                                              2009 Jun
                                                                                             2009 Sep
                                                                                             2009 Dec
                                                                                             2010 Mar
                                                                                                                                                   Unemployment Rates Compared to Texas and United States


                                                                                              2010 Jun
                                                                                             2010 Sep
                                                                                             2010 Dec
                                                                                             2011 Mar
© E3 Alliance, 2012


                                                                                              2011 Jun
Unemployment Rates Decline with
                                        Educational Attainment
                    16
                                    US Unemployment Rate by Educational Attainment
                    14

                    12
     Unemployment Rate


                    10

                         8

                         6

                         4

                         2

                         0
                             2001   2002    2003     2004     2005        2006      2007     2008     2009     2010   2011
                                     Less than High School Degree                High School Degree
                                     Some College or Associate's Degree          Bachelor's Degree or higher

Source: U.S. Department of Labor                                                                               © E3 Alliance, 2012
Texas Below the National Average for Unemployment
                                        at All Levels of Education
                           16%
                                   Unemployment Rate for Persons Age 25 and
                                                 Older, 2010
                           14%     14.9%
       Unemployment Rate


                           12%

                           10%             10.6%   10.3%
                                                           9.1%
                           8%                                             8.4%
                                                                                 7.4%
                           6%

                           4%                                                            4.7%
                                                                                                4.1%
                           2%

                           0%
                                  Less than High   High School       Some College or Bachelor's degree
                                 School graduate    graduate        Associate's degree  or higher

                                                           US     Texas

Source: US Department of Labor and Census Bureau                                          © E3 Alliance, 2012
CENTRAL TEXAS
WORKFORCE

                © E3 Alliance, 2012
High School Graduation Rates
                        All               White             Black          Hispanic   Asian      American
                     Students                                                                     Indian
      Central
      Texas
      Texas              67%               76%               59%               58%    89%            52%
      Nation             72%               78%               57%               58%    83%            54%


Source: Alliance for Excellent Education, “Texas High School’s State Card”, 2011              © E3 Alliance, 2012
Four-Year College Graduation Rates

                         All                White              Black           Hispanic              Asian           American
                      Students                                                                                        Indian
      Texas1              49%                57%                29%                37%                60%                  39%
      Nation1             55%                59%                38%                46%                66%                  38%
      1Data   is for the cohort graduating from high school in 2002 and graduating from a four-year institution by 2008.


Source: Alliance for Excellent Education, “Texas High School’s State Card”, 2011                              © E3 Alliance, 2012
The conclusions of this research do not necessarily reflect the opinions or official position of the Texas Education Agency,
                          the Texas Higher Education Coordinating Board, or the State of Texas.


               www.e3alliance.org/moreinfo

Central Texas Economy

  • 1.
    2012 Central TexasProfile Made possible through the investment of: www.e3alliance.org
  • 2.
    E3 Alliance RegionalScope of Work Source: Texas Education Agency, TxDOT, TNRIS © E3 Alliance, 2012
  • 3.
    Top 10 Manufacturesfor Central Texas Vrc Industries Source: Texas Workforce Commission, County Narrative Profile data, February 2012 © E3 Alliance, 2012
  • 4.
    Economics: Texas Highlights • The 129,000 high school dropouts from the Class of 2011 will cost the Texas economy $18 Billion in lost wages over their lifetimes* • If half of these students had graduated, they would provide Texas $61 million in increased annual state tax revenue* • If Texas’s high schools were to graduate all students ready for college, the state would likely save as much as $462 million in college remediation costs and lost earnings** *Source: Alliance for Excellent Education (Alliance), “The High Cost of High School Dropouts,” 2011 **Source: Alliance, “Saving Now and Saving Later,” 2011 © E3 Alliance, 2012
  • 5.
    CENTRAL TEXAS FACTS& FIGURES © E3 Alliance, 2012
  • 6.
    2010-11 School Year • 35 school districts – 479 schools – Serving 298,708 students • 15 charter organizations – 41 schools – Serving 6,983 students • 520 schools • 305,691 students Source: E3 Alliance analysis of AEIS data © E3 Alliance, 2012
  • 7.
    Migration into Texas • The population of Texas is over 25 million – 85% of population growth is due to new births – 15% of population growth is due to immigration • 74% of immigration comes from U.S.A. Texas Population Domestic Increase (2009 to 2010) International 0 150,000 300,000 450,000 600,000 750,000 Source: US Census Bureau, American Community Survey, 2010 © E3 Alliance, 2012
  • 8.
    Texas Immigration vs.Emigration Texas Immigration vs. Emigration 600,000 Number of People Moving 500,000 400,000 300,000 200,000 100,000 ??? 0 Other State Other Country Immigrants Emigrants Source: © E3 Alliance, 2012
  • 9.
    Central Texans HaveHigher Levels of Education than the State Average Educational Attainment, Texas vs. Central Texas Region, 2010 Texas Central Texas Less than College Less than HS, 13% Graduate, HS, 19% College 23% Graduate, 35% HS Graduate, 20% HS Some Graduate, College, 3 Some 26% 1% College, 3 2% Source: US Census Bureau American Community Survey, 2010 © E3 Alliance, 2012
  • 10.
    Educational Attainment isIncreasing Across Central Texas Educational Attainment for Adult Population, Central Texas 2003 2010 Less than Less than HS, 13% HS, 16% College College Graduate, Graduate, 37% 35% HS HS Graduate, Graduate, 20% 19% Some Some College, 2 College, 3 8% 2% Source: US Census Bureau American Community Survey © E3 Alliance, 2012
  • 11.
    CENTRAL TEXAS ECONOMY © E3 Alliance, 2012
  • 12.
    The Majority ofEmployed Workers are in Low-Wage Occupations Austin-Round Rock MSA Employment Statistics by Occupation Group, 2010 160,000 140,000 Number Employed 120,000 100,000 80,000 60,000 40,000 20,000 - Occupation Group Source: Texas Workforce Commission © E3 Alliance, 2012
  • 13.
    The Fastest GrowingCareers Requiring 2-Year Degrees are in the Medical Fields Source: Texas Comptroller of Public Accounts, Every Chance Every Texas website, 2011 © E3 Alliance, 2012
  • 14.
    Statewide Projected JobGrowth, By Cluster Information and Computer Petroleum and Chemical Products Energy Biotechnology and Life Sciences Advanced Technologies and Manufacturing Aerospace and Defense -15% -10% -5% 0% 5% 10% 15% 20% 25% 30% 2001-2011 2008-2018 Source: Texas Workforce Commission © E3 Alliance, 2012
  • 15.
    43 Targeted Occupationsin Texas • Projected high employment demand due to industry growth or employee turnover from 2008 to 2018 (employment for these occupations is expected to increase 23%) – 20 out of 43 are in the STEM fields – Educational requirements; typical salary range: • 3 Work experience in a related occupation; $32K-57K • 6 On-the-job training; $33K-67K • 6 Associates degrees or vocational certificates; $40-$64 • 28 Bachelor degree or higher; $48K-$94K Source: Texas Workforce Commission © E3 Alliance, 2012
  • 16.
    Unemployment Rate 0% 2% 4% 6% 8% 10% 12% 2001 Jun 2001 Sep 2001 Dec 2002 Mar 2002 Jun 2002 Sep 2002 Dec 2003 Mar 2003 Jun 2003 Sep 2003 Dec 2004 Mar 2004 Jun 2004 Sep MSA Unemp. Rate 2004 Dec 2005 Mar 2005 Jun 2005 Sep 2005 Dec 2006 Mar 2006 Jun Source: Texas Comptroller of Public Accounts, Texas Ahead website, 2011 2006 Sep 2006 Dec TX Unemp. Rate 2007 Mar 2007 Jun 2007 Sep 2007 Dec 2008 Mar 2008 Jun 2008 Sep Austin-Round Rock-San Marcos MSA 2008 Dec US Unemp. Rate 2009 Mar 2009 Jun 2009 Sep 2009 Dec 2010 Mar Unemployment Rates Compared to Texas and United States 2010 Jun 2010 Sep 2010 Dec 2011 Mar © E3 Alliance, 2012 2011 Jun
  • 17.
    Unemployment Rates Declinewith Educational Attainment 16 US Unemployment Rate by Educational Attainment 14 12 Unemployment Rate 10 8 6 4 2 0 2001 2002 2003 2004 2005 2006 2007 2008 2009 2010 2011 Less than High School Degree High School Degree Some College or Associate's Degree Bachelor's Degree or higher Source: U.S. Department of Labor © E3 Alliance, 2012
  • 18.
    Texas Below theNational Average for Unemployment at All Levels of Education 16% Unemployment Rate for Persons Age 25 and Older, 2010 14% 14.9% Unemployment Rate 12% 10% 10.6% 10.3% 9.1% 8% 8.4% 7.4% 6% 4% 4.7% 4.1% 2% 0% Less than High High School Some College or Bachelor's degree School graduate graduate Associate's degree or higher US Texas Source: US Department of Labor and Census Bureau © E3 Alliance, 2012
  • 19.
    CENTRAL TEXAS WORKFORCE © E3 Alliance, 2012
  • 20.
    High School GraduationRates All White Black Hispanic Asian American Students Indian Central Texas Texas 67% 76% 59% 58% 89% 52% Nation 72% 78% 57% 58% 83% 54% Source: Alliance for Excellent Education, “Texas High School’s State Card”, 2011 © E3 Alliance, 2012
  • 21.
    Four-Year College GraduationRates All White Black Hispanic Asian American Students Indian Texas1 49% 57% 29% 37% 60% 39% Nation1 55% 59% 38% 46% 66% 38% 1Data is for the cohort graduating from high school in 2002 and graduating from a four-year institution by 2008. Source: Alliance for Excellent Education, “Texas High School’s State Card”, 2011 © E3 Alliance, 2012
  • 22.
    The conclusions ofthis research do not necessarily reflect the opinions or official position of the Texas Education Agency, the Texas Higher Education Coordinating Board, or the State of Texas. www.e3alliance.org/moreinfo

Editor's Notes

  • #2 SD Starts Off
  • #4 These were takes from the 8 County Profile created from Socrates (2/15/12) cmb
  • #5 Dropouts from 2011 will cost $18B. http://www.all4ed.org/files/Texas_hs.pdf
  • #9 This slide needs a DATE!! And what the source is!Emigration is 84.6% of Immigration.
  • #10 ACS Survey too???
  • #11 Source:ACSHS grads include GED, Some college includes AA degrees, College Grads includes bacc and post-bacc.
  • #13 Is the source the TWC – is this correct?Office and Administrative SupportSales and Related Food Preparation and Serving RelatedEducation, Training and Library Occupations
  • #14 http://www.everychanceeverytexan.org/texasjobs/
  • #15 http://www.texasindustryprofiles.com/apps/swap/asp/naicIndex.asp
  • #16 http://www.texasindustryprofiles.com/apps/swap/asp/socTable.asp
  • #17 http://www.texasahead.org/economy/forecasts/fcst0910/fiscalSummary.html -- Projections
  • #21 http://www.all4ed.org/files/Texas_hs.pdf
  • #22 Data is for the cohort graduating from high school in 2002 and graduating from a four-year institution by 2008.http://www.all4ed.org/files/Texas_hs.pdf