Downloaded 19 times

This document discusses health indicators and provides information on various types of indicators used to measure health. It begins by defining health indicators as variables that reflect the health status of a community. It then covers the characteristics of good indicators, their uses, and various ways to classify indicators such as by mortality, morbidity, disability, nutrition, and health care delivery. Specific examples of indicators are given for Sudan, including crude death rate and infant mortality rate. The document emphasizes that indicators should be valid, reliable, sensitive, specific, feasible, and relevant.
Introduction of health indicators and objectives for the session.
Define health indicators and their characteristics, based on WHO's definition of health.
Health indicators must be valid, reliable, sensitive, specific, feasible, and relevant.
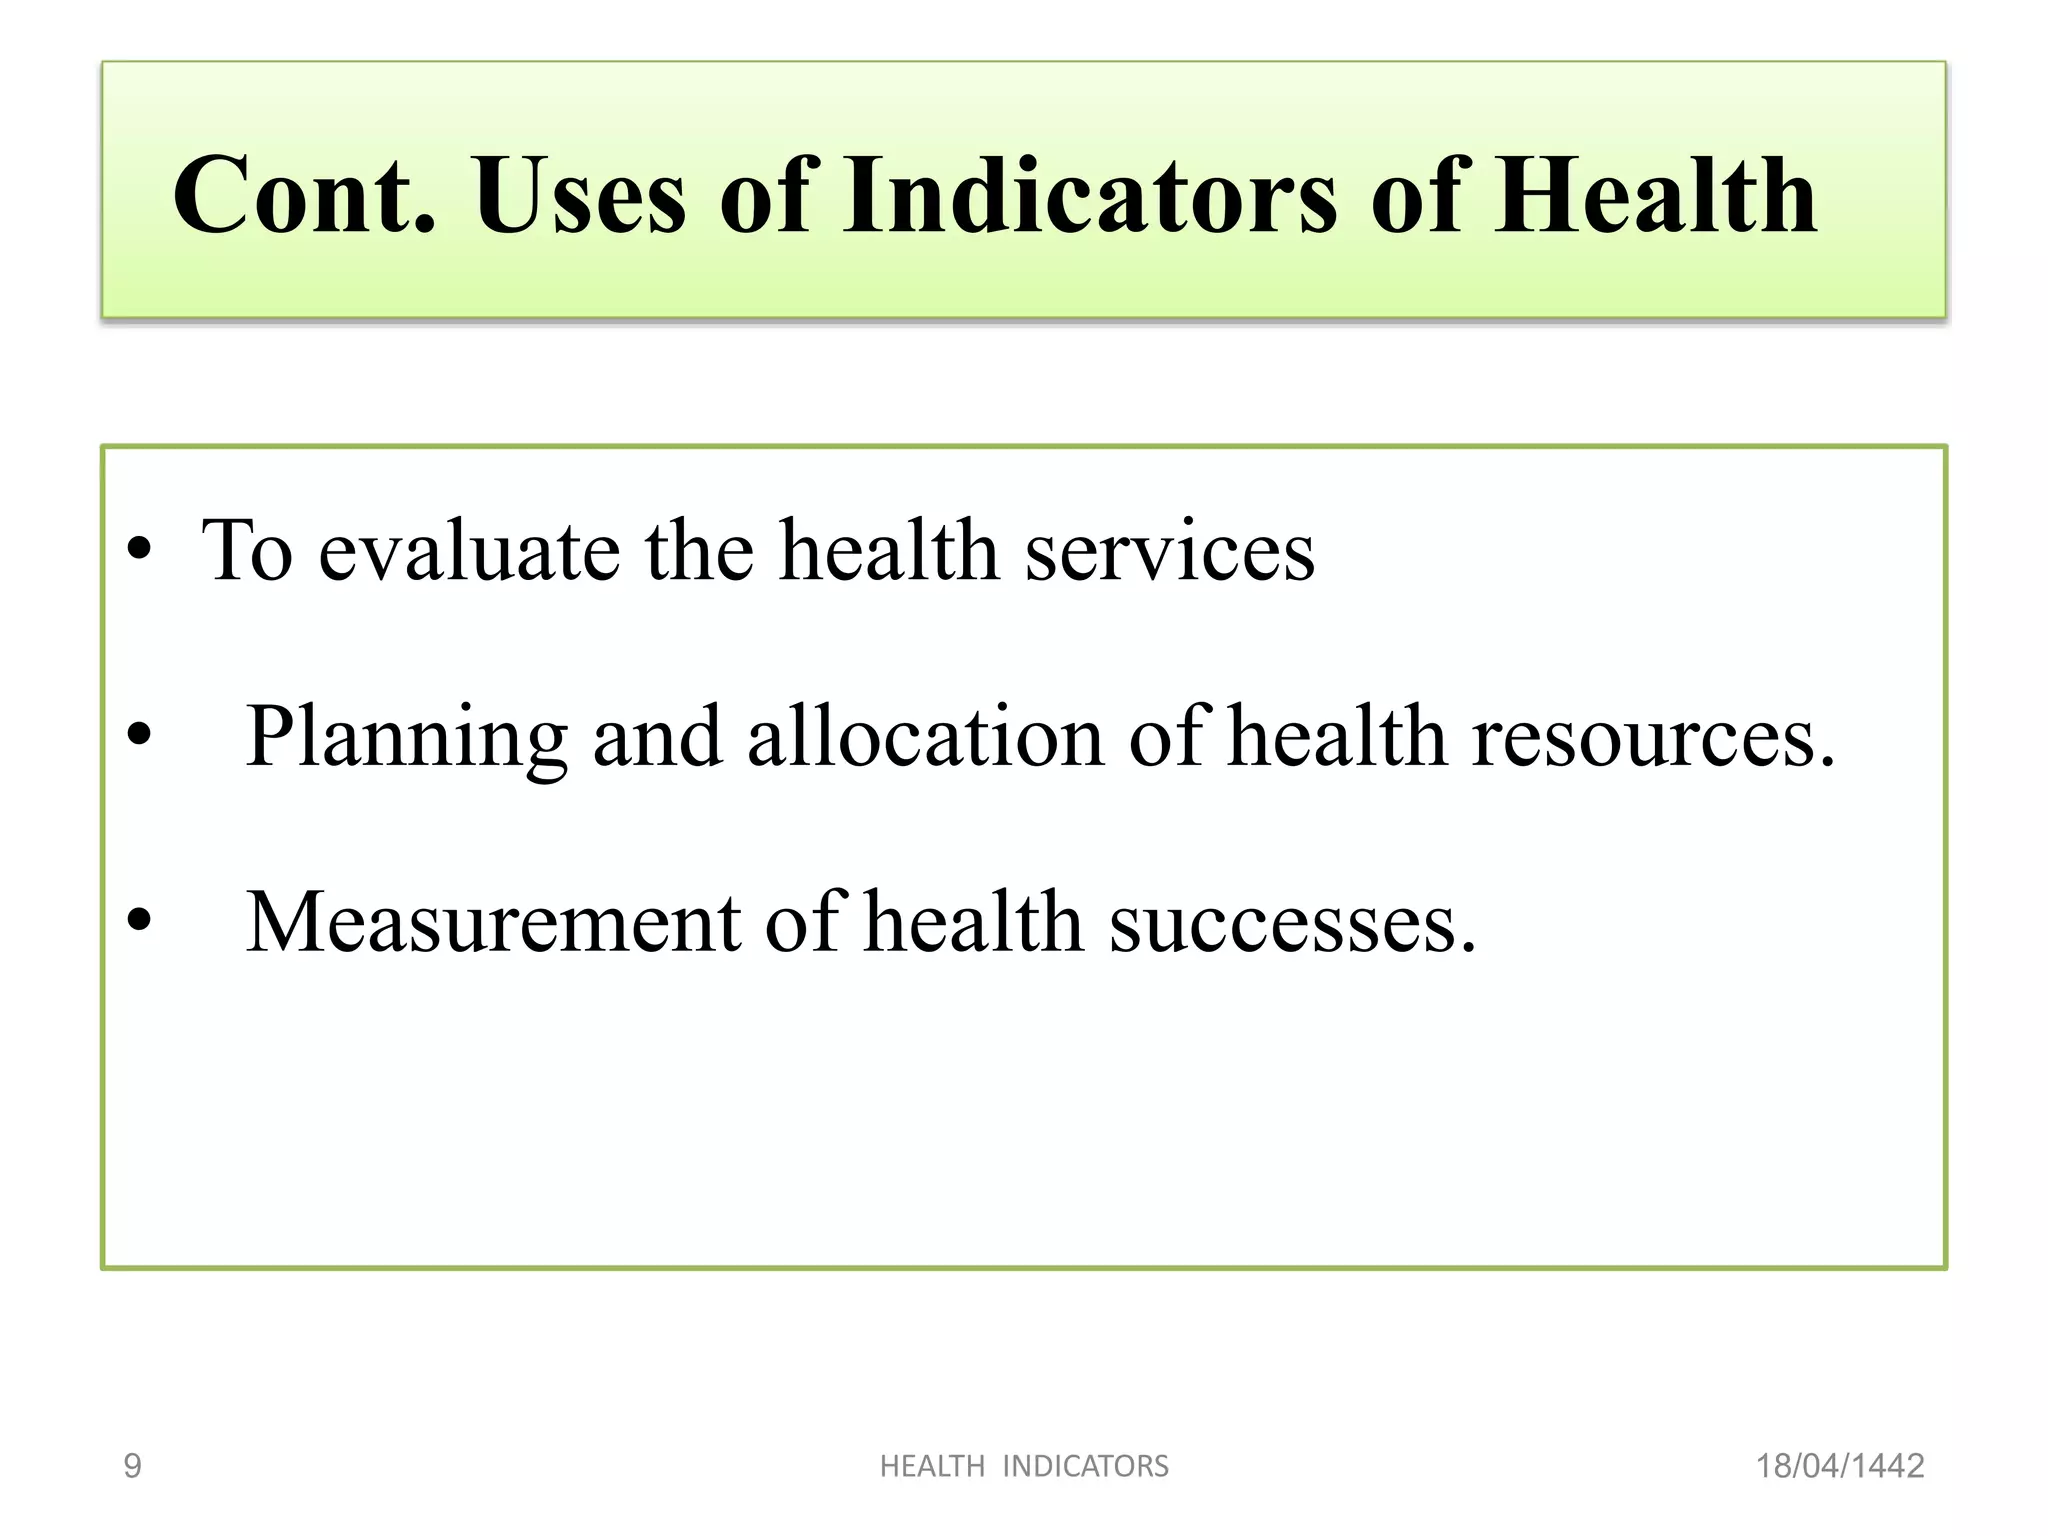
Indicators are used to measure, describe, compare health, assess needs, evaluate services, and plan resources.
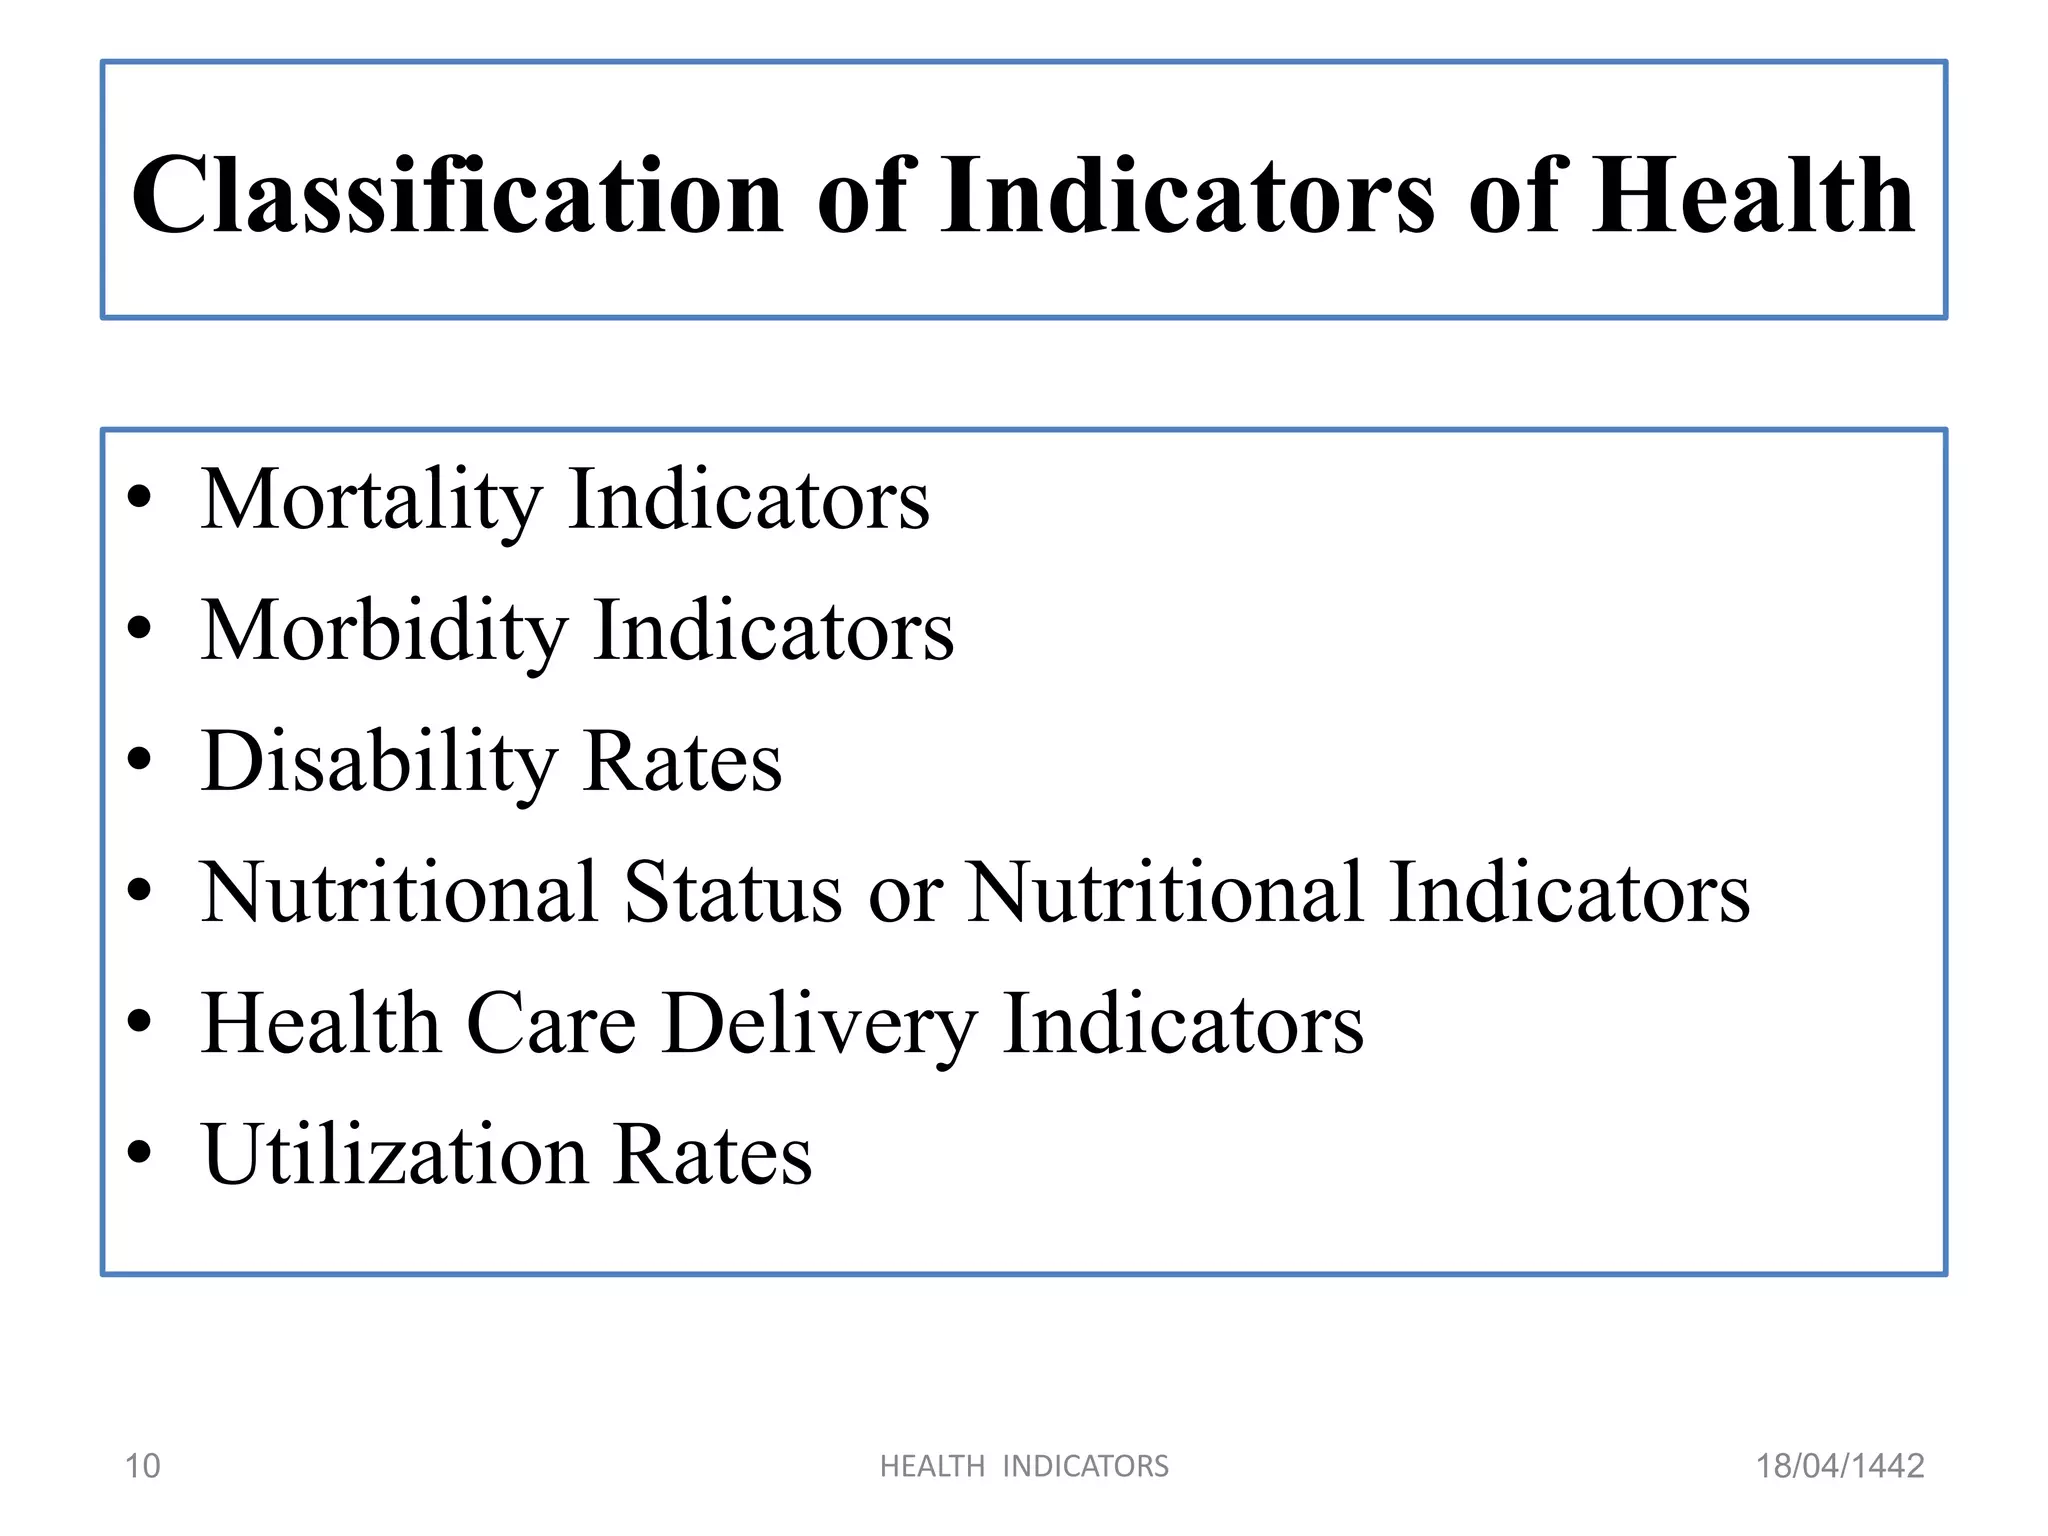
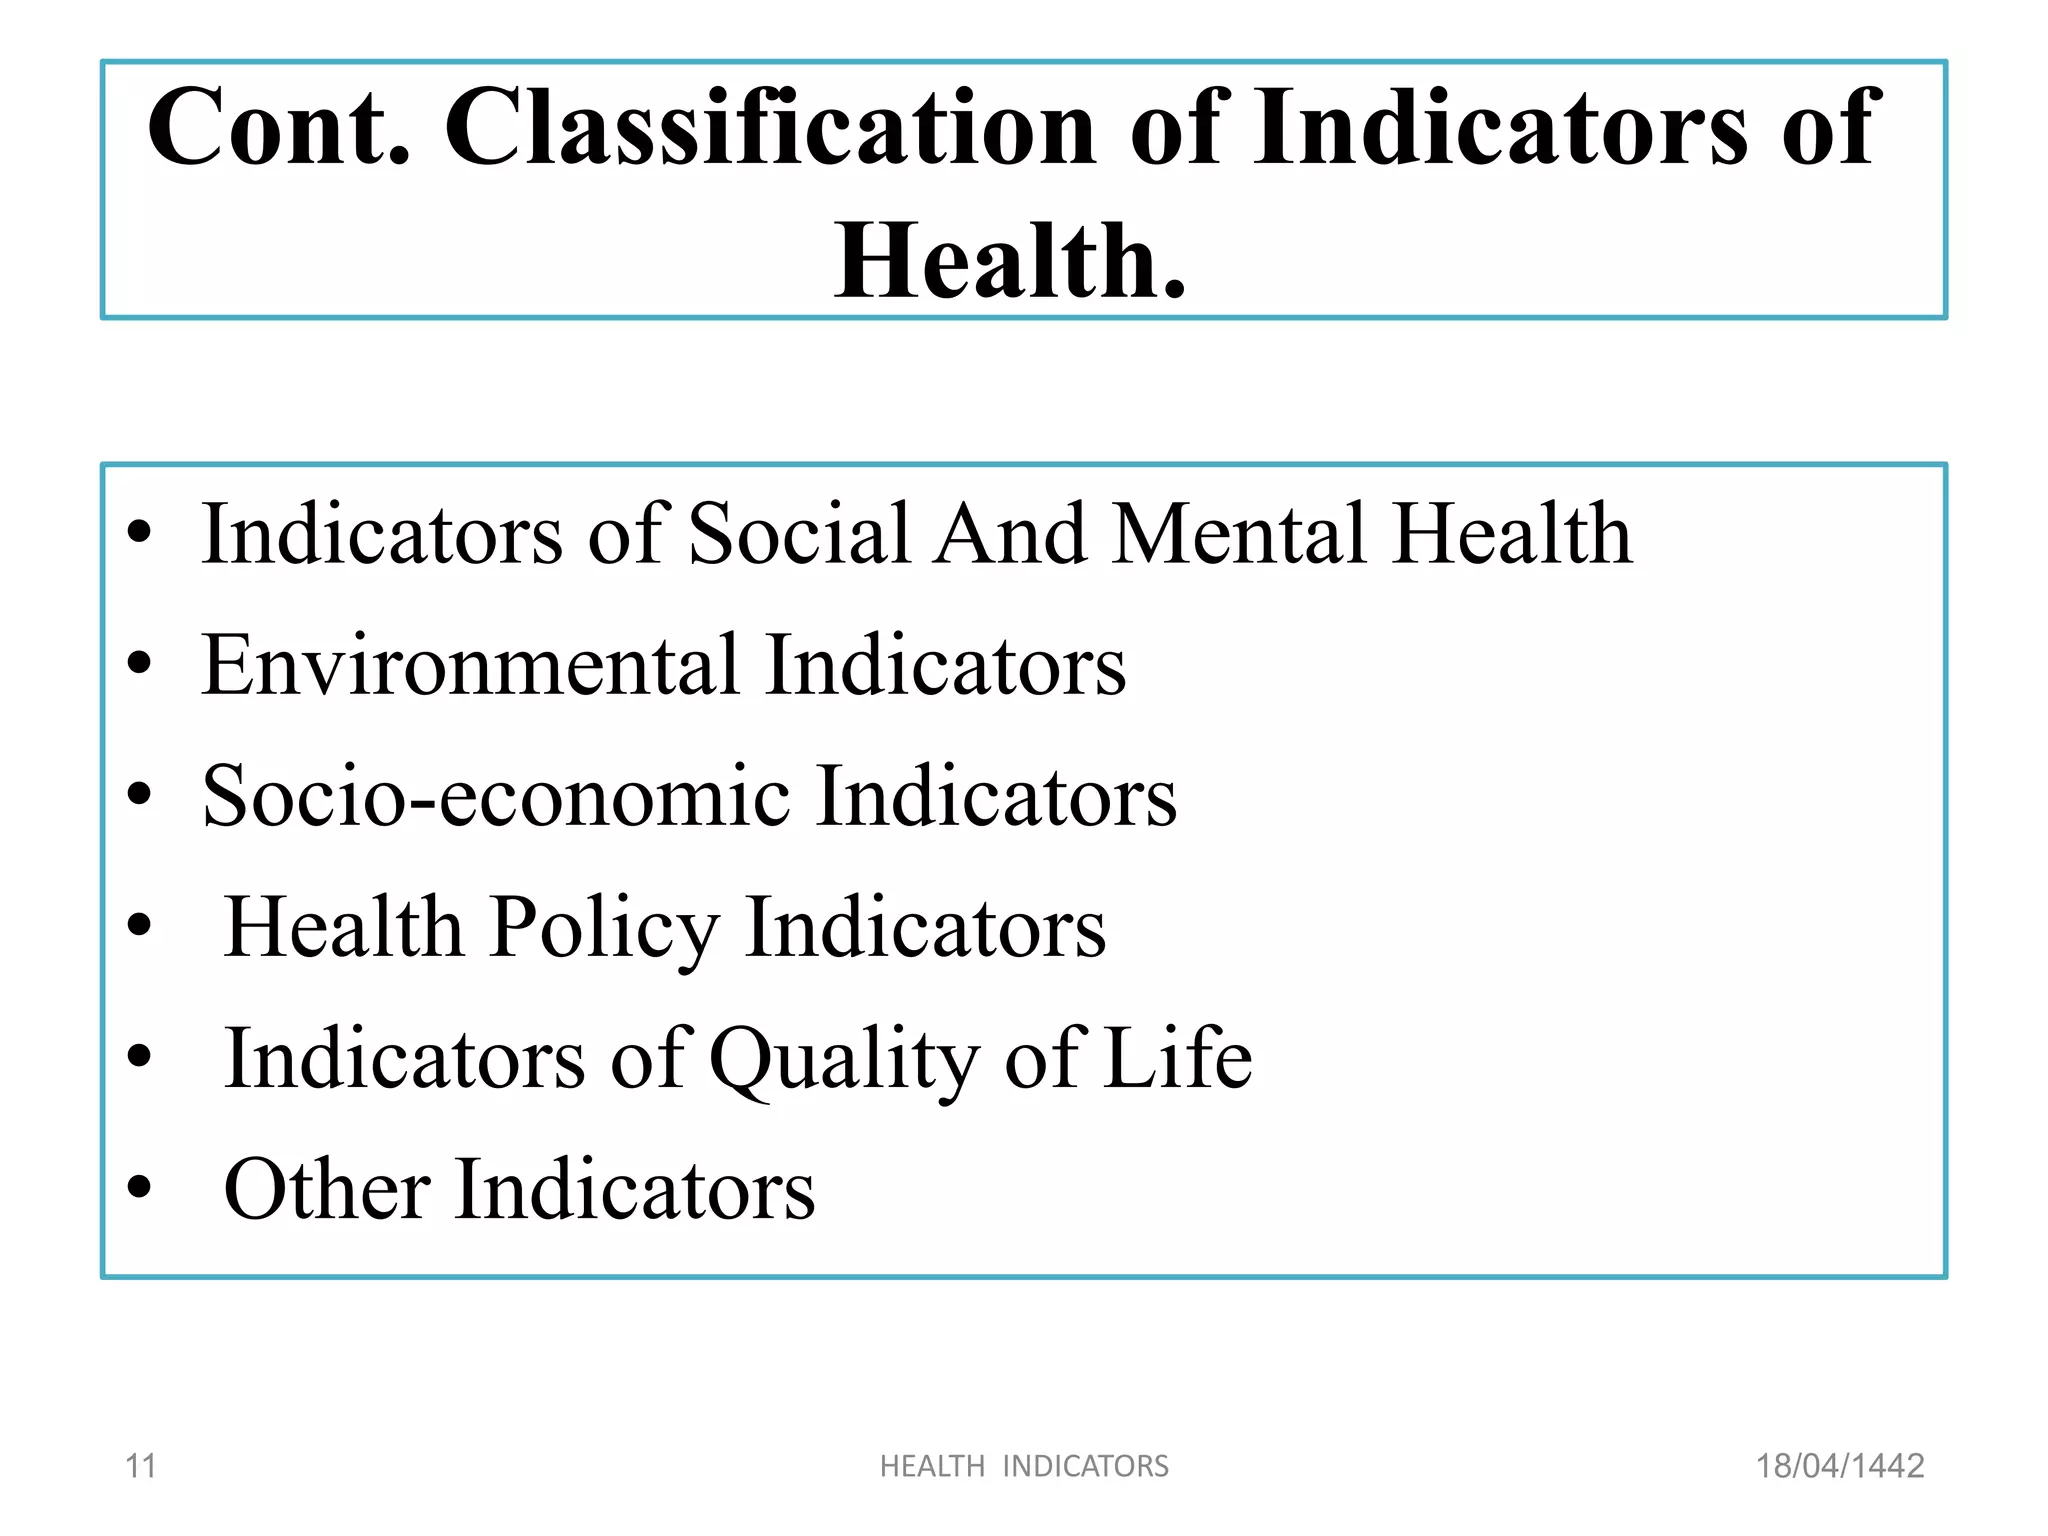
Health indicators are classified into mortality, morbidity, disability rates, nutritional status, health care delivery, social health, and quality of life.
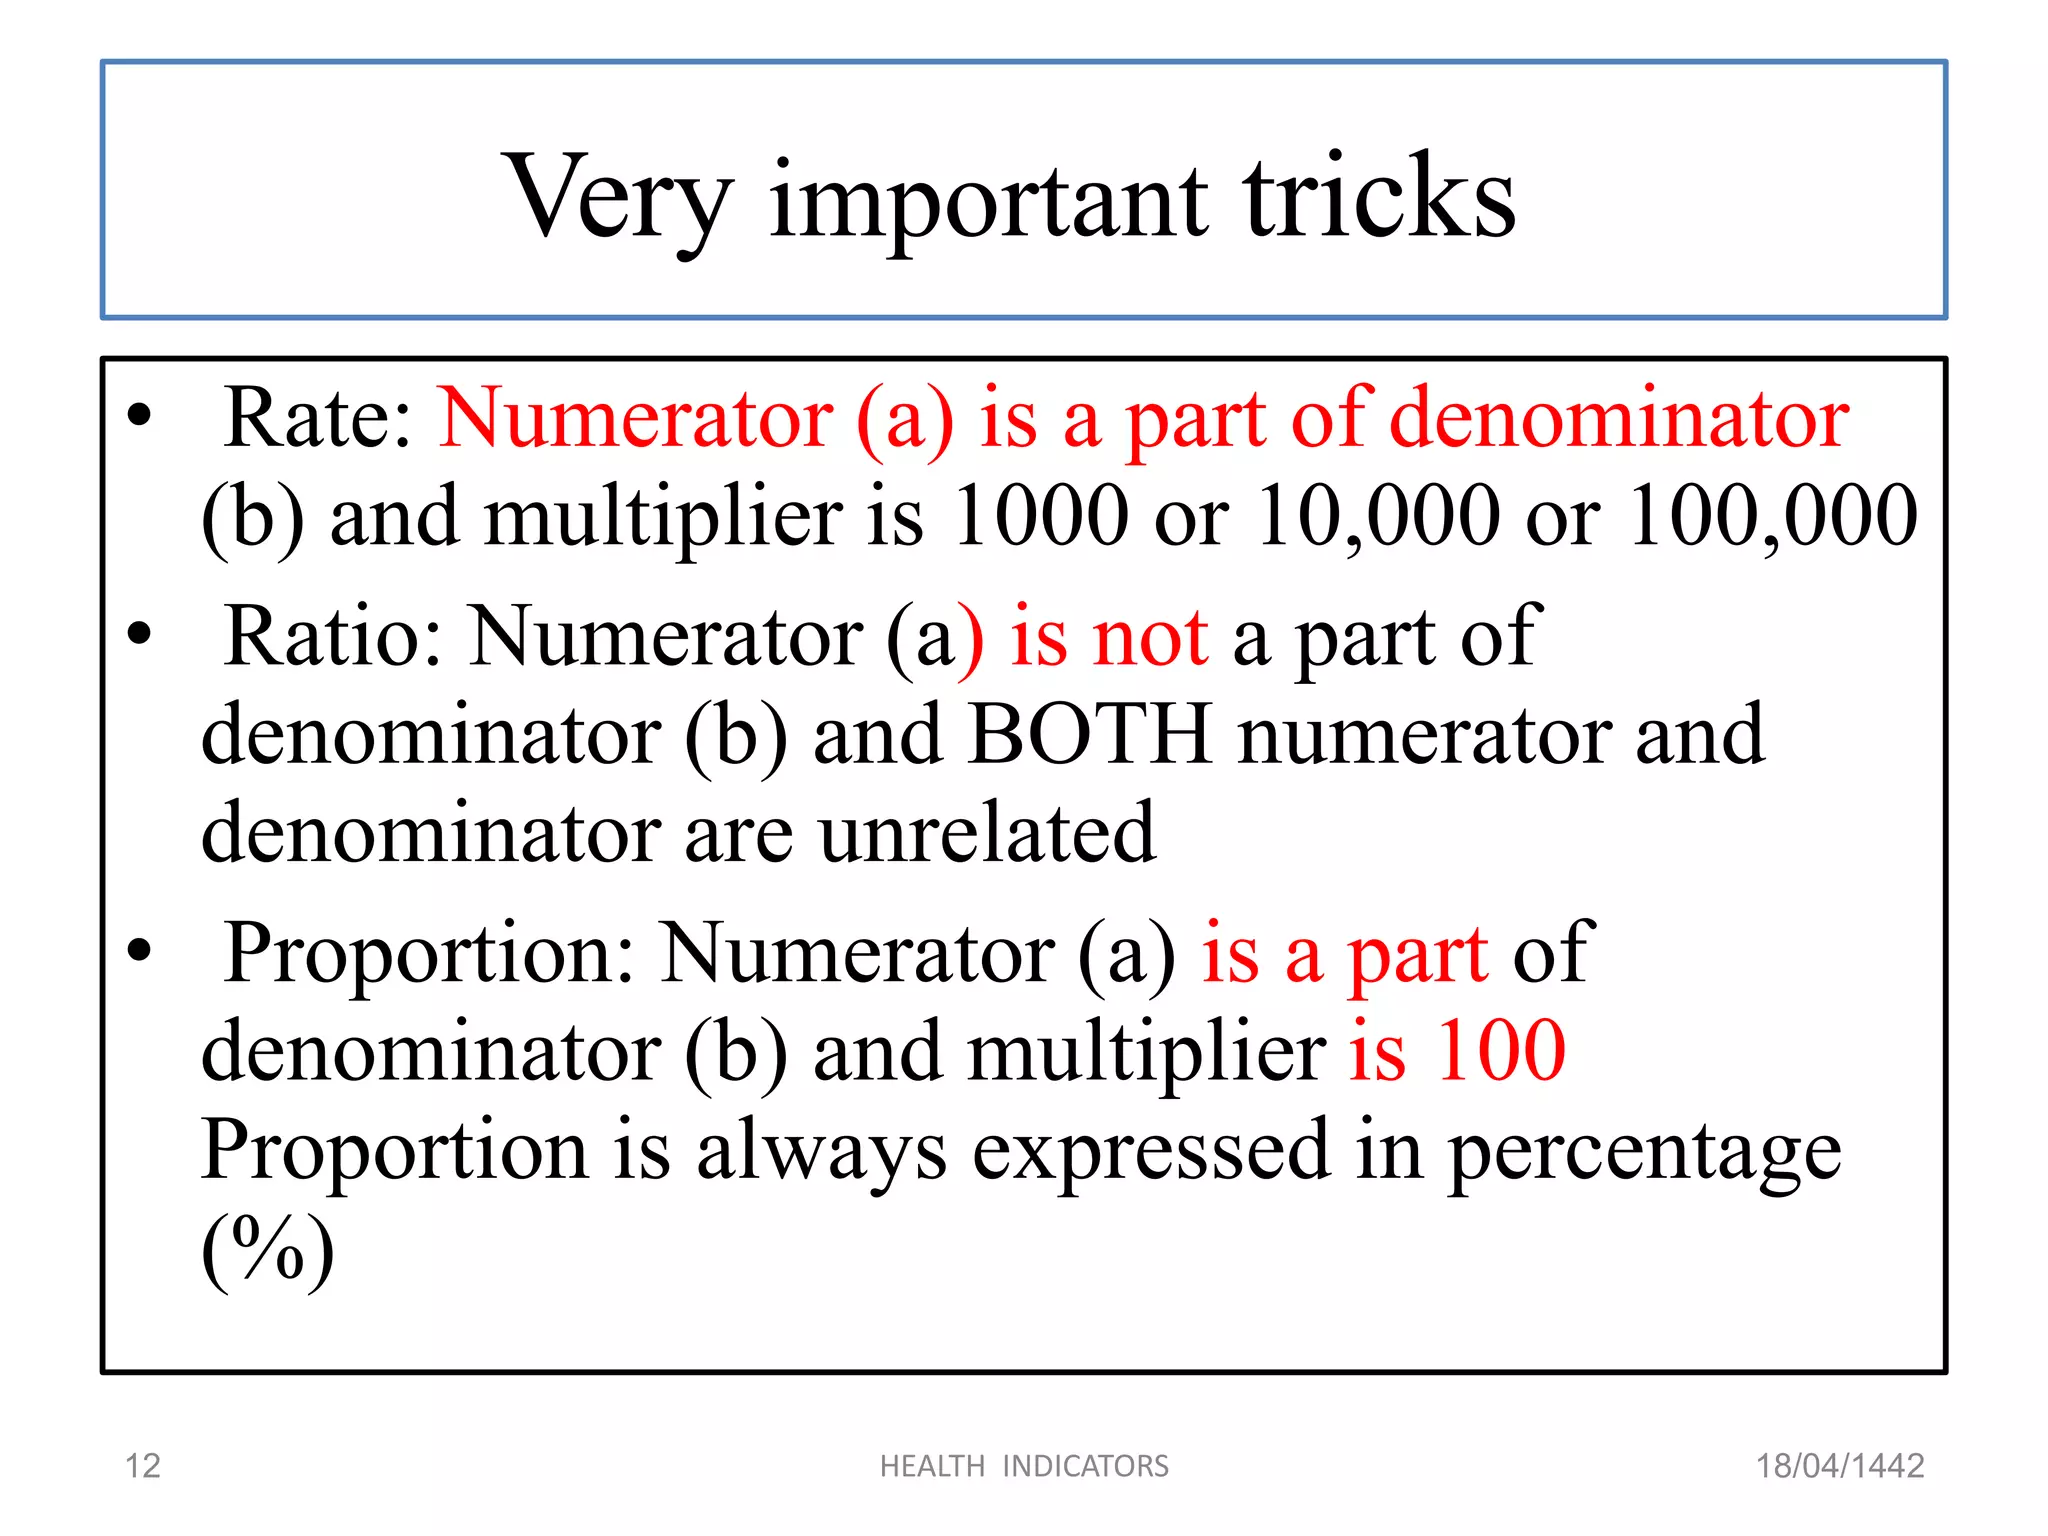
Definitions of rate, ratio, and proportion as they relate to health indicators.
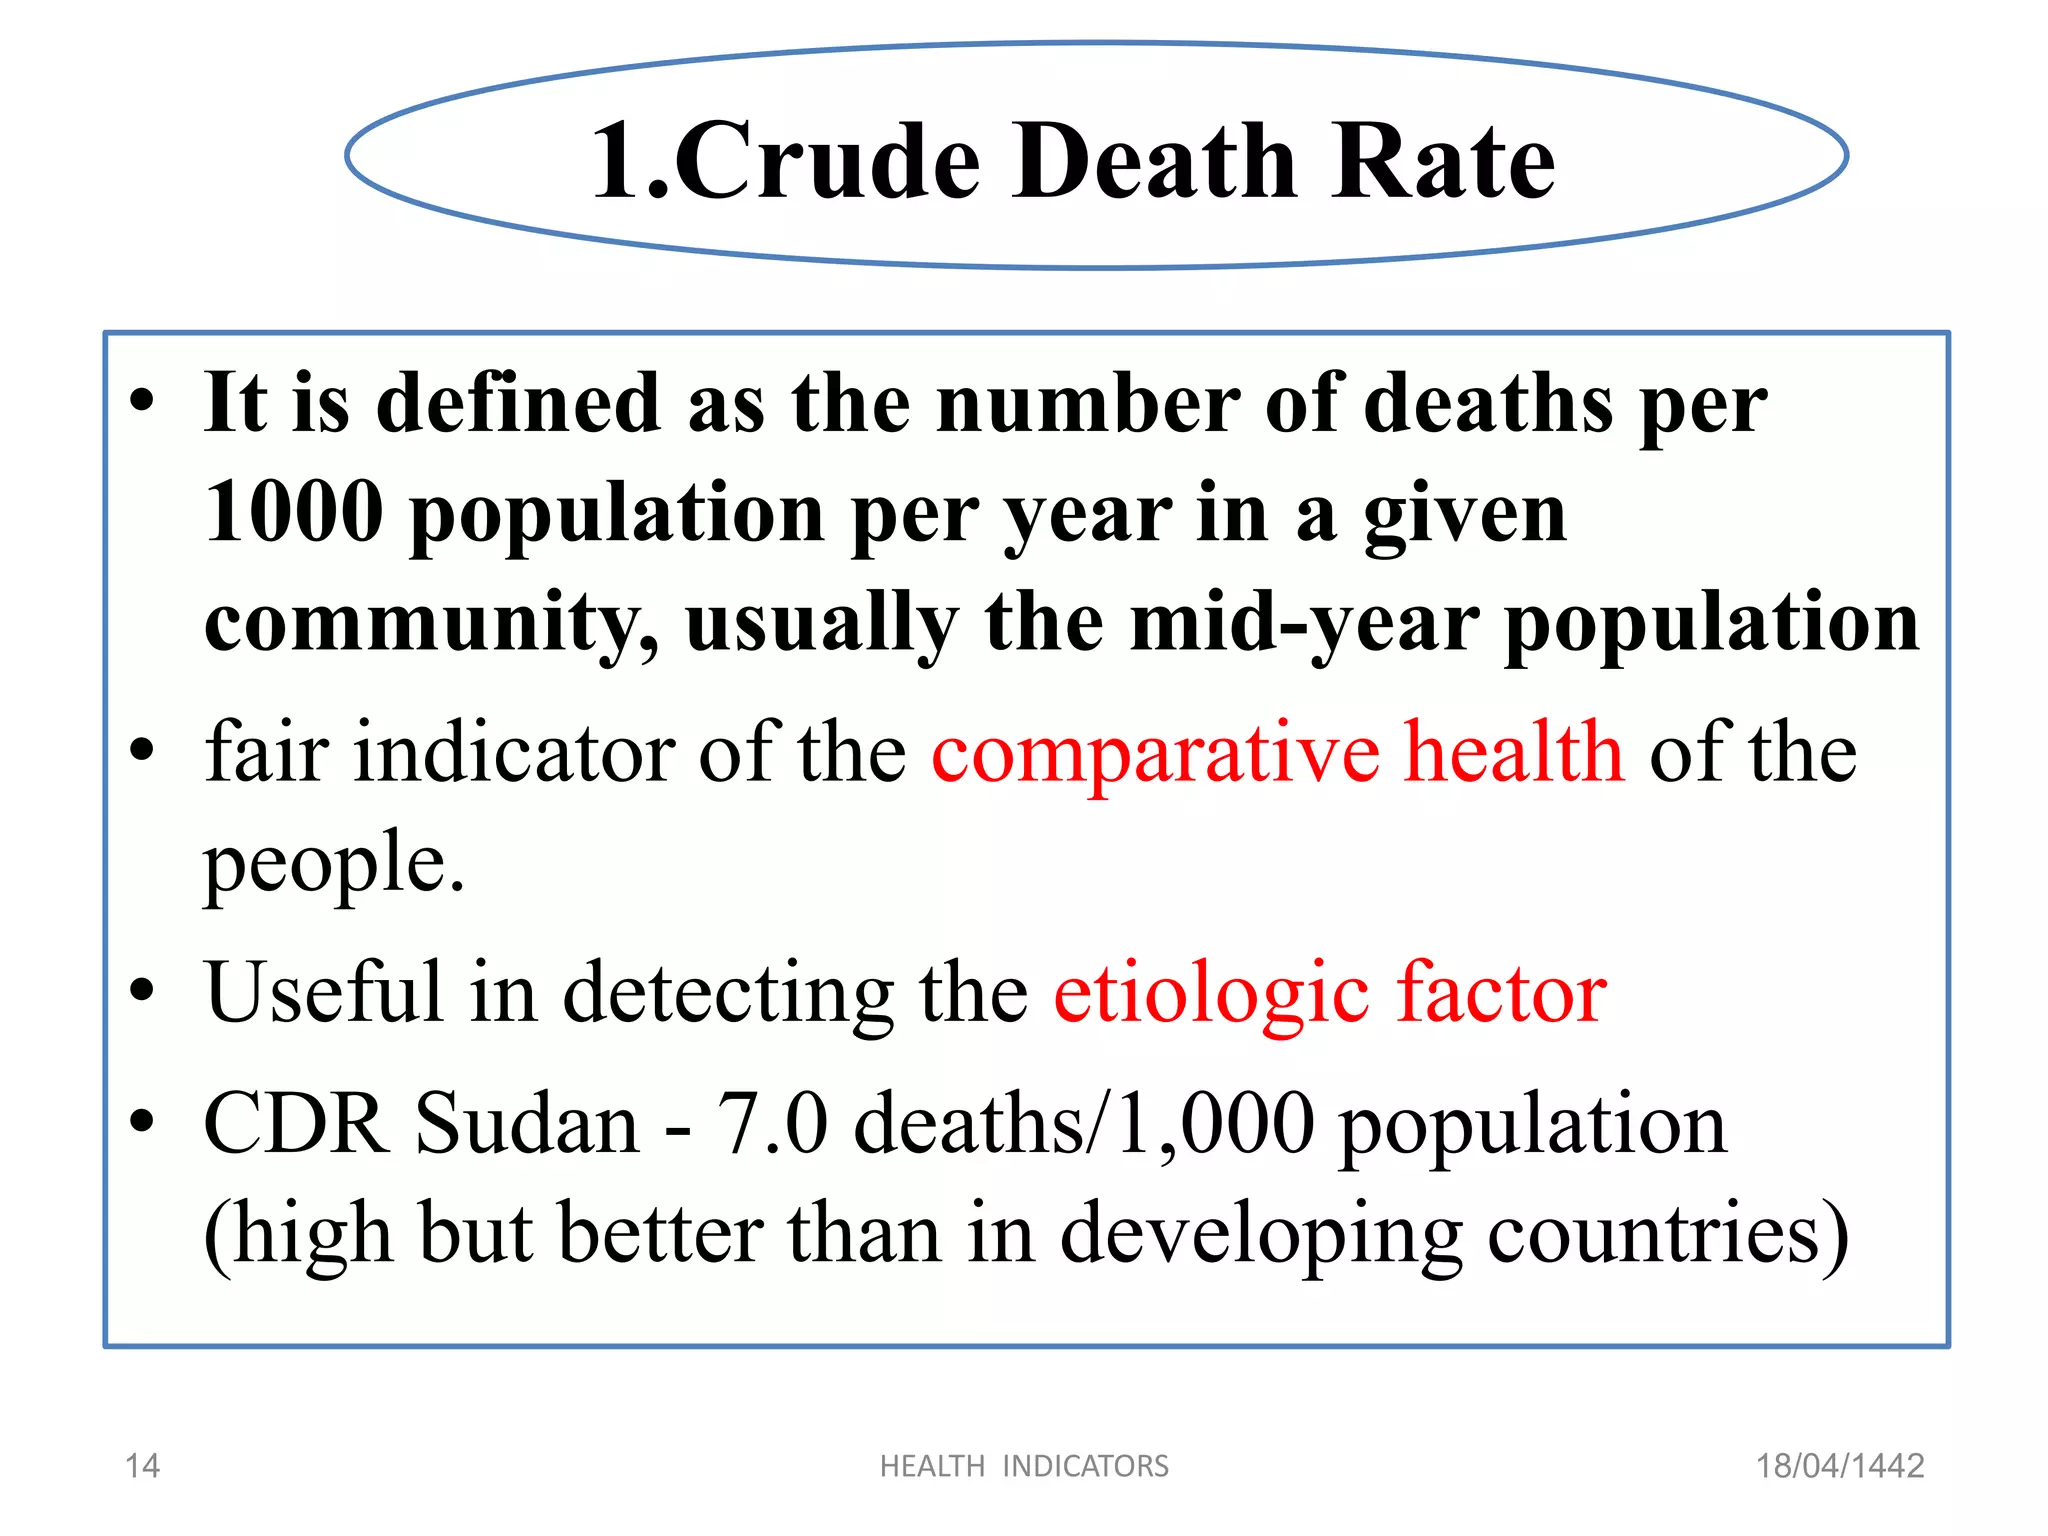
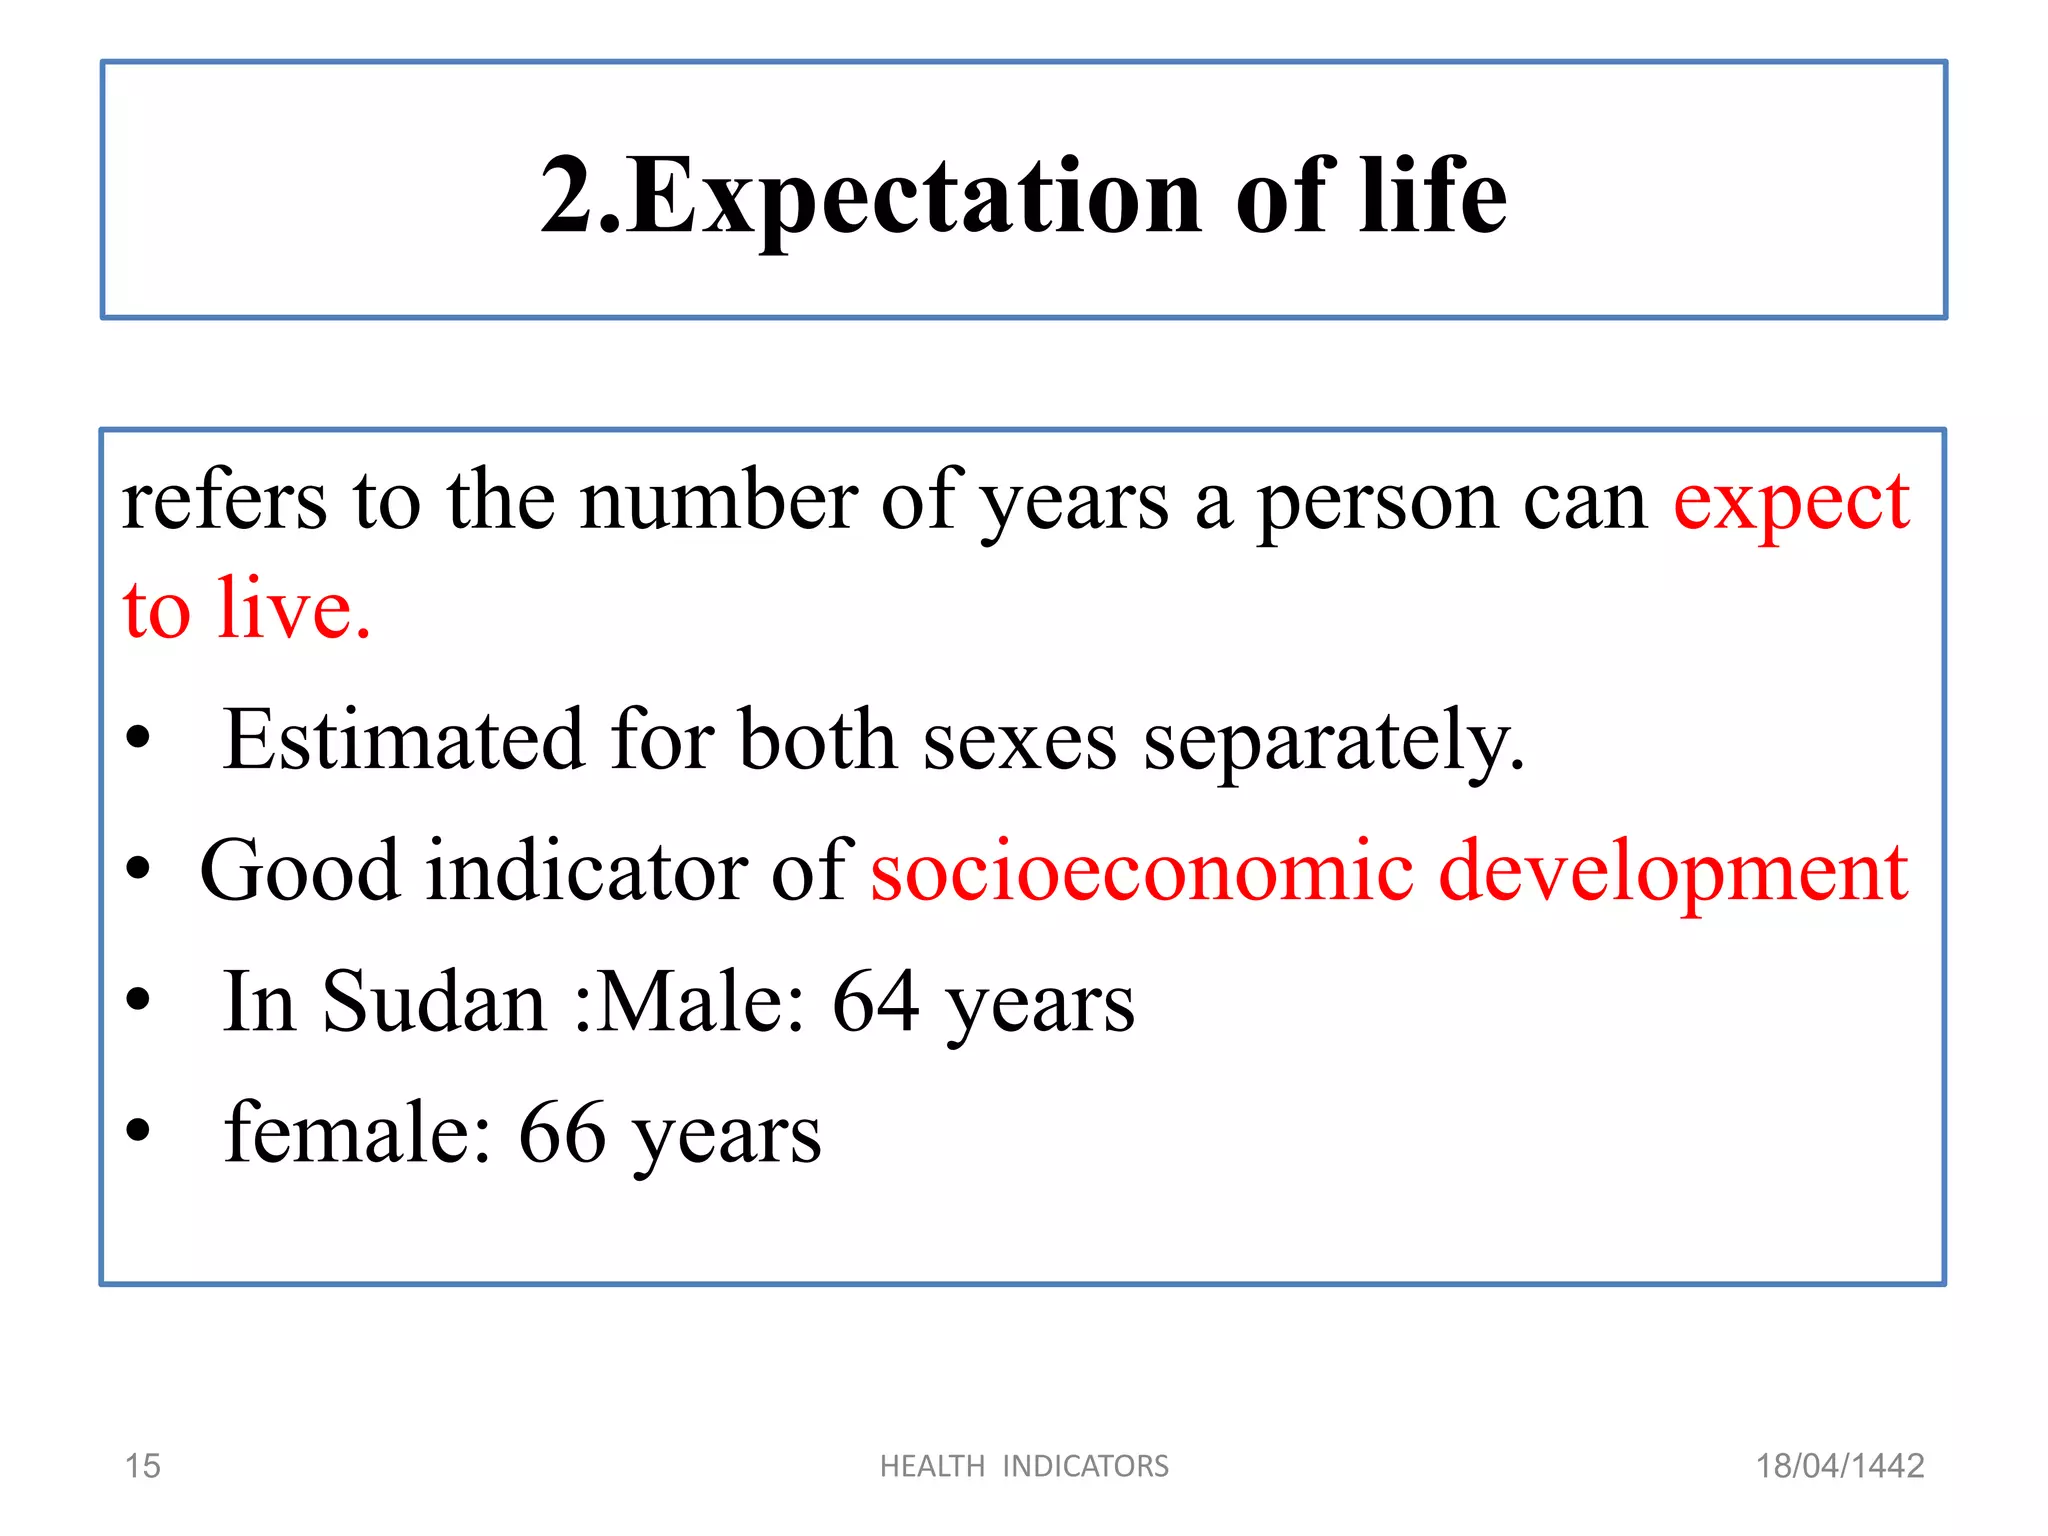
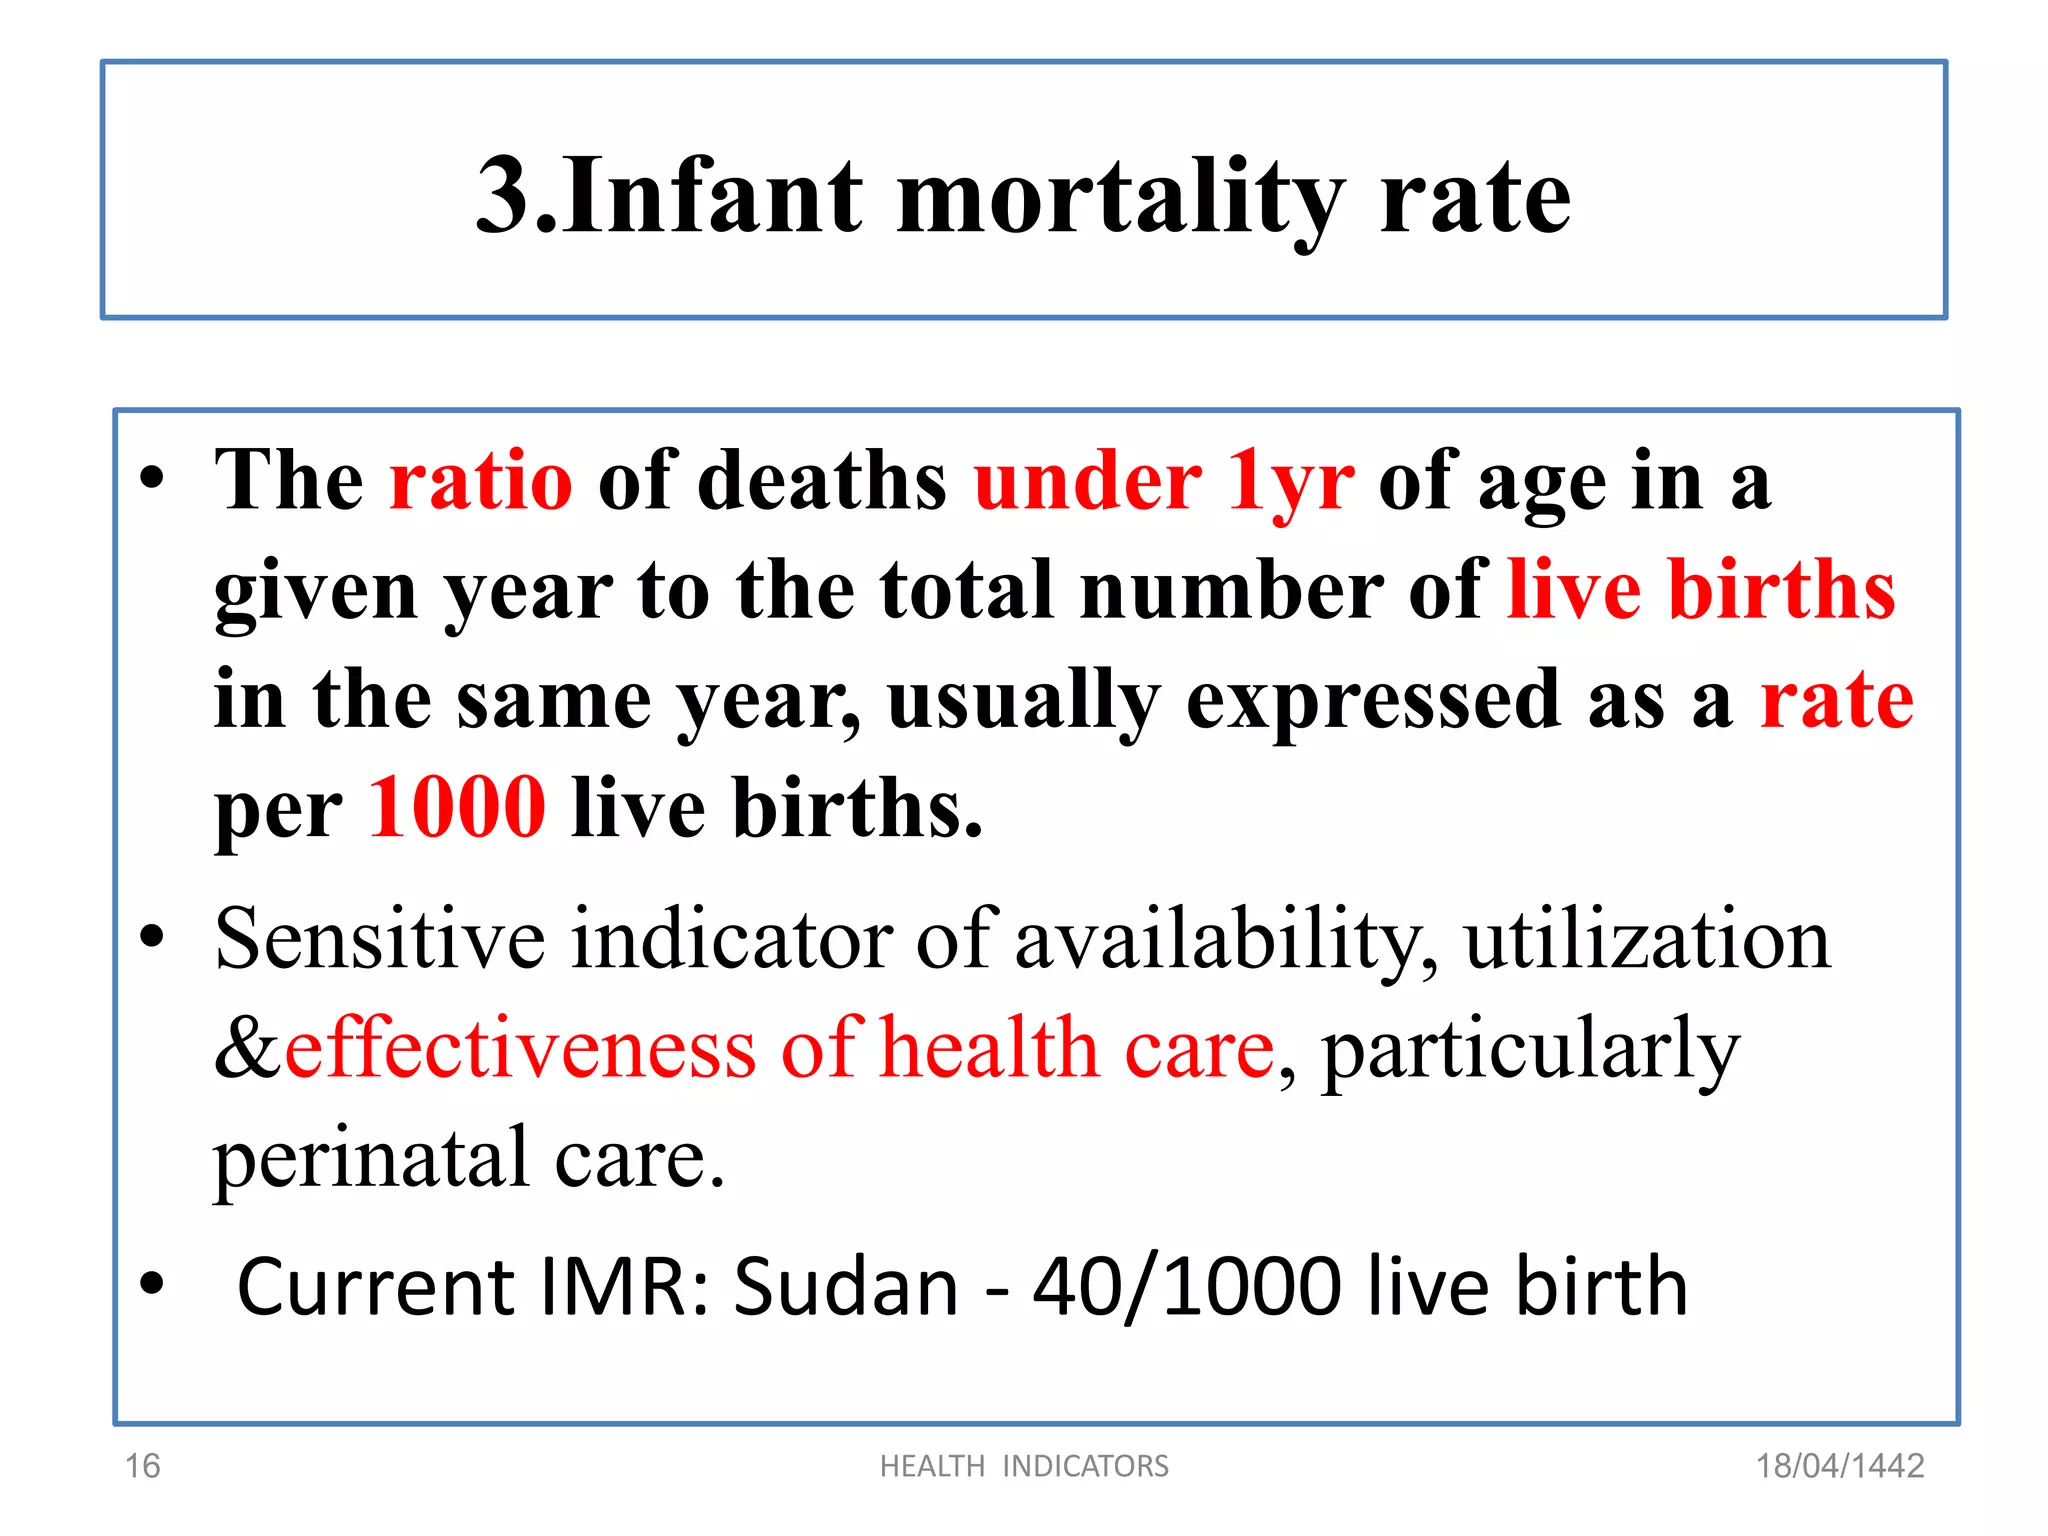
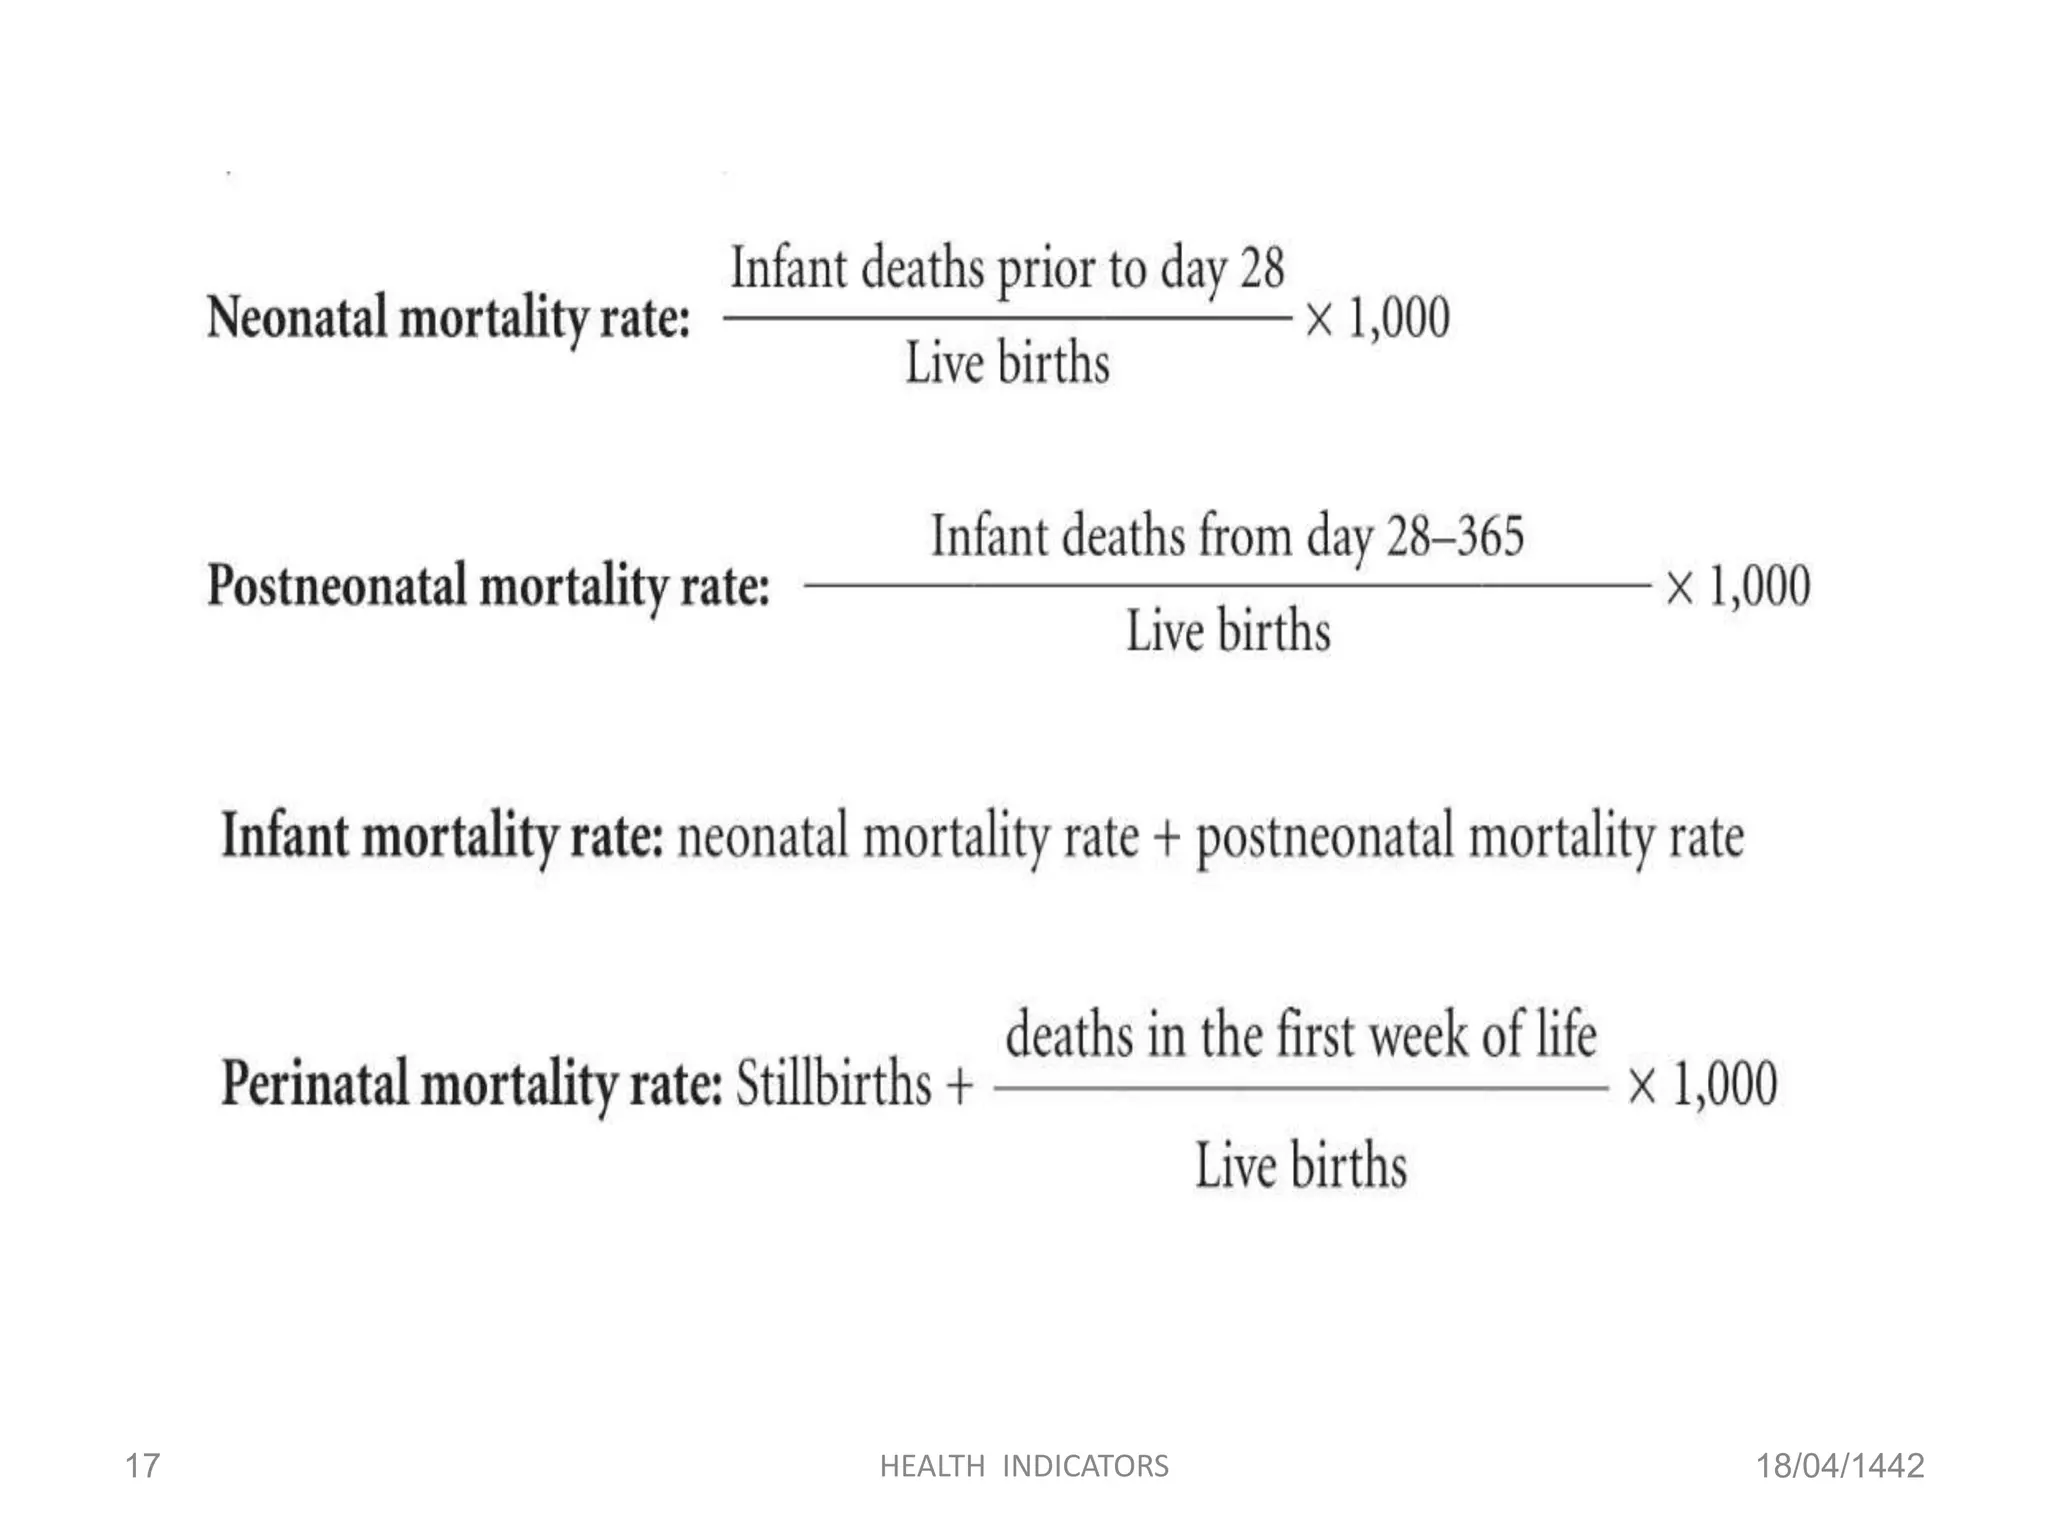
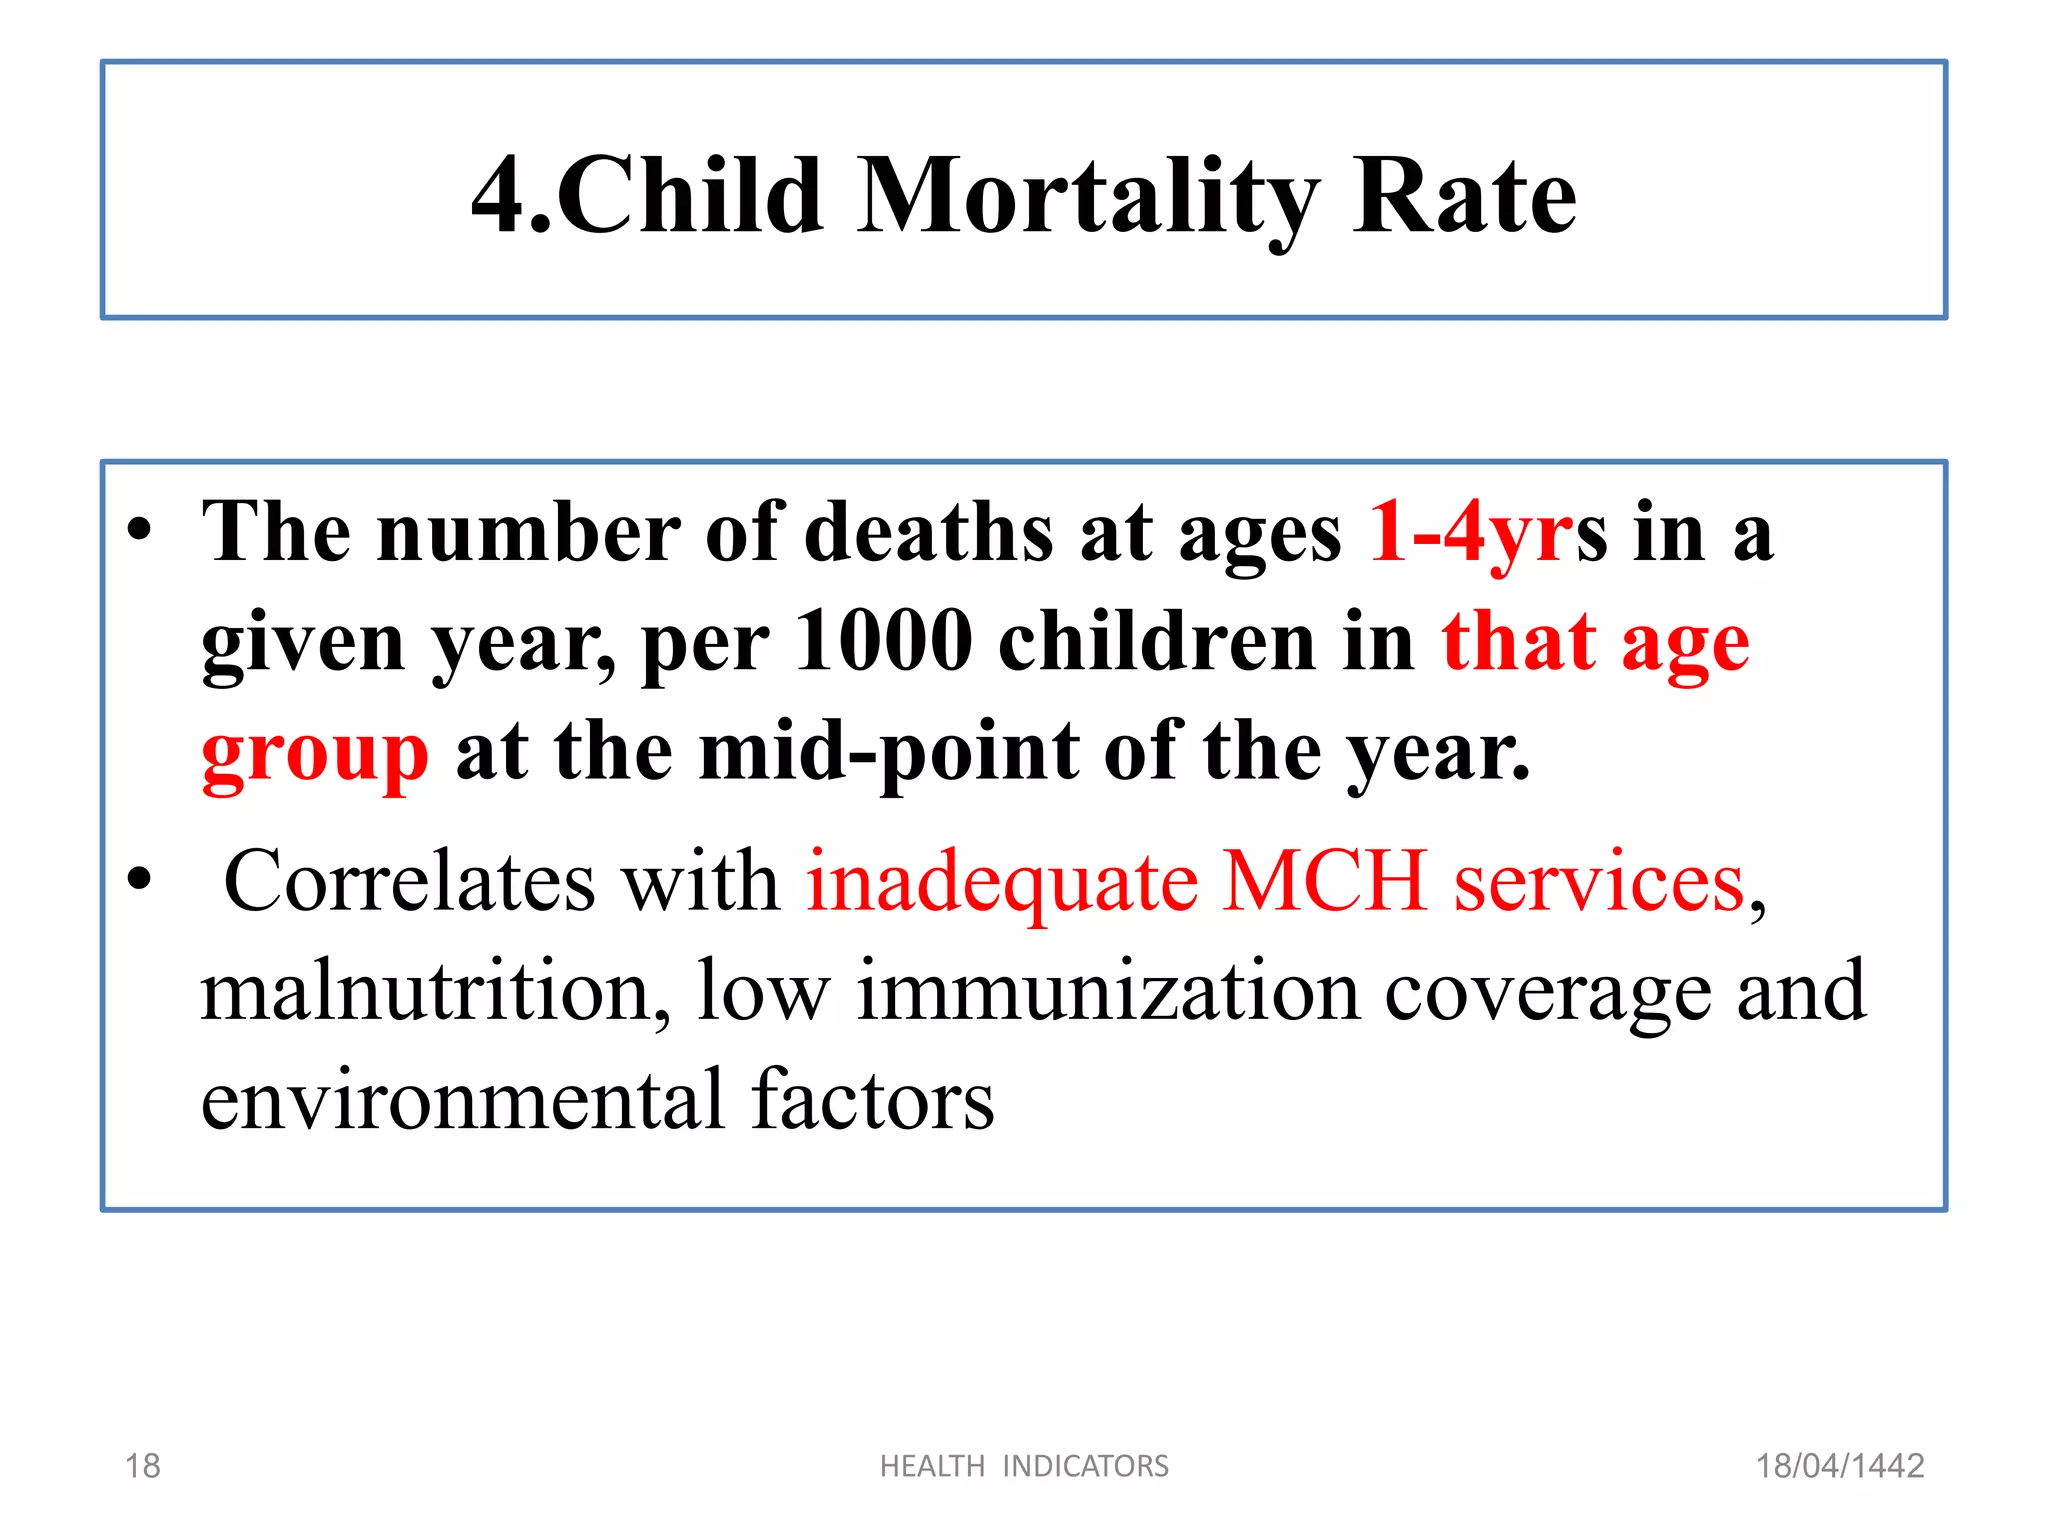
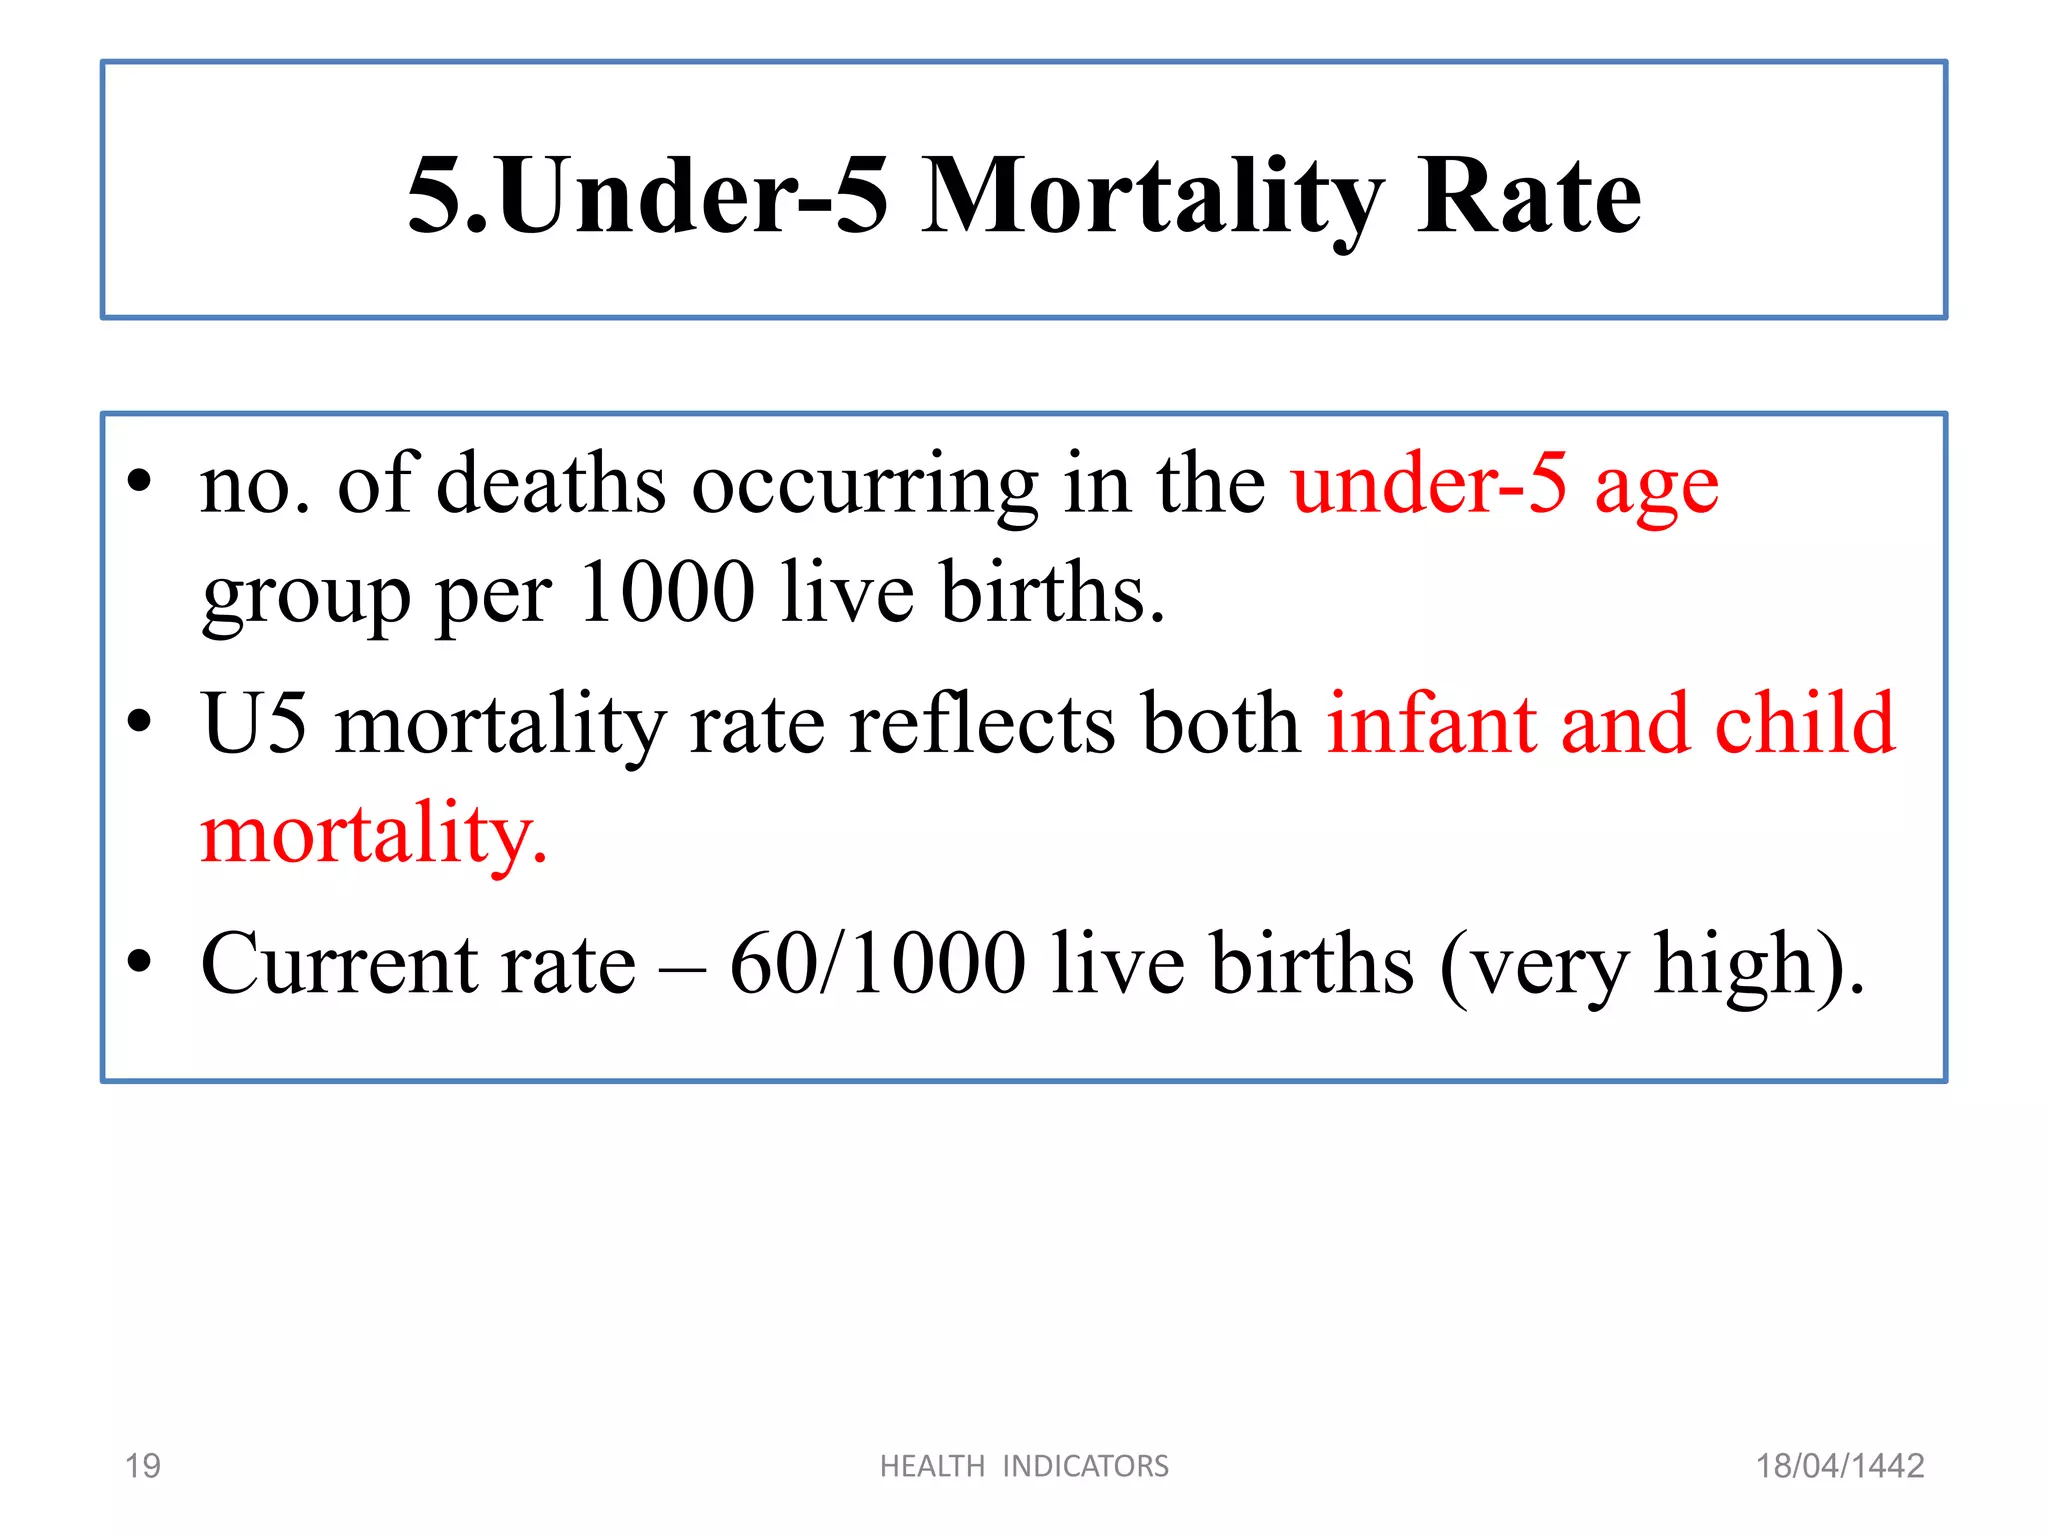
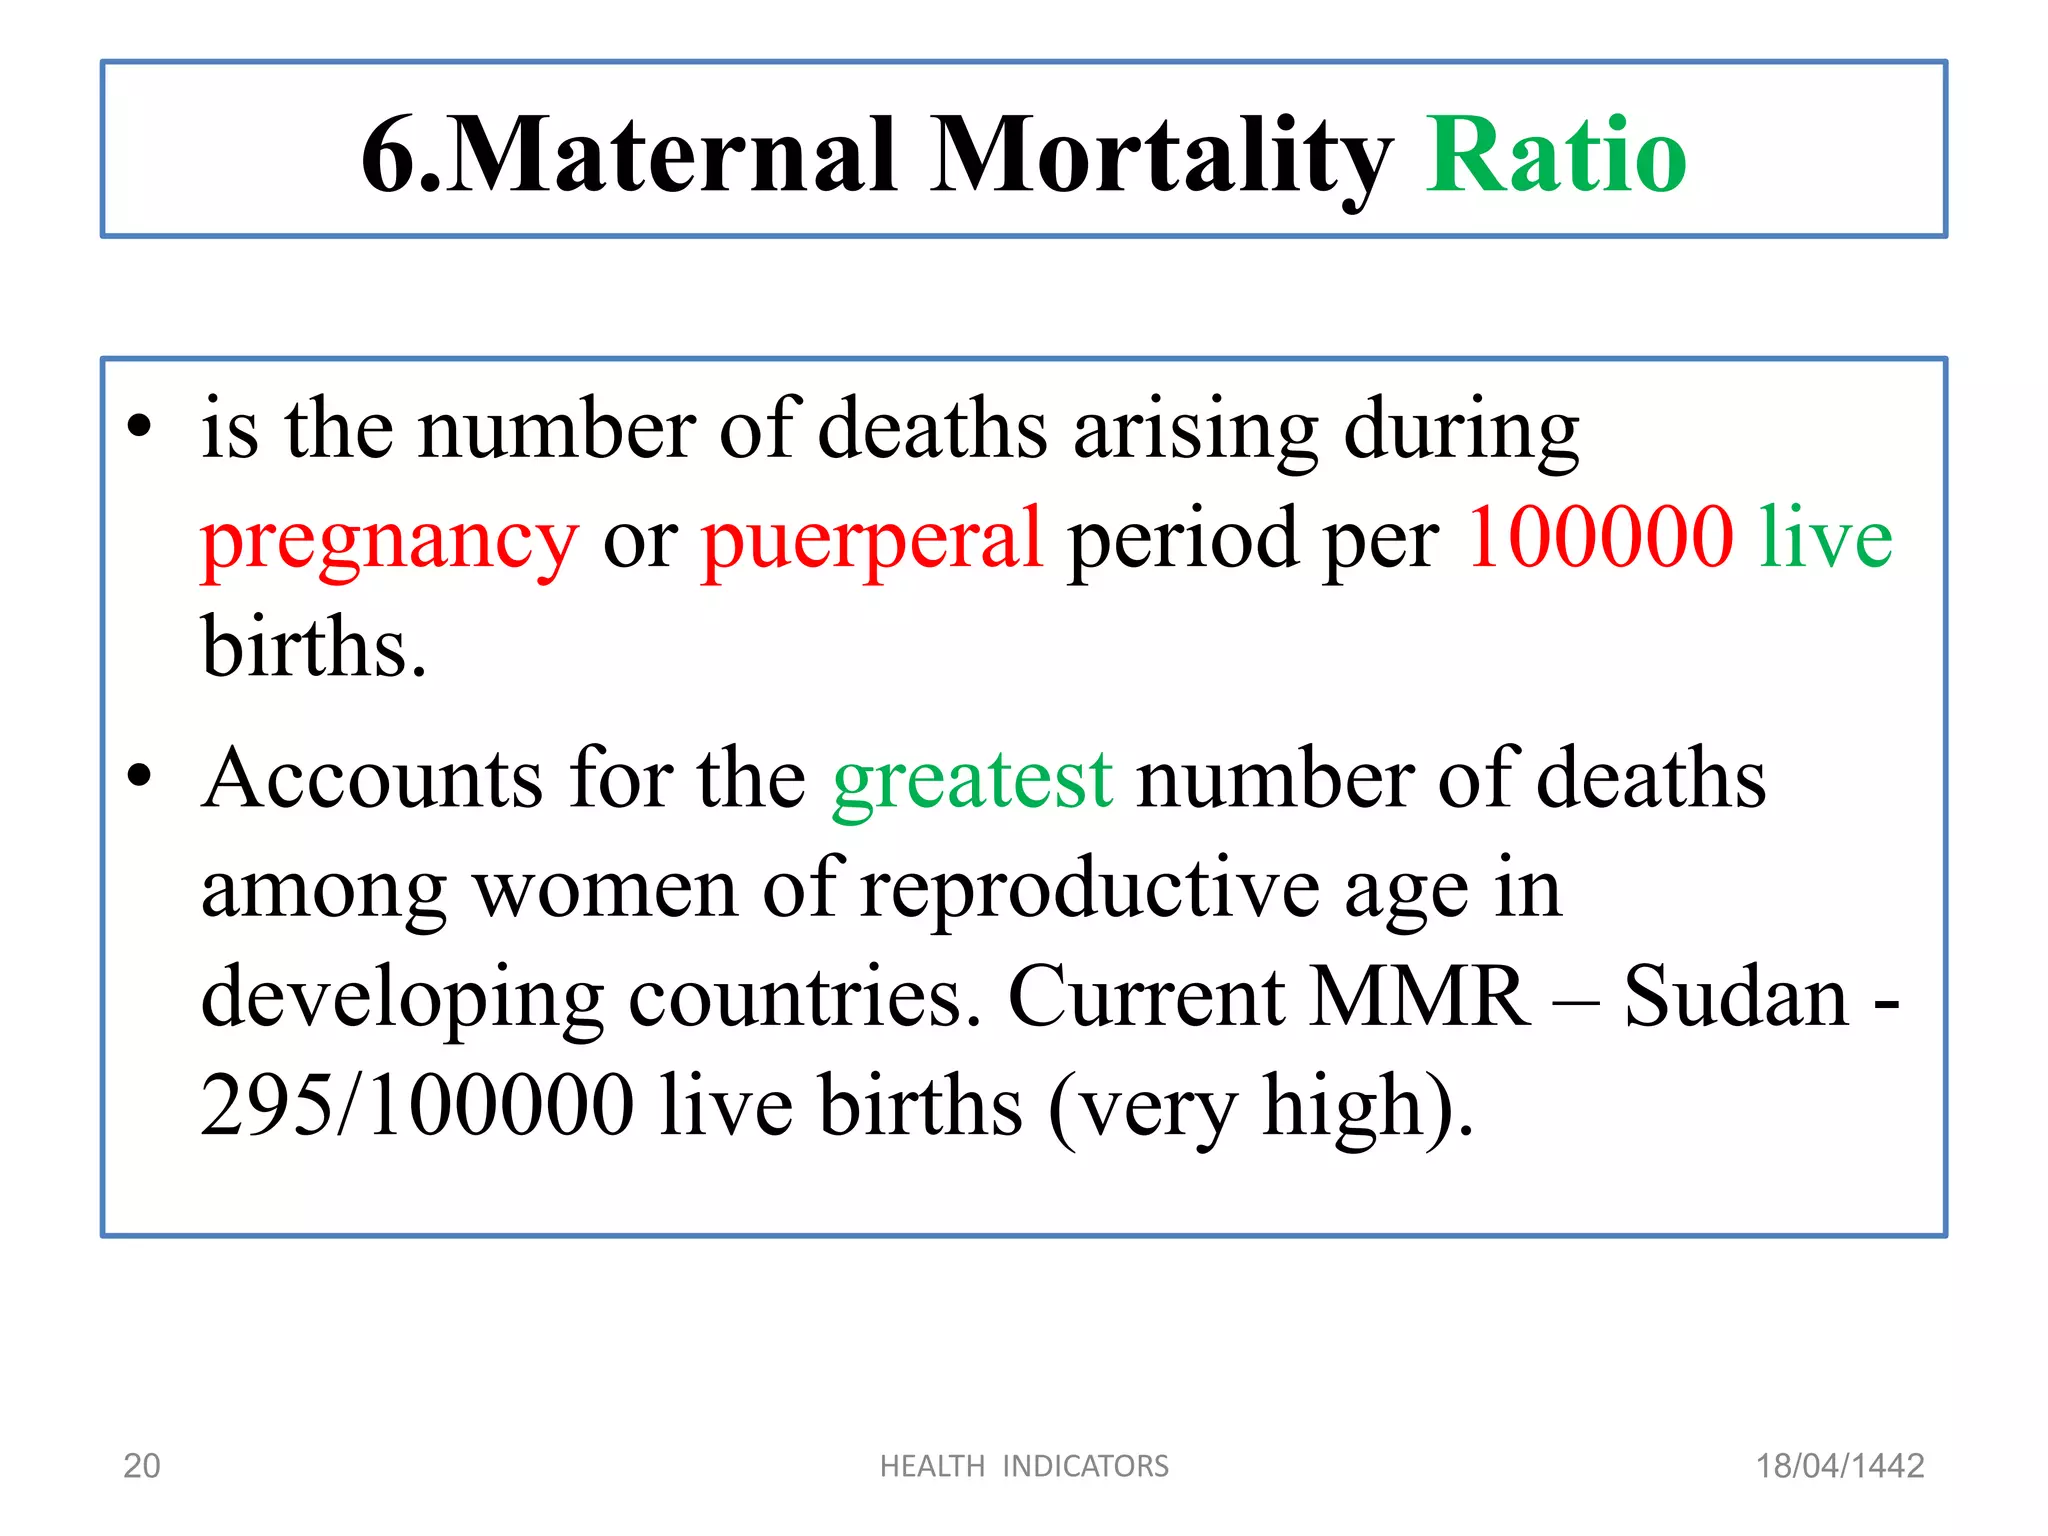
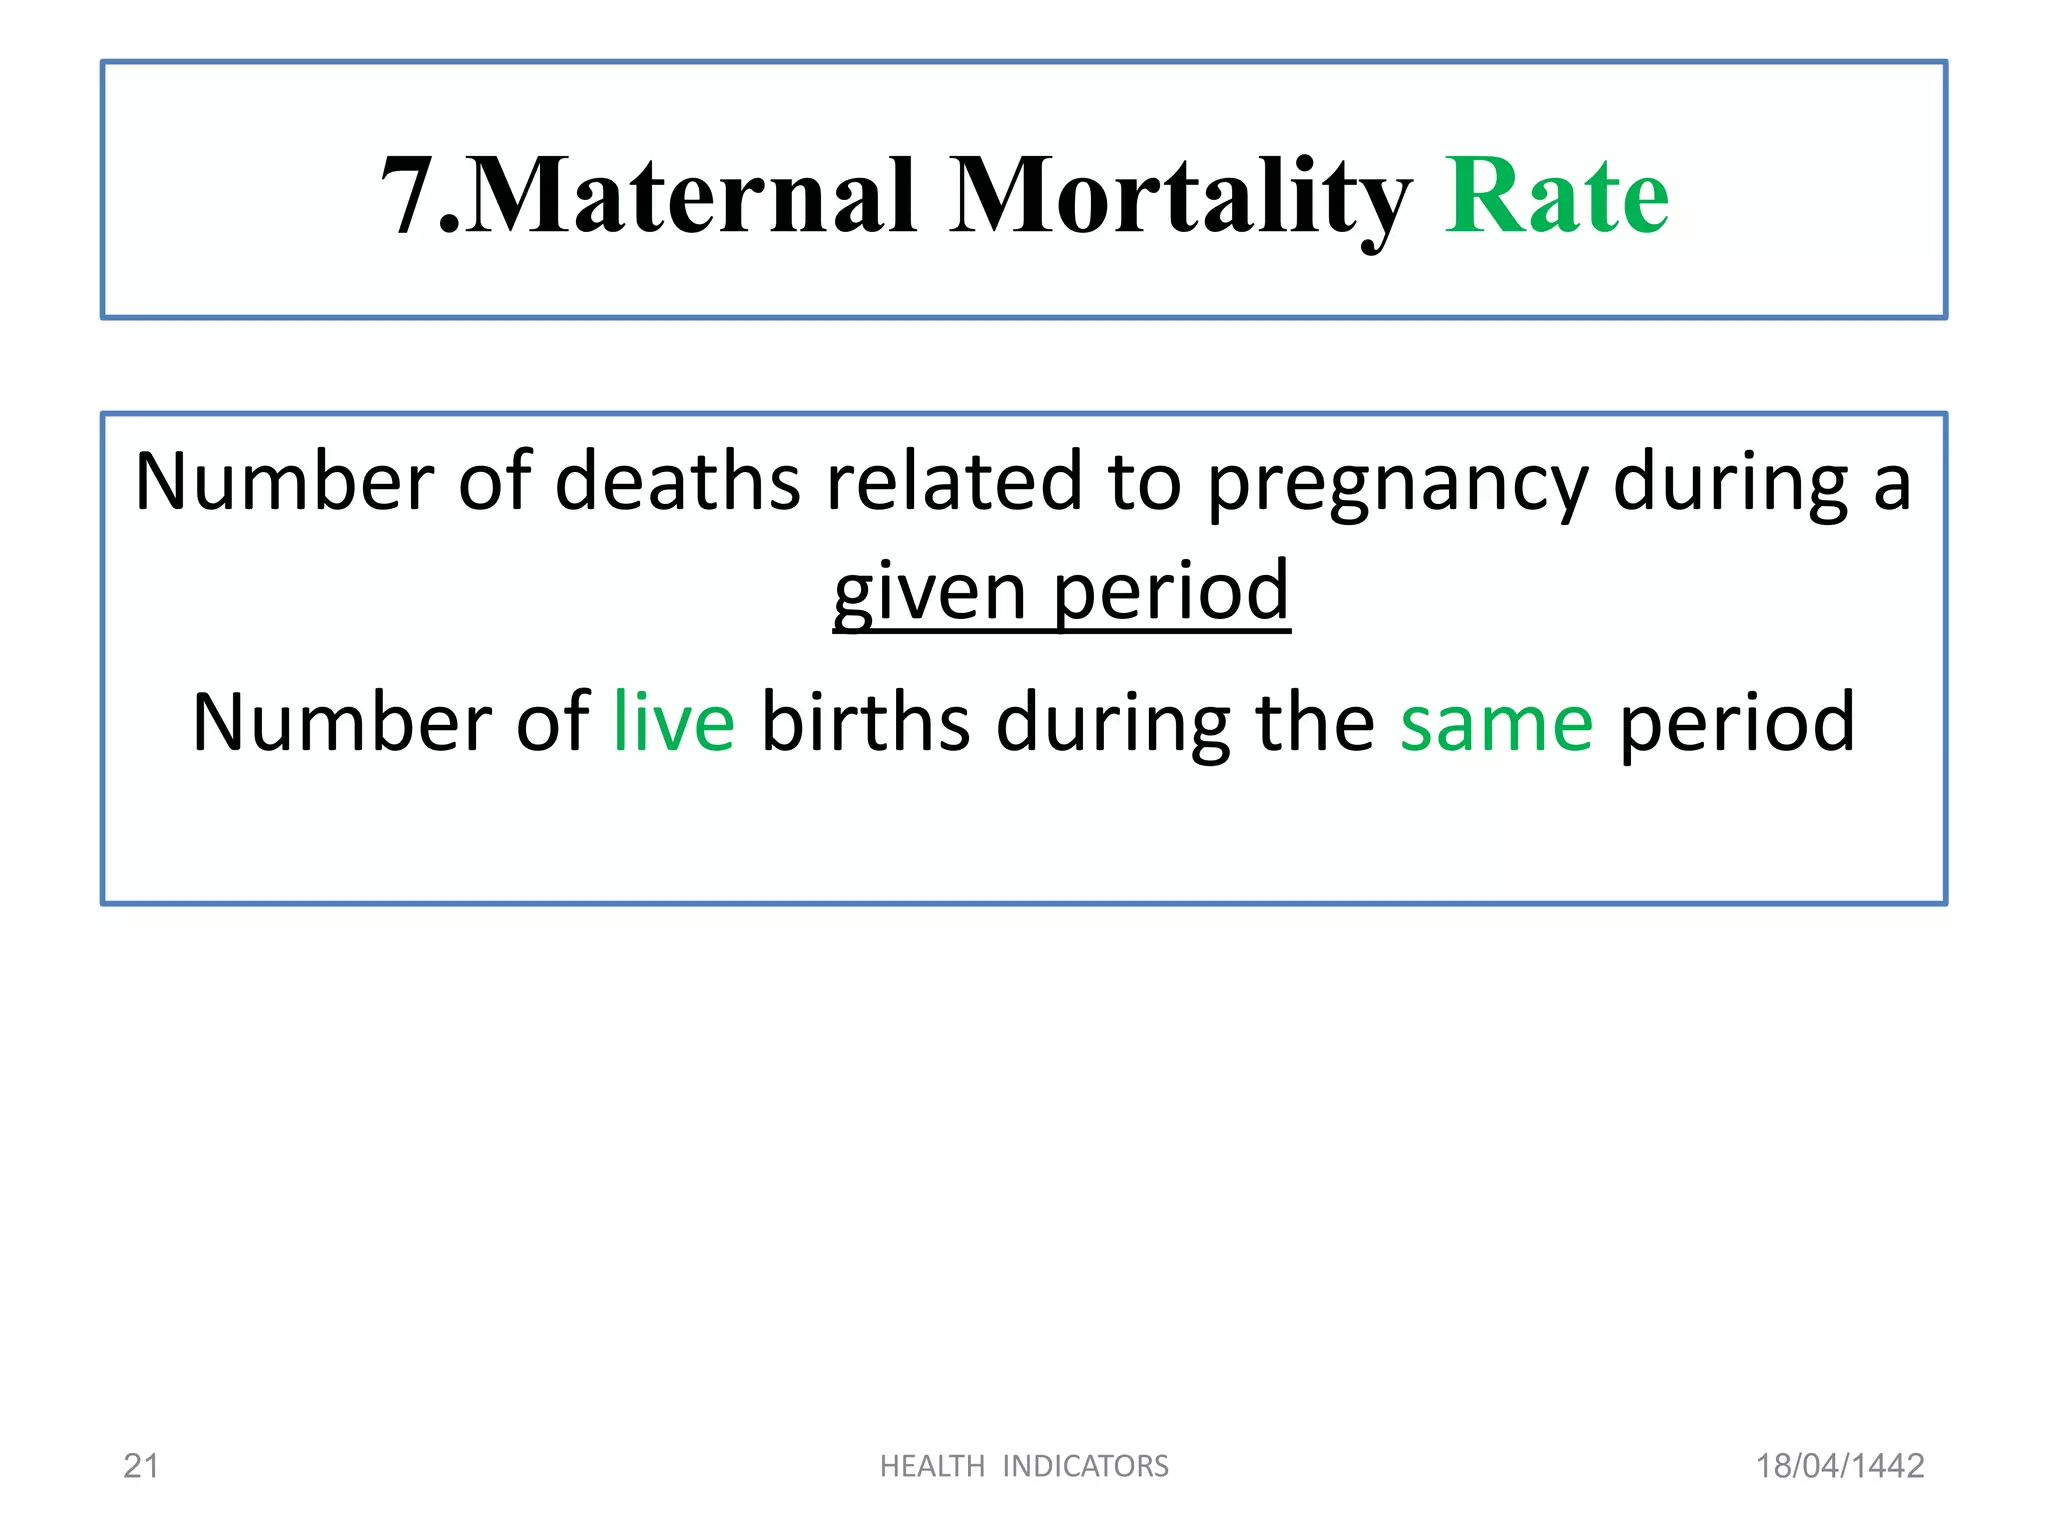
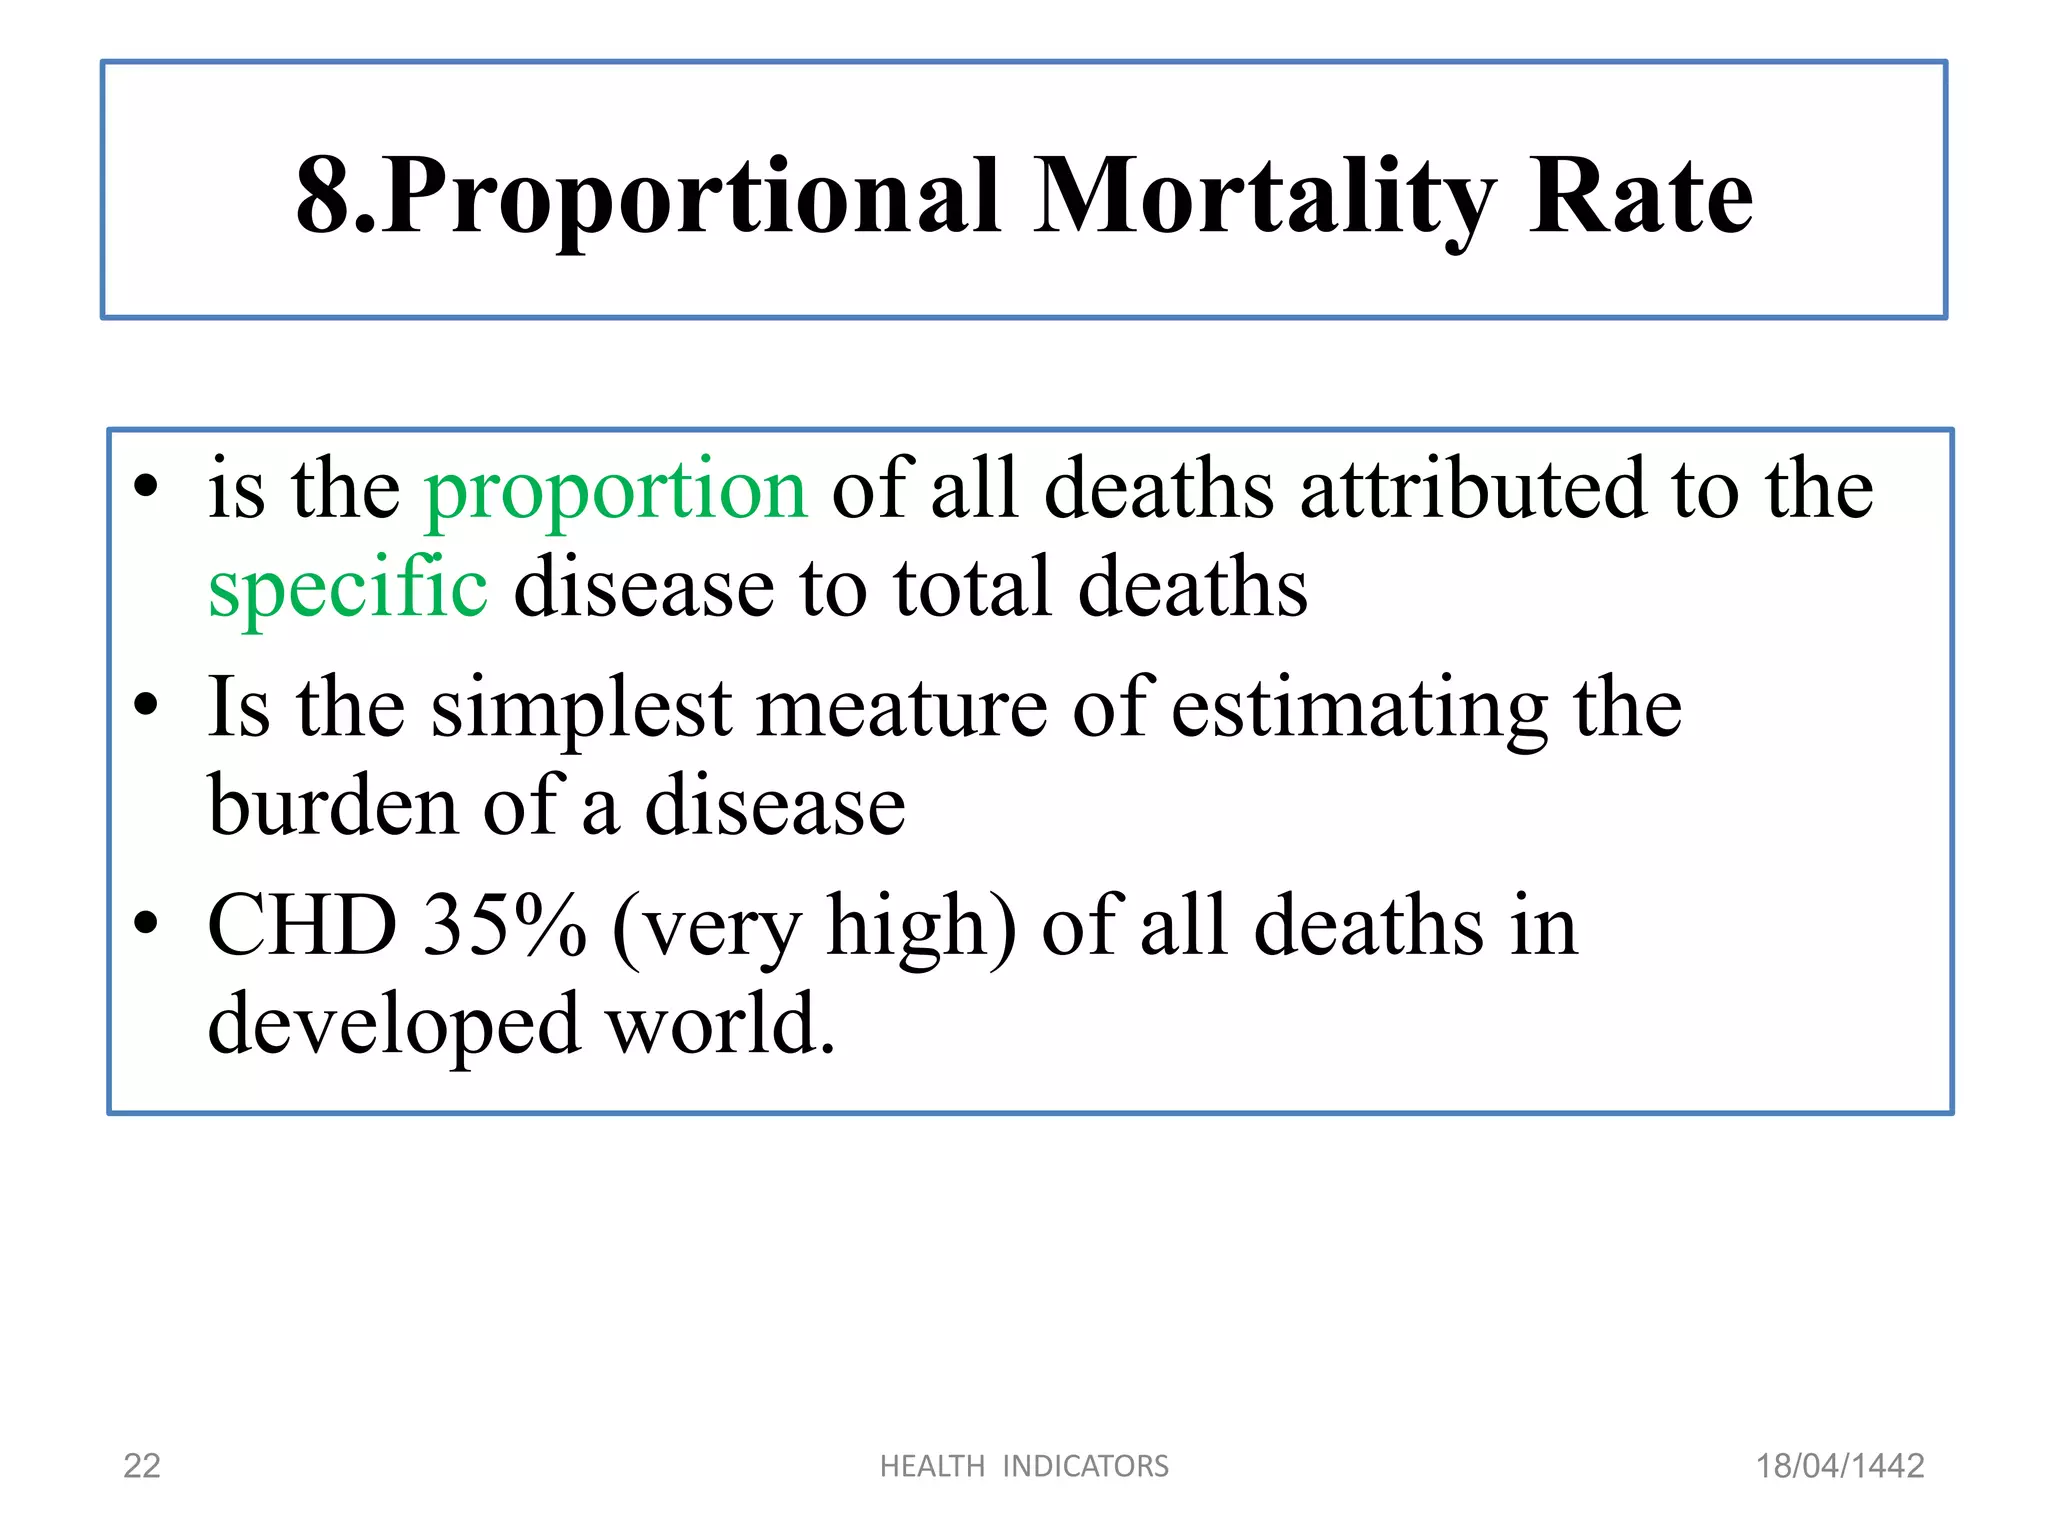
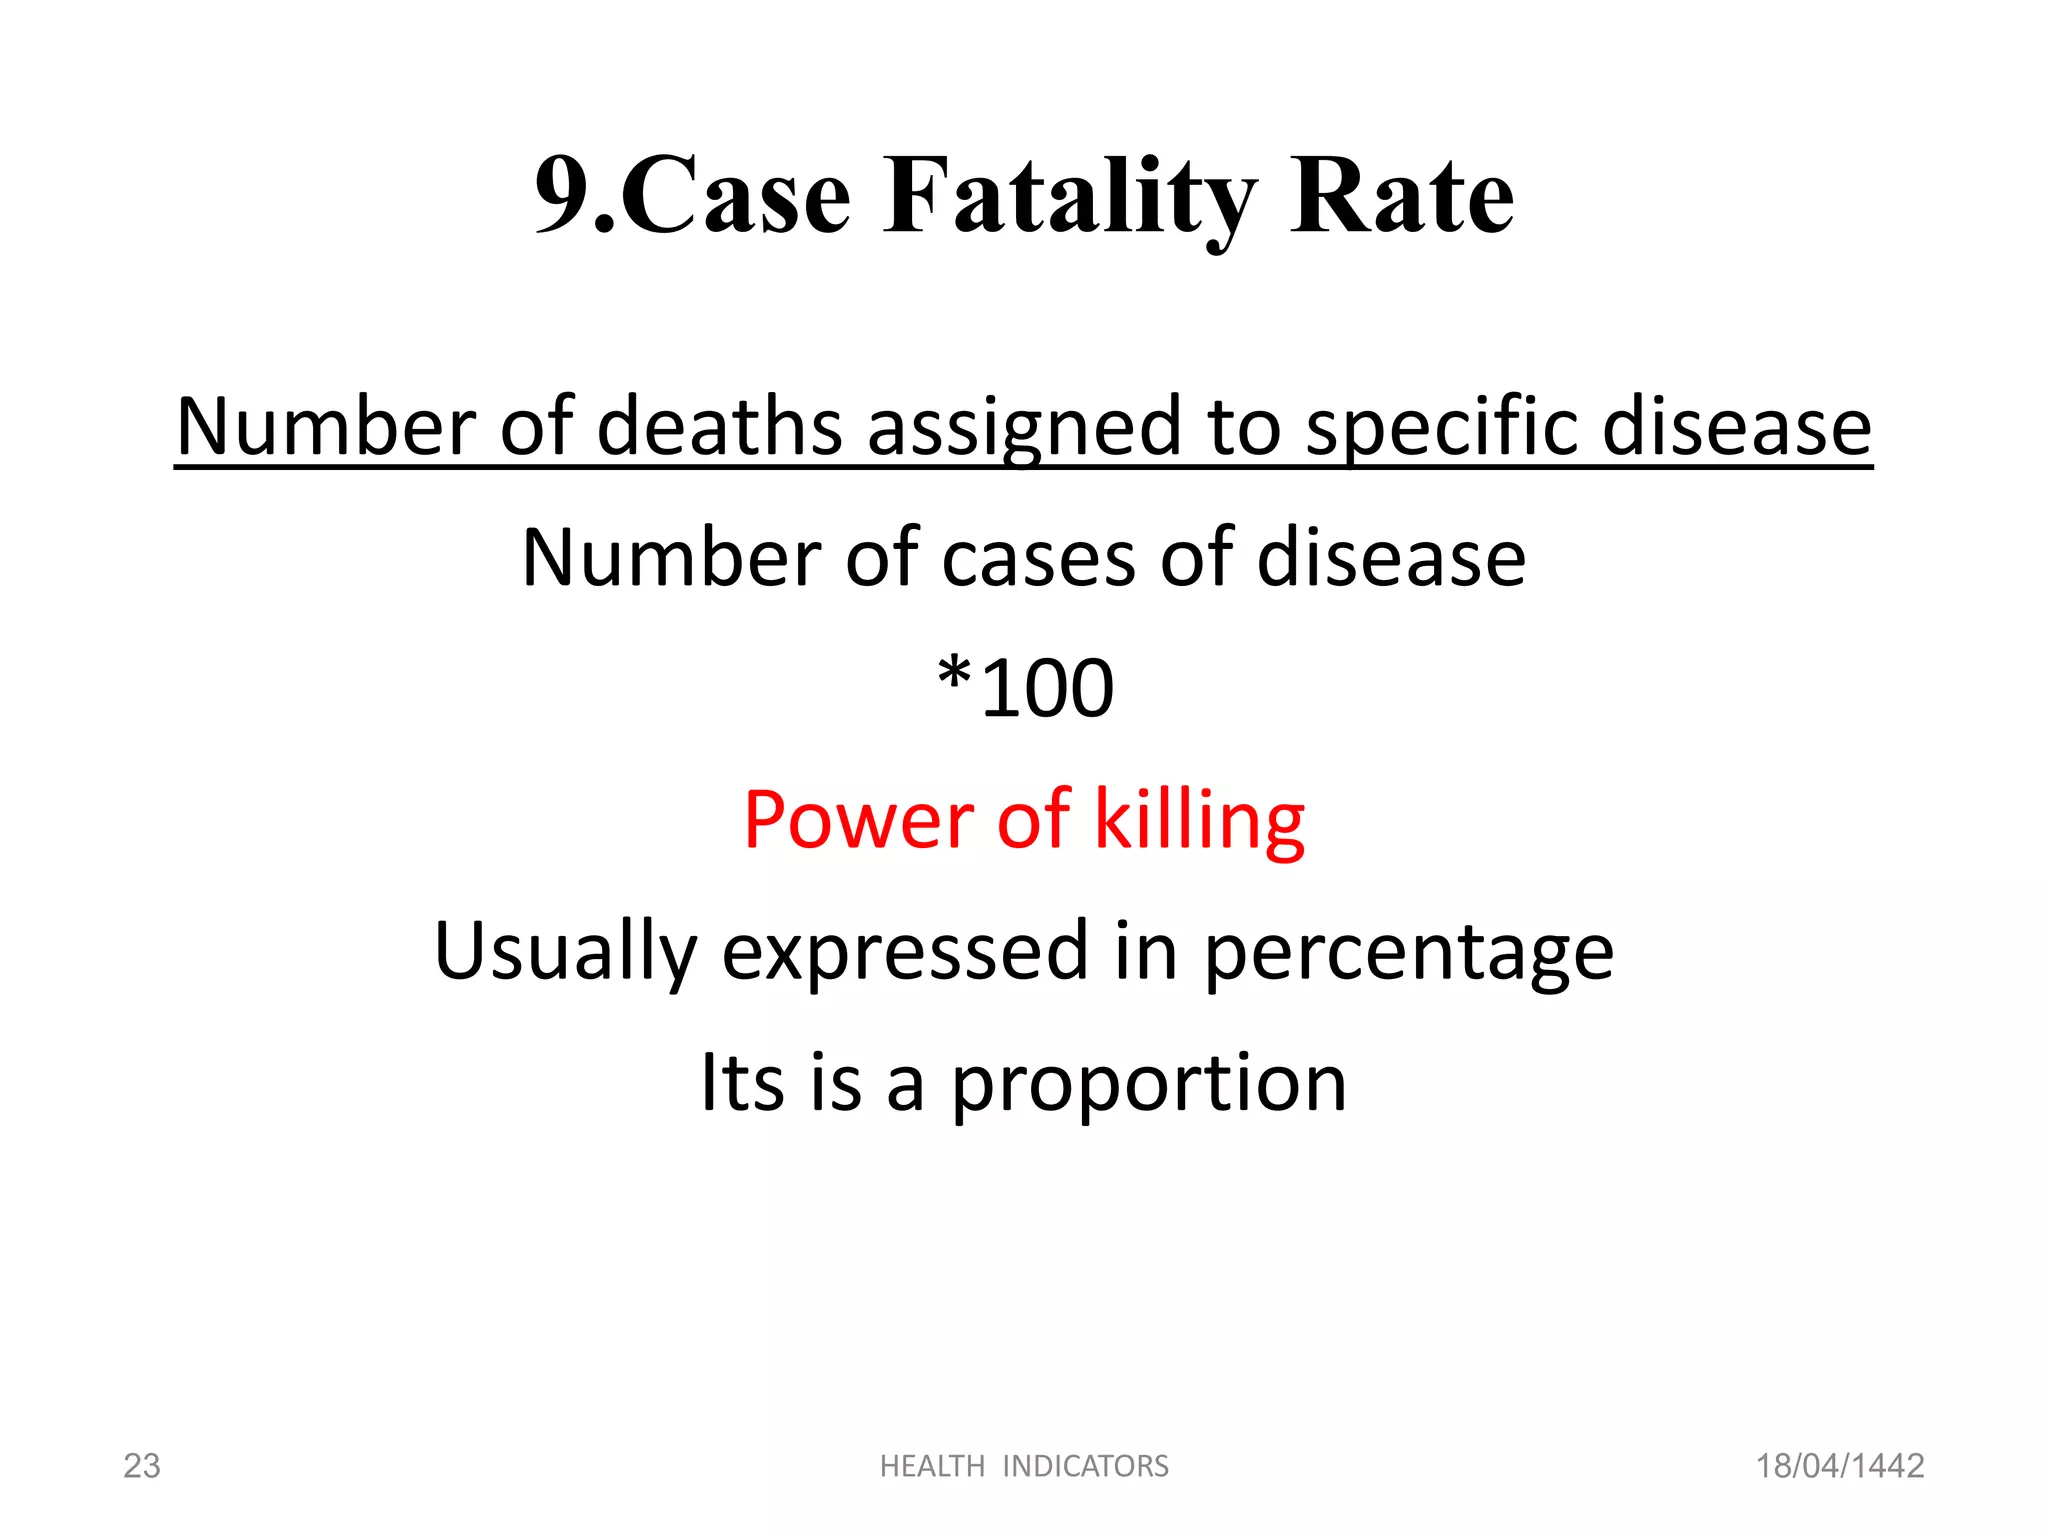
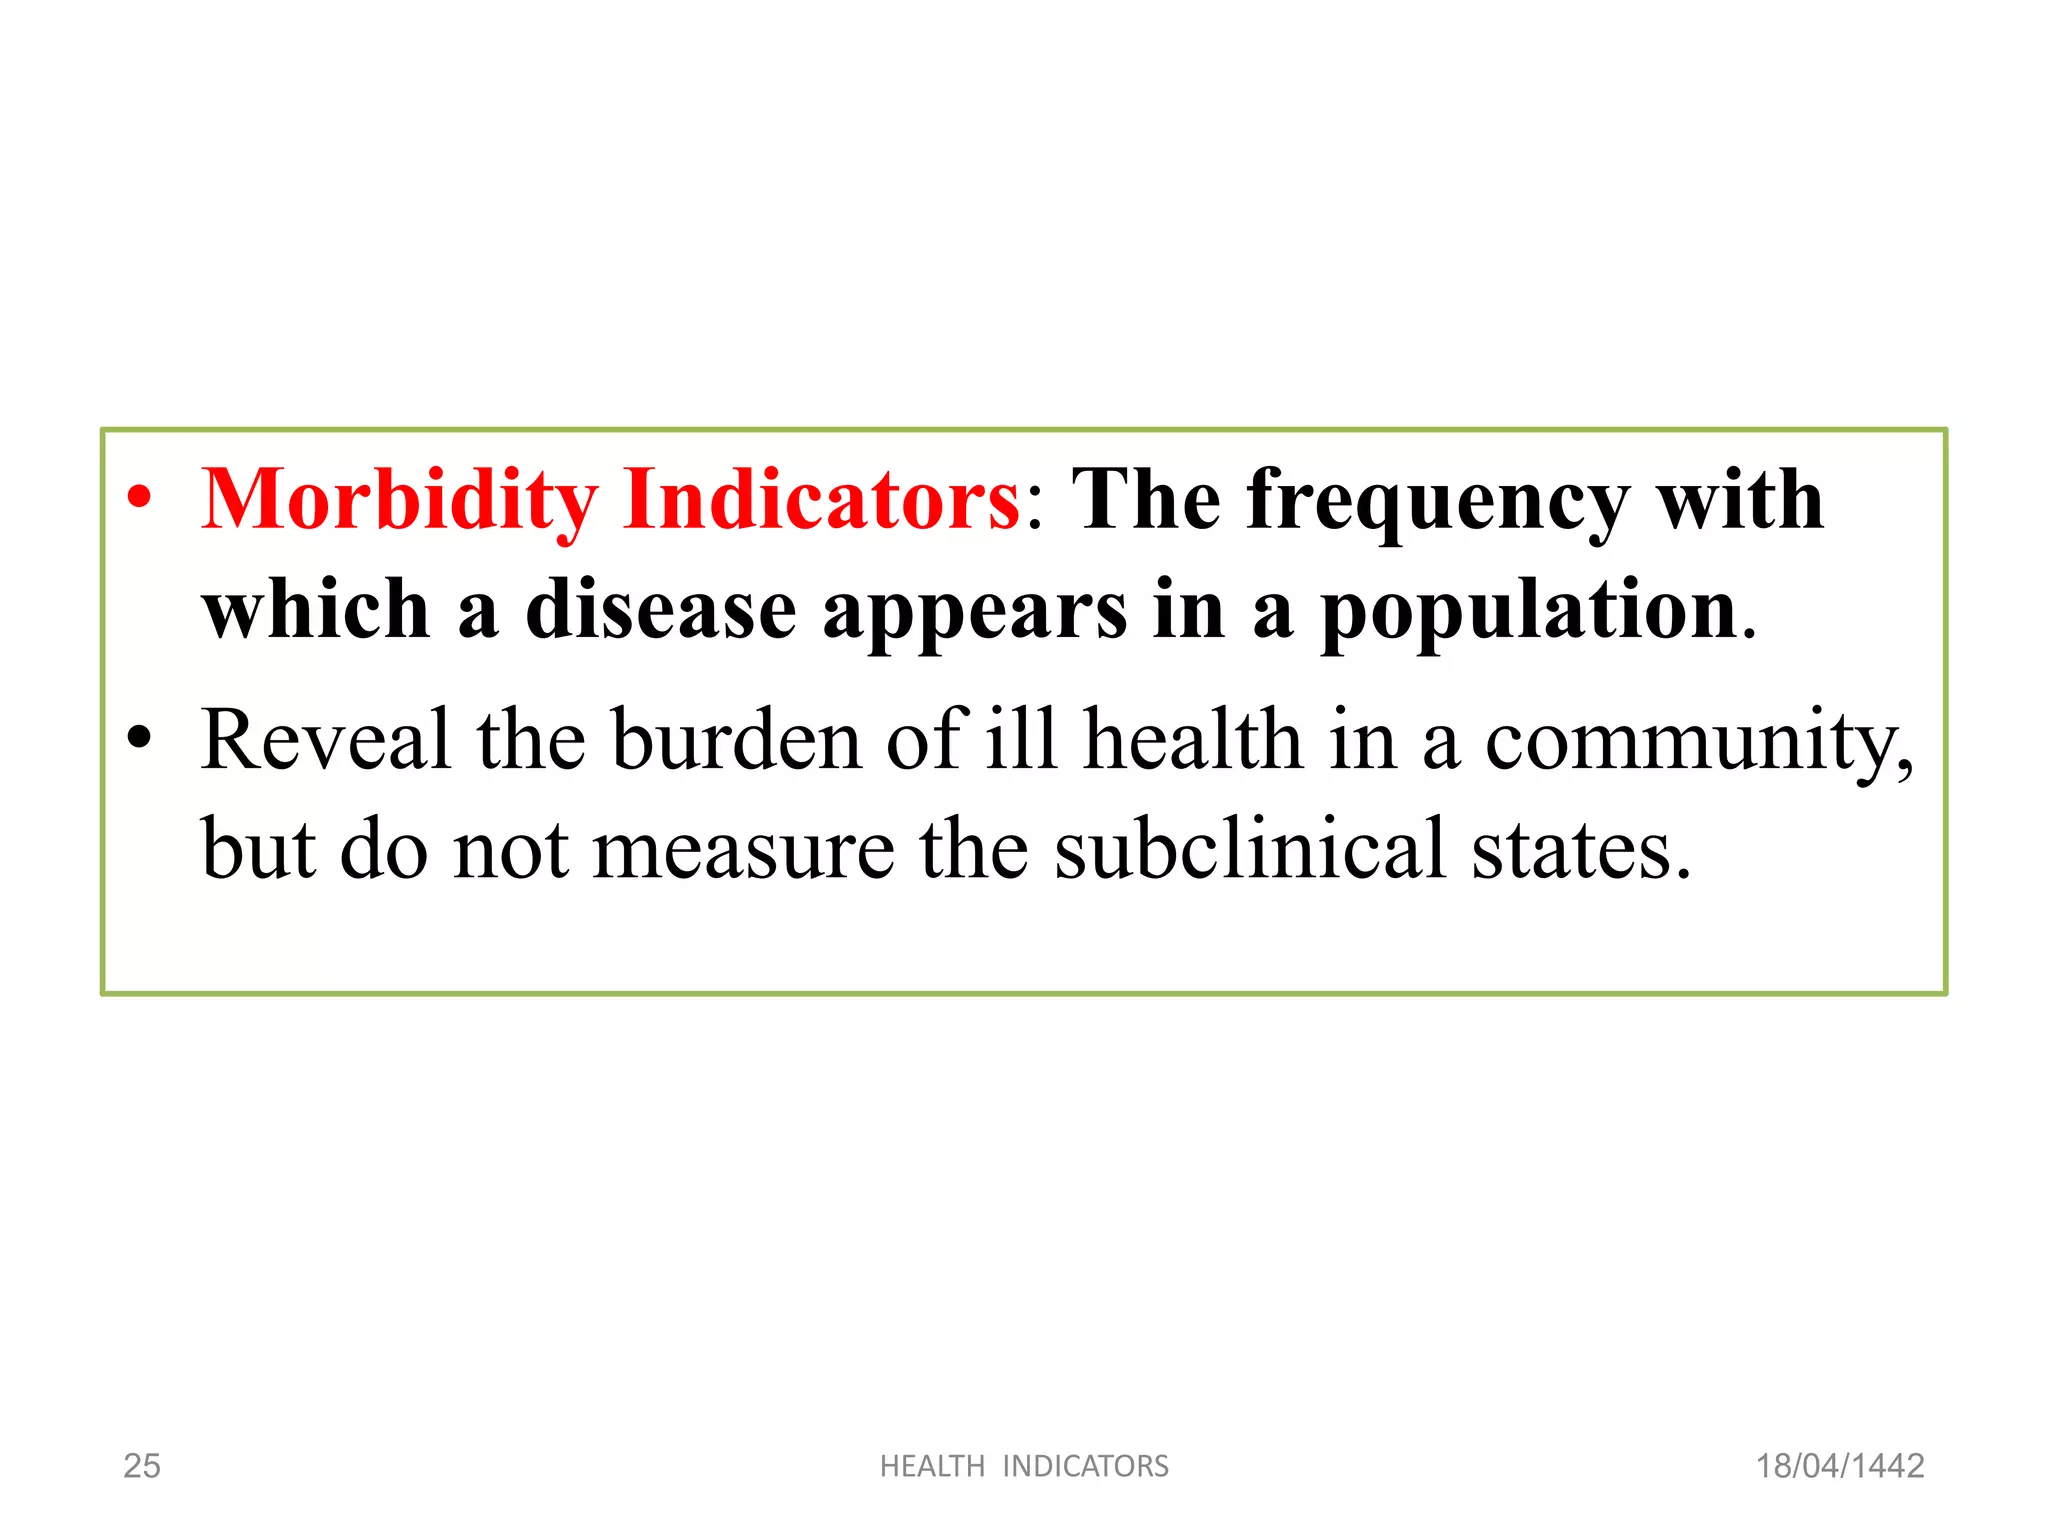
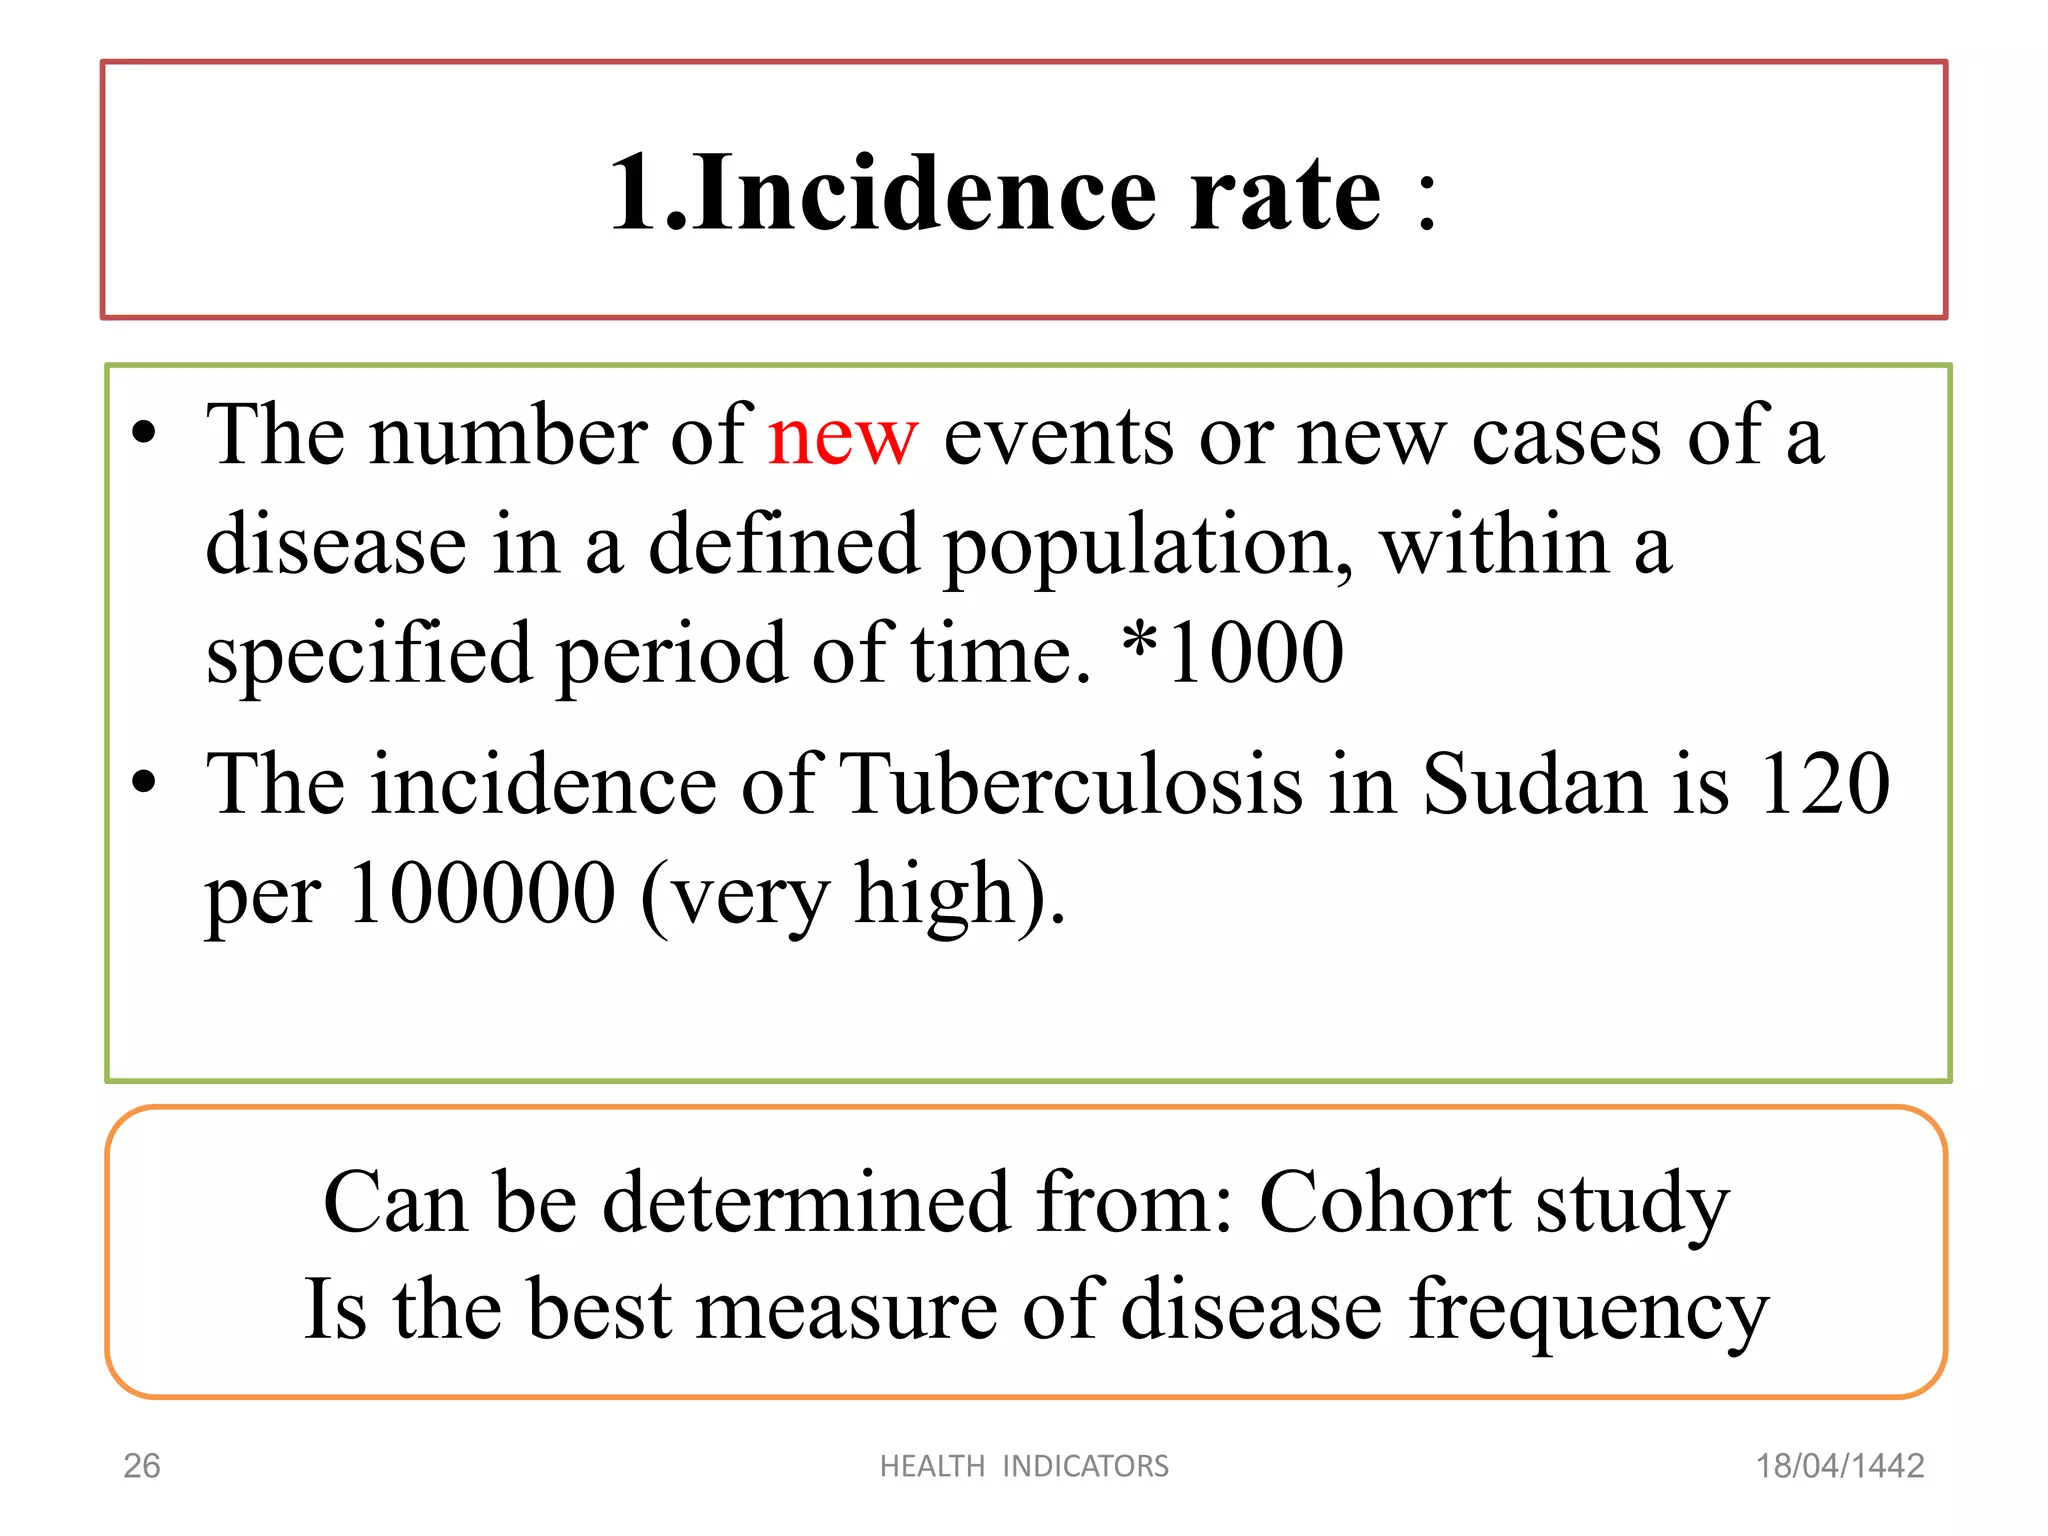
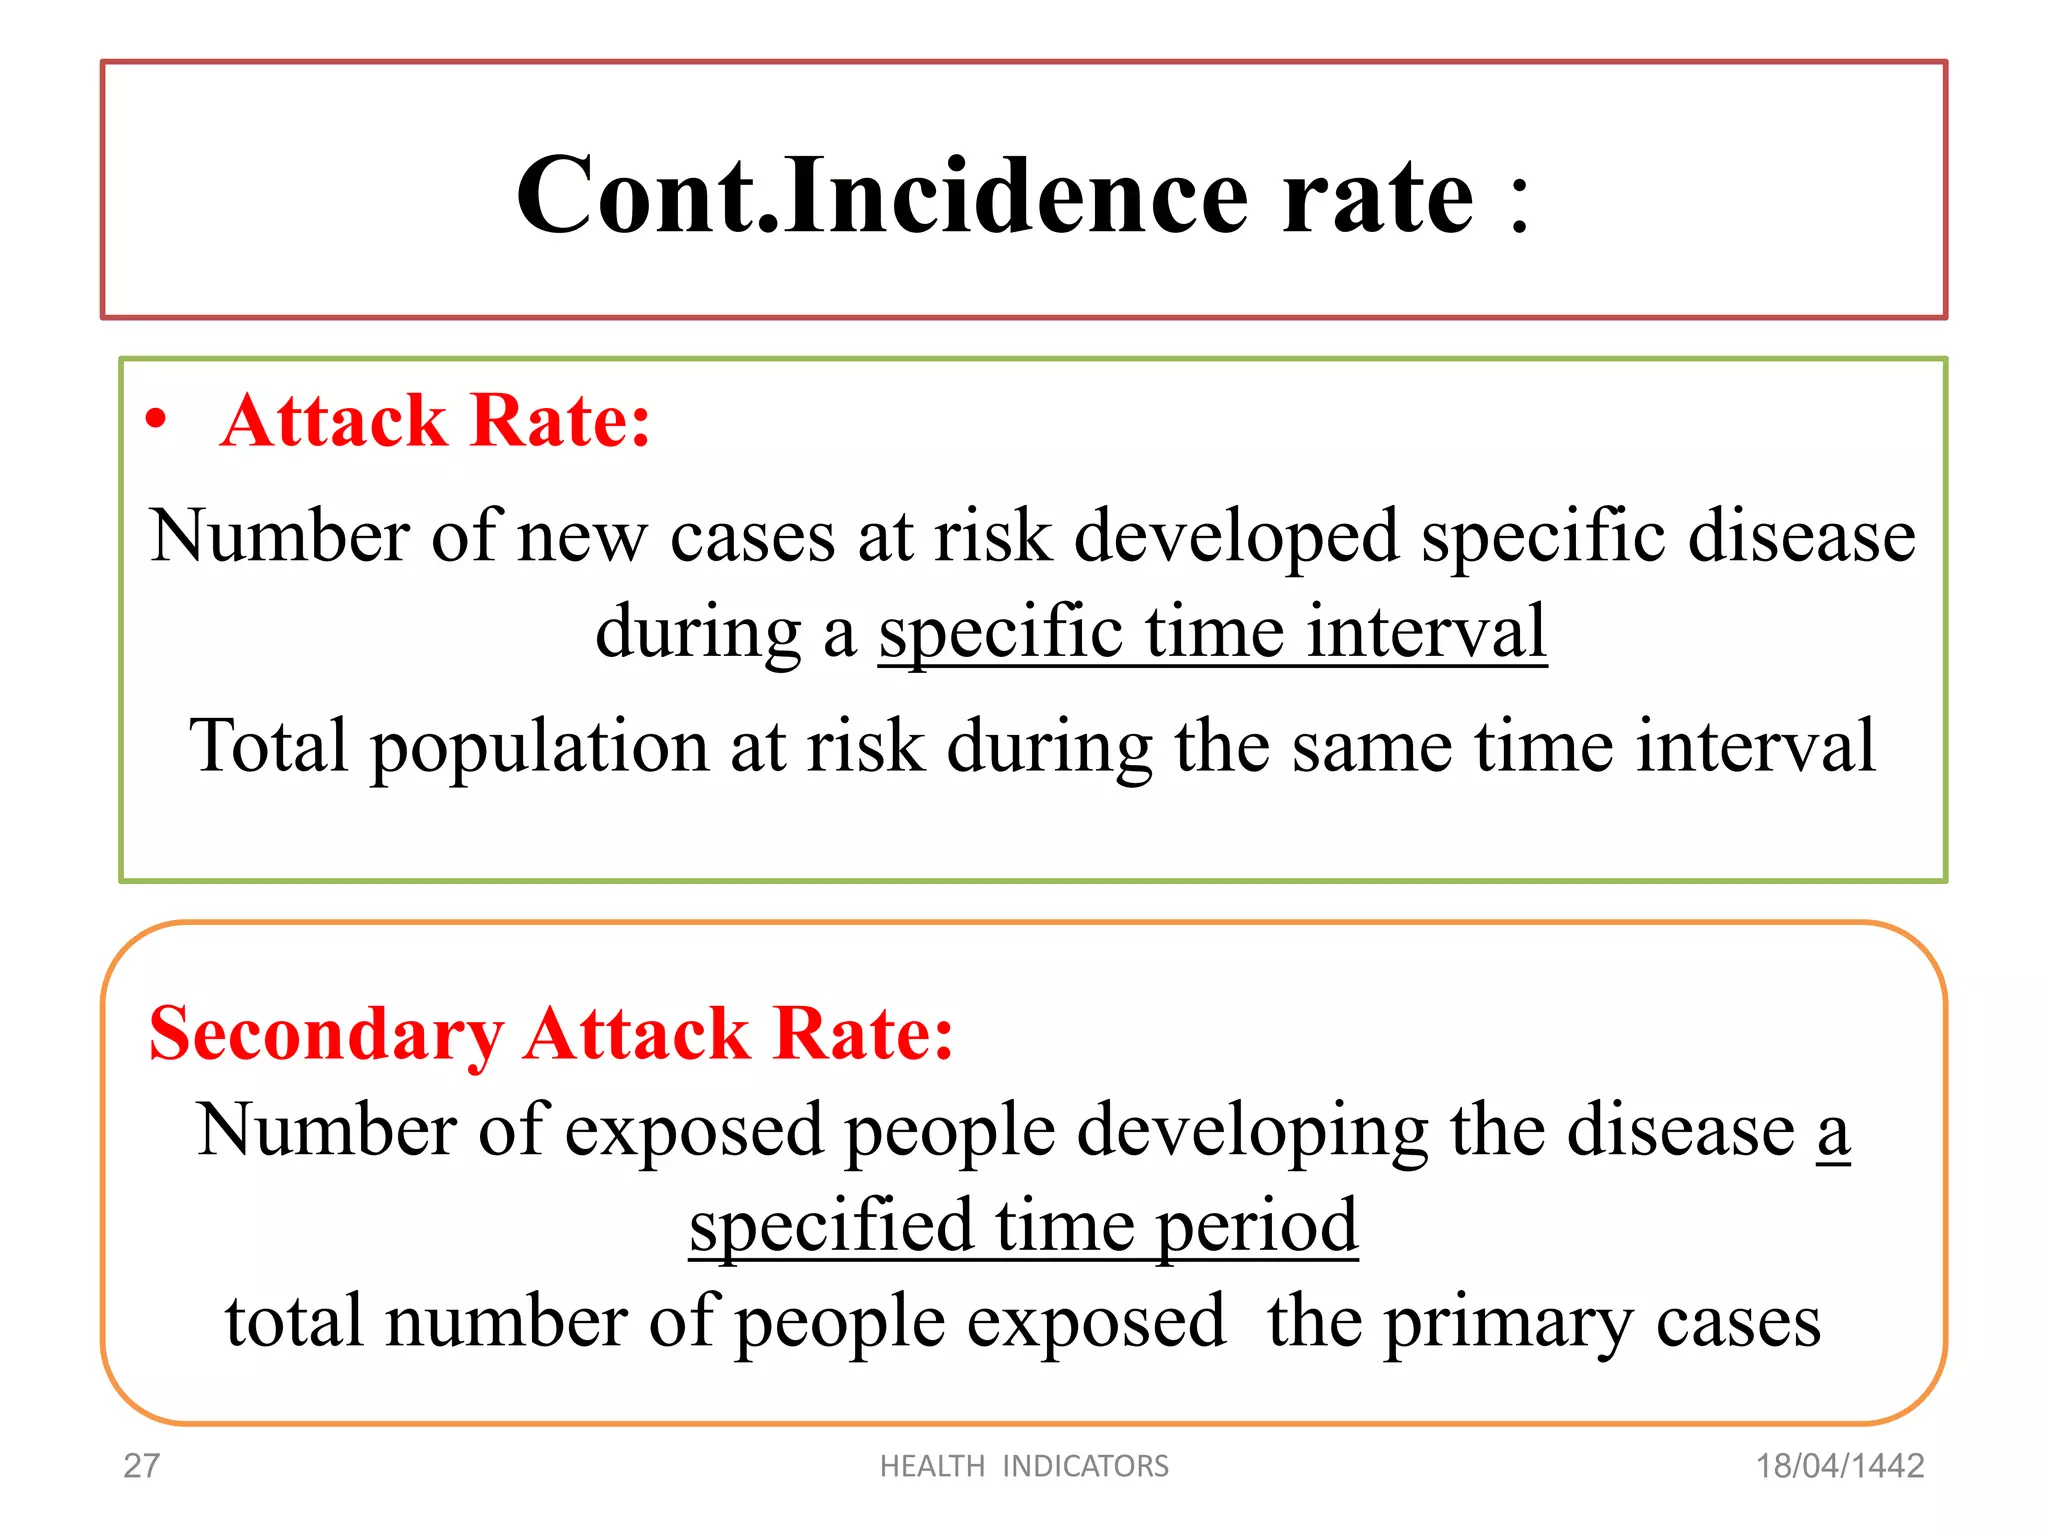
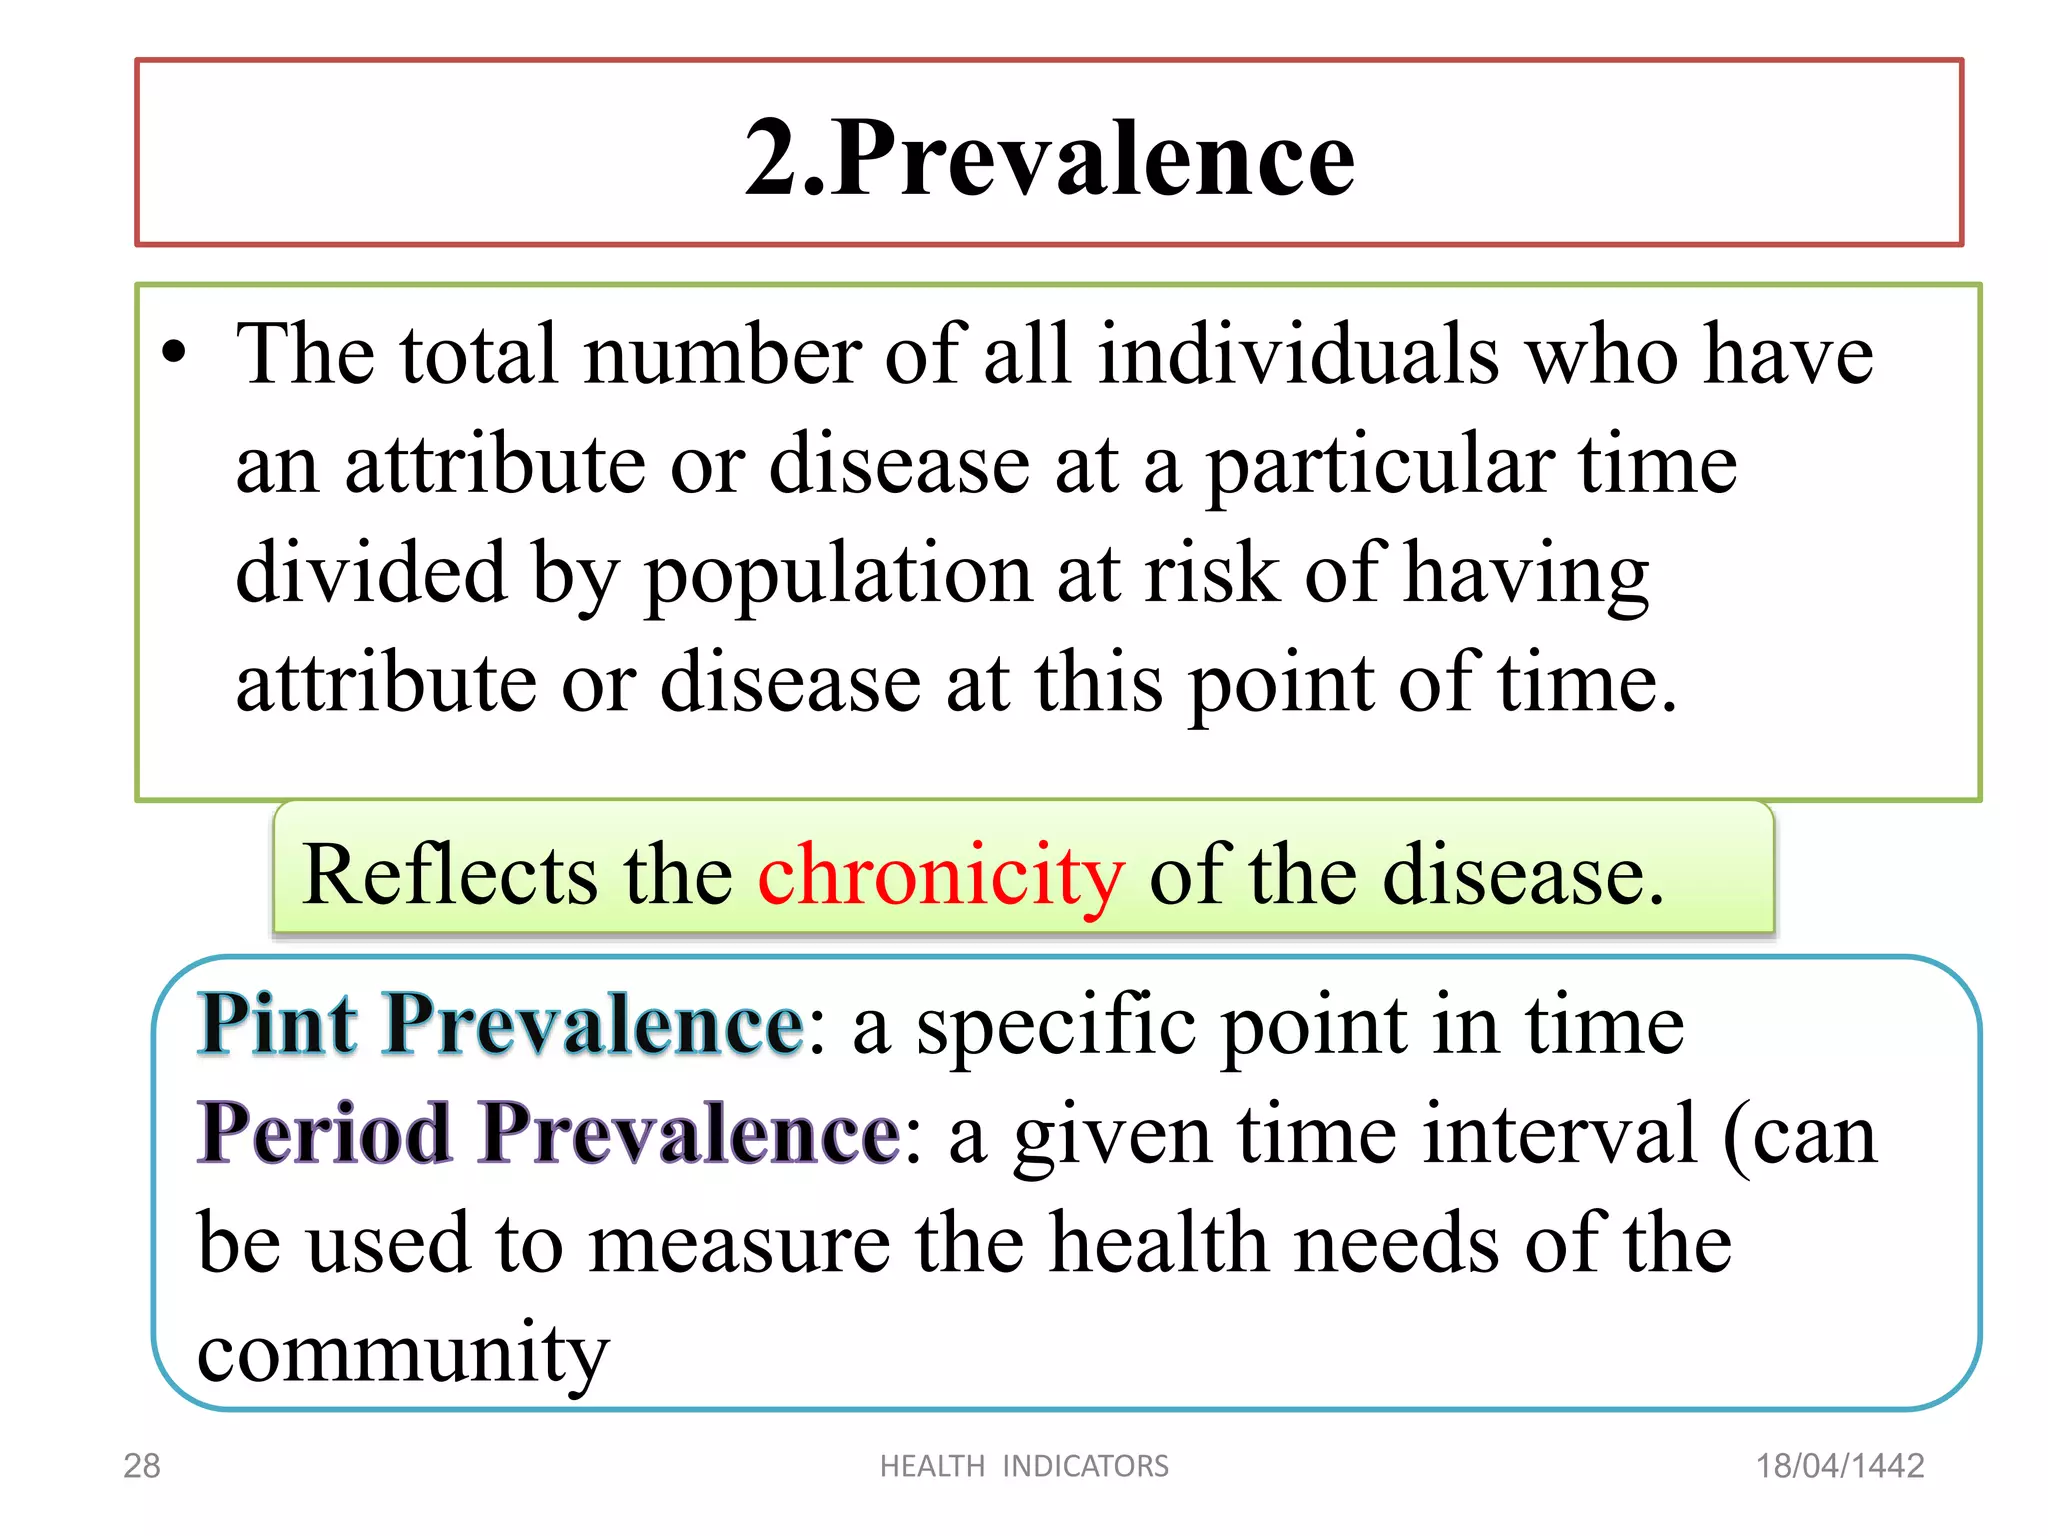
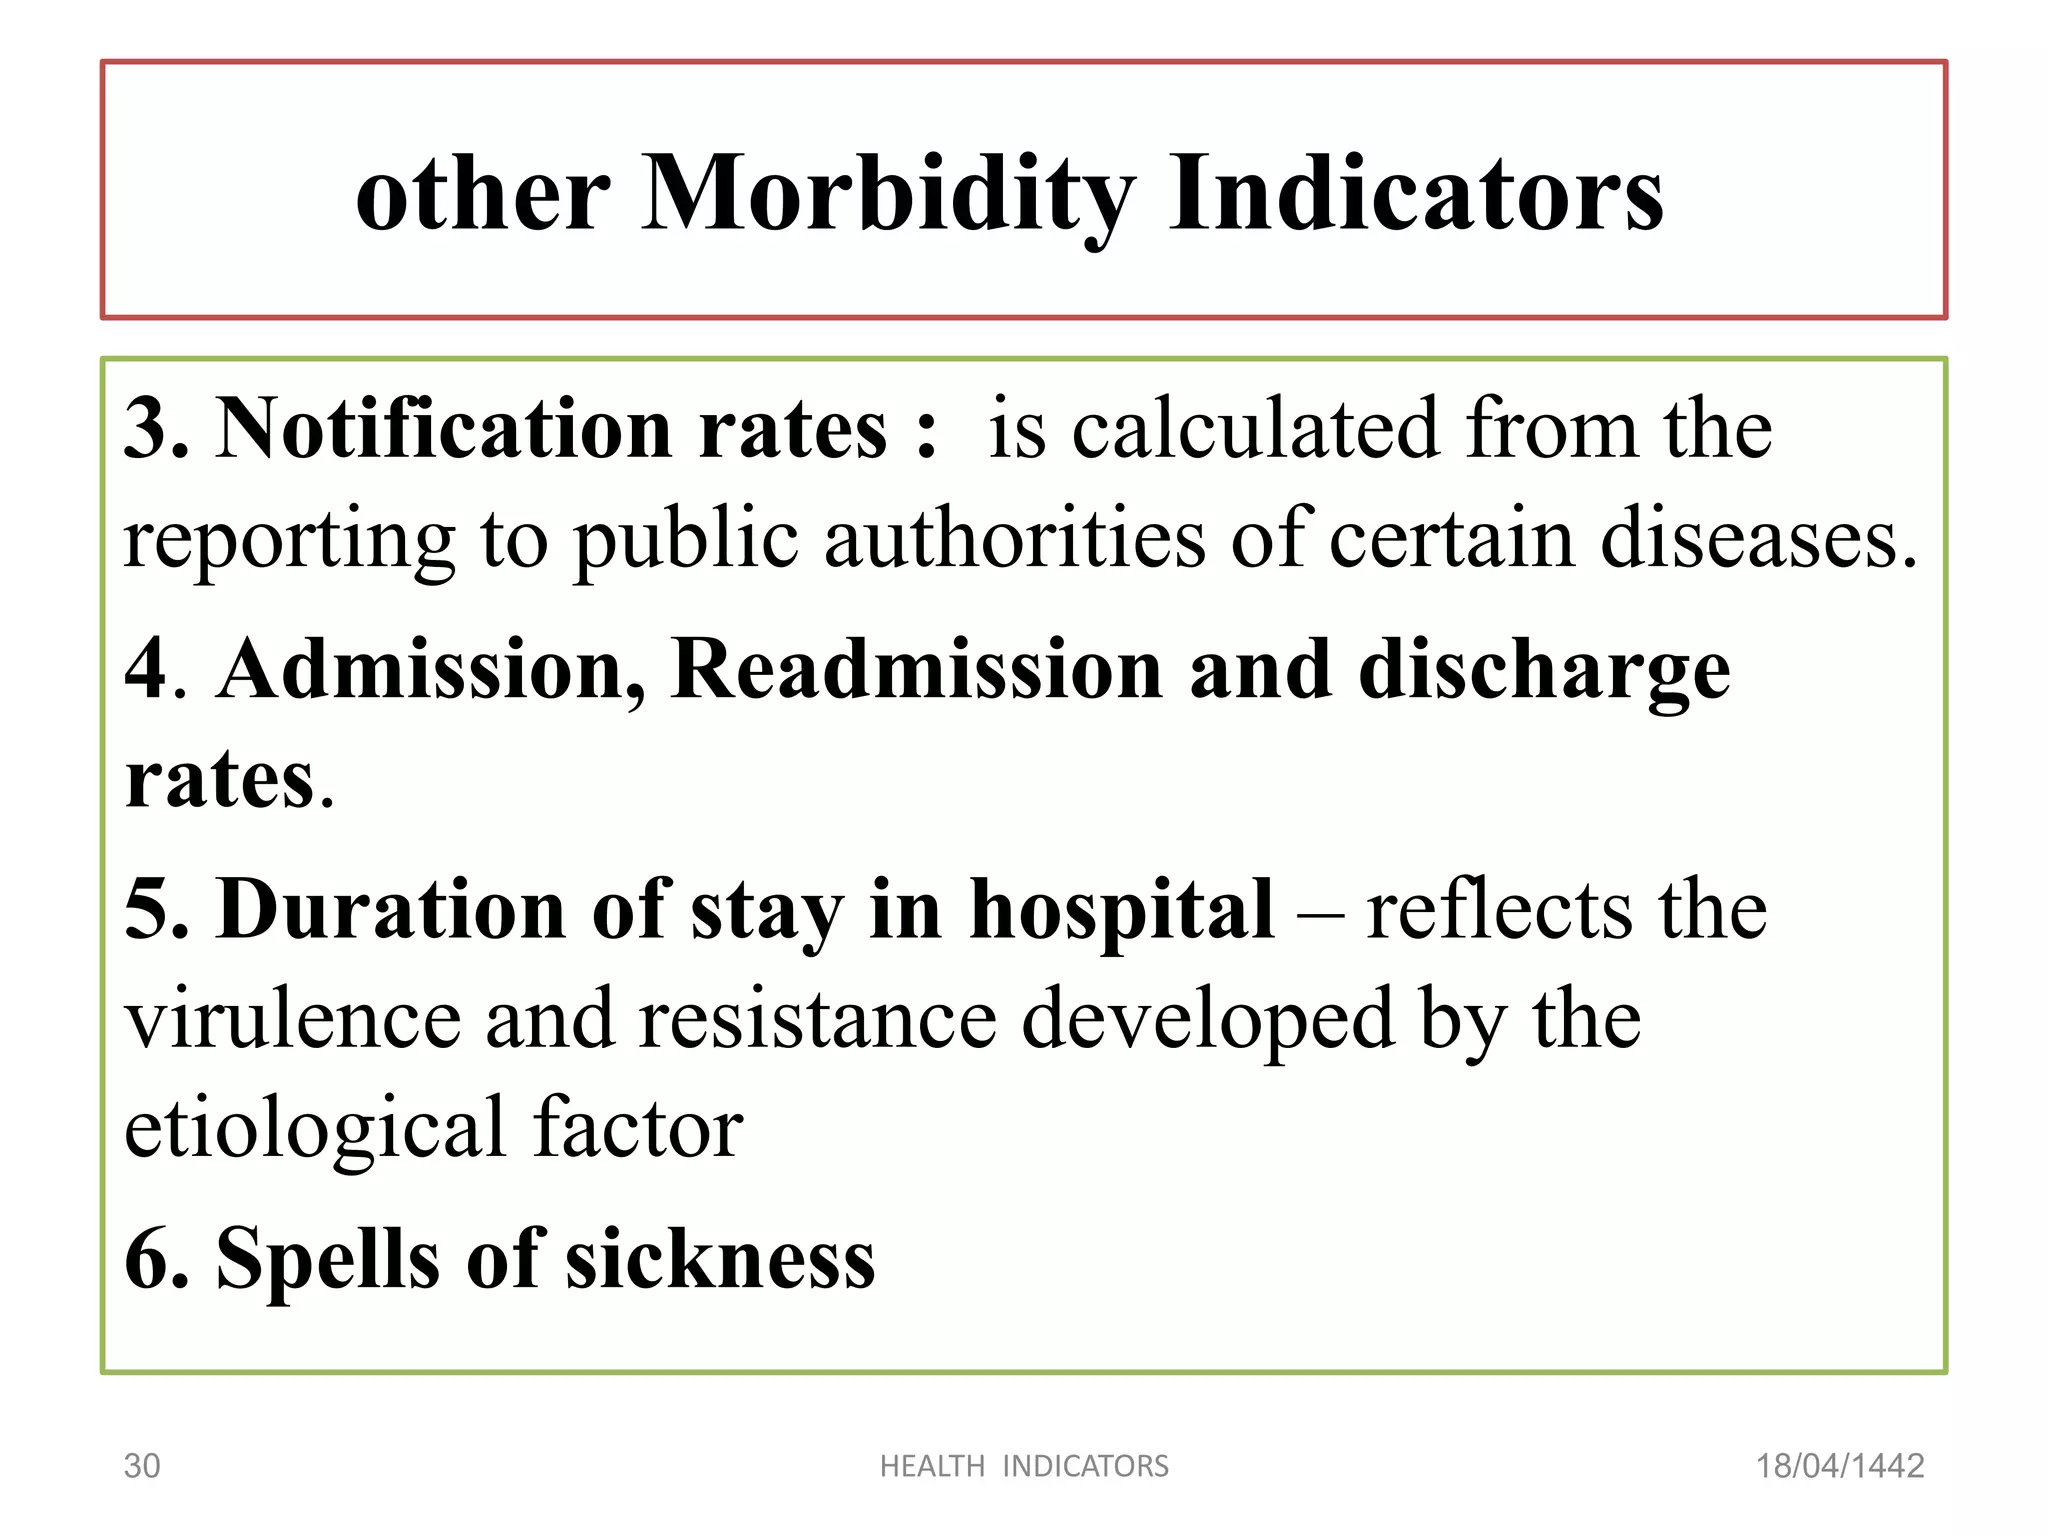
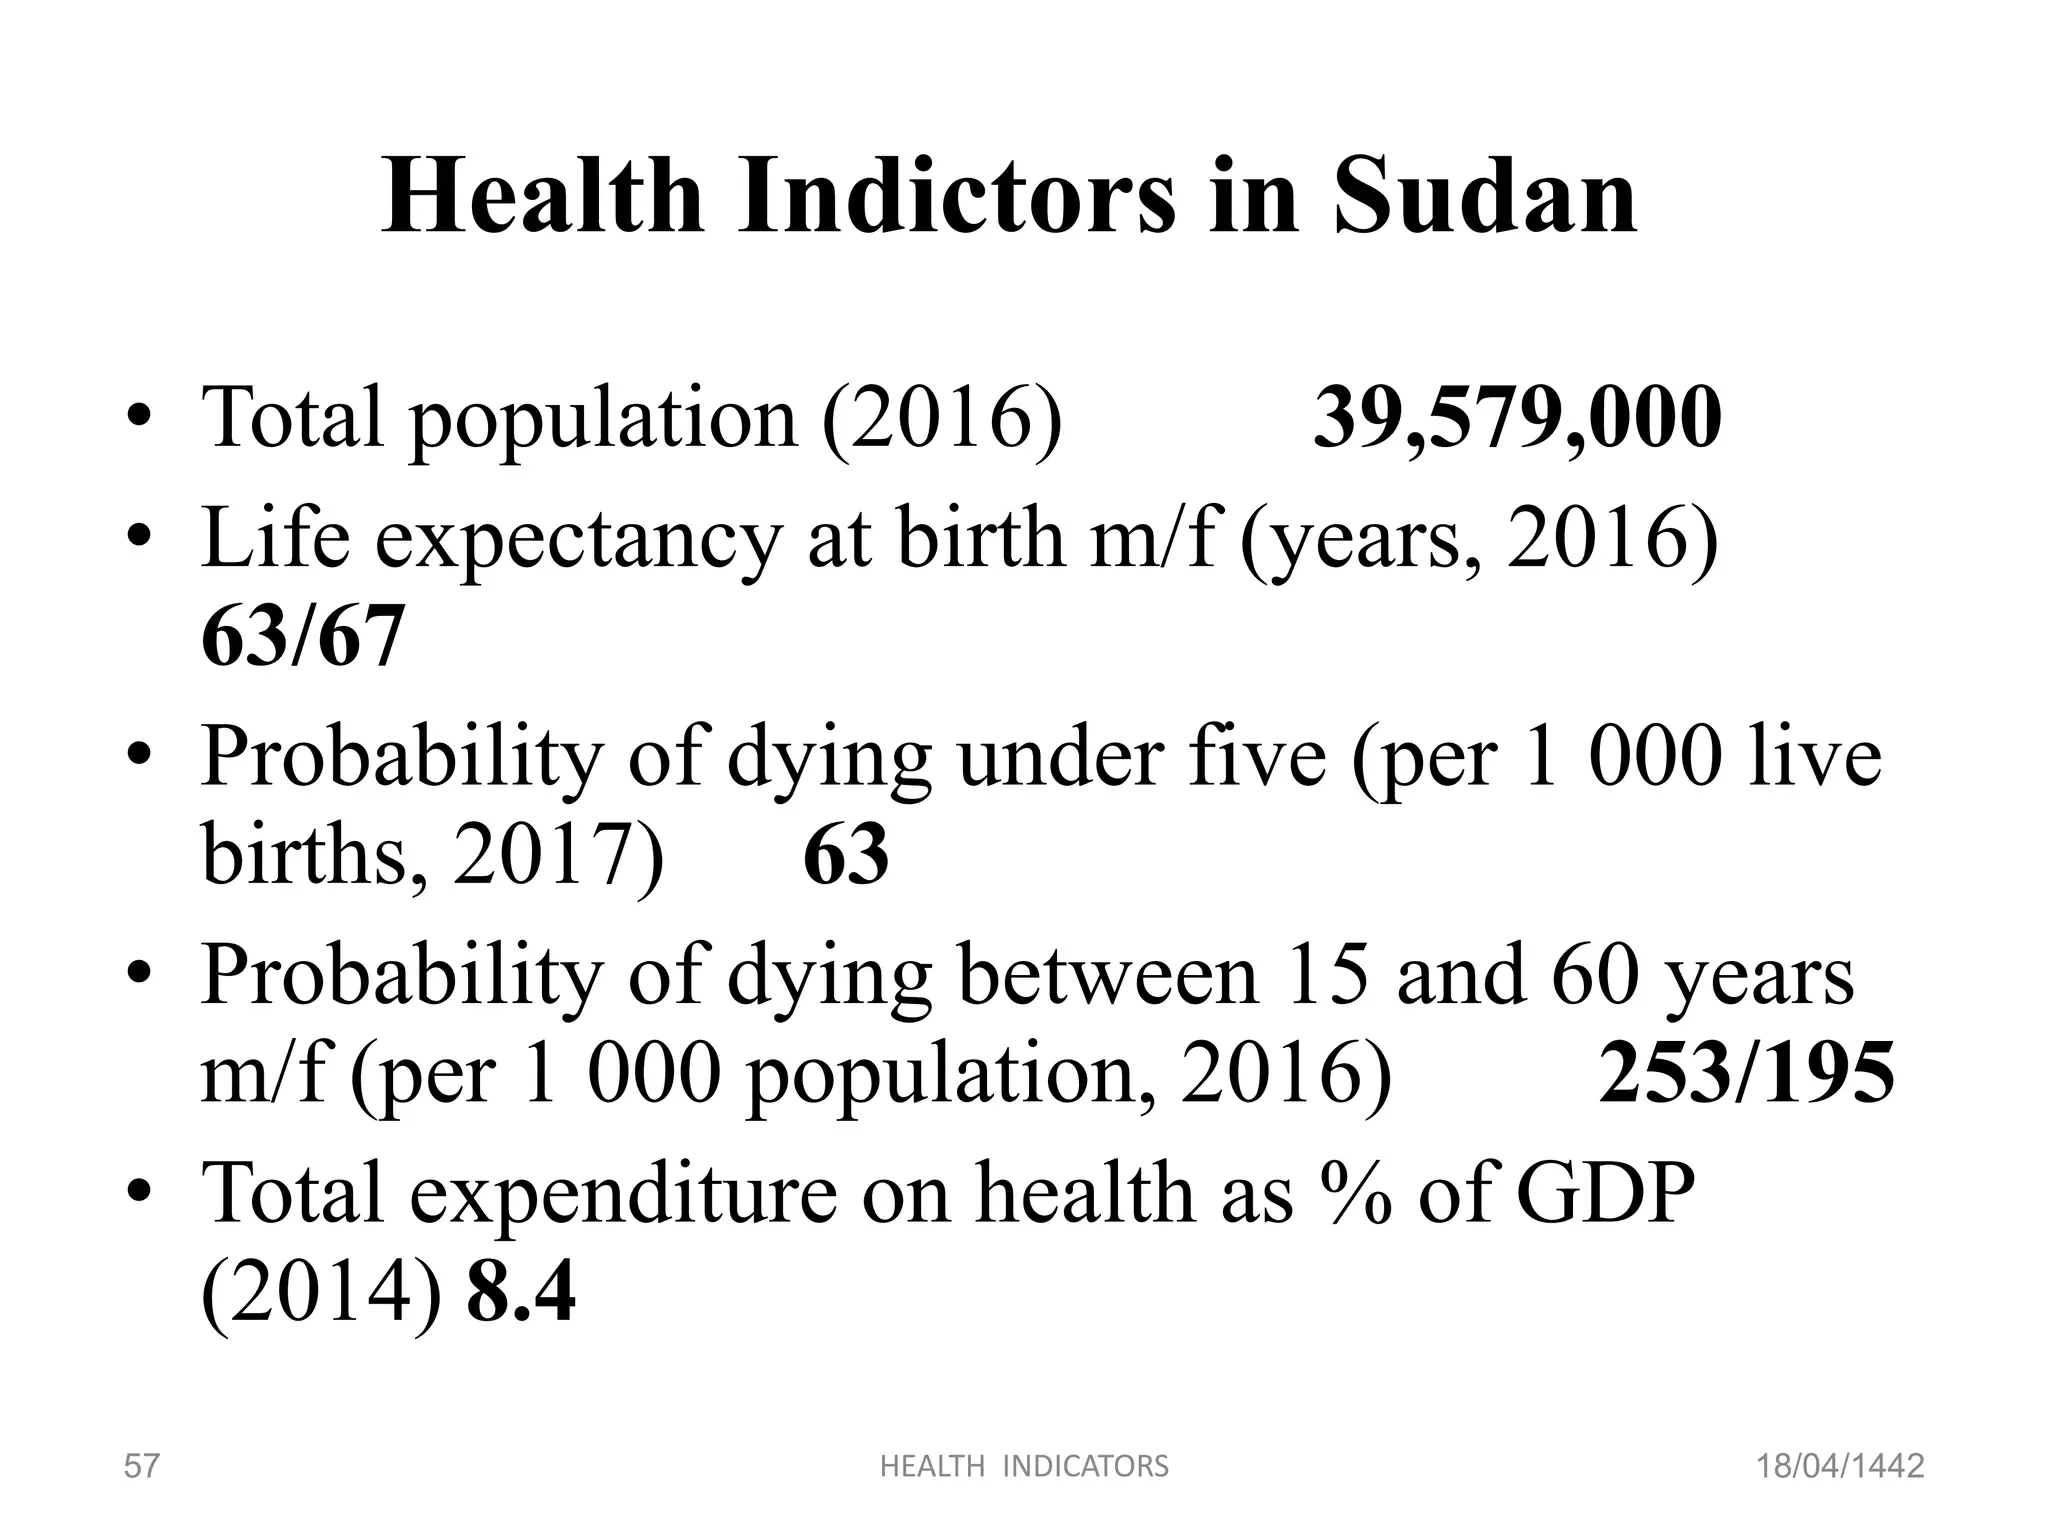
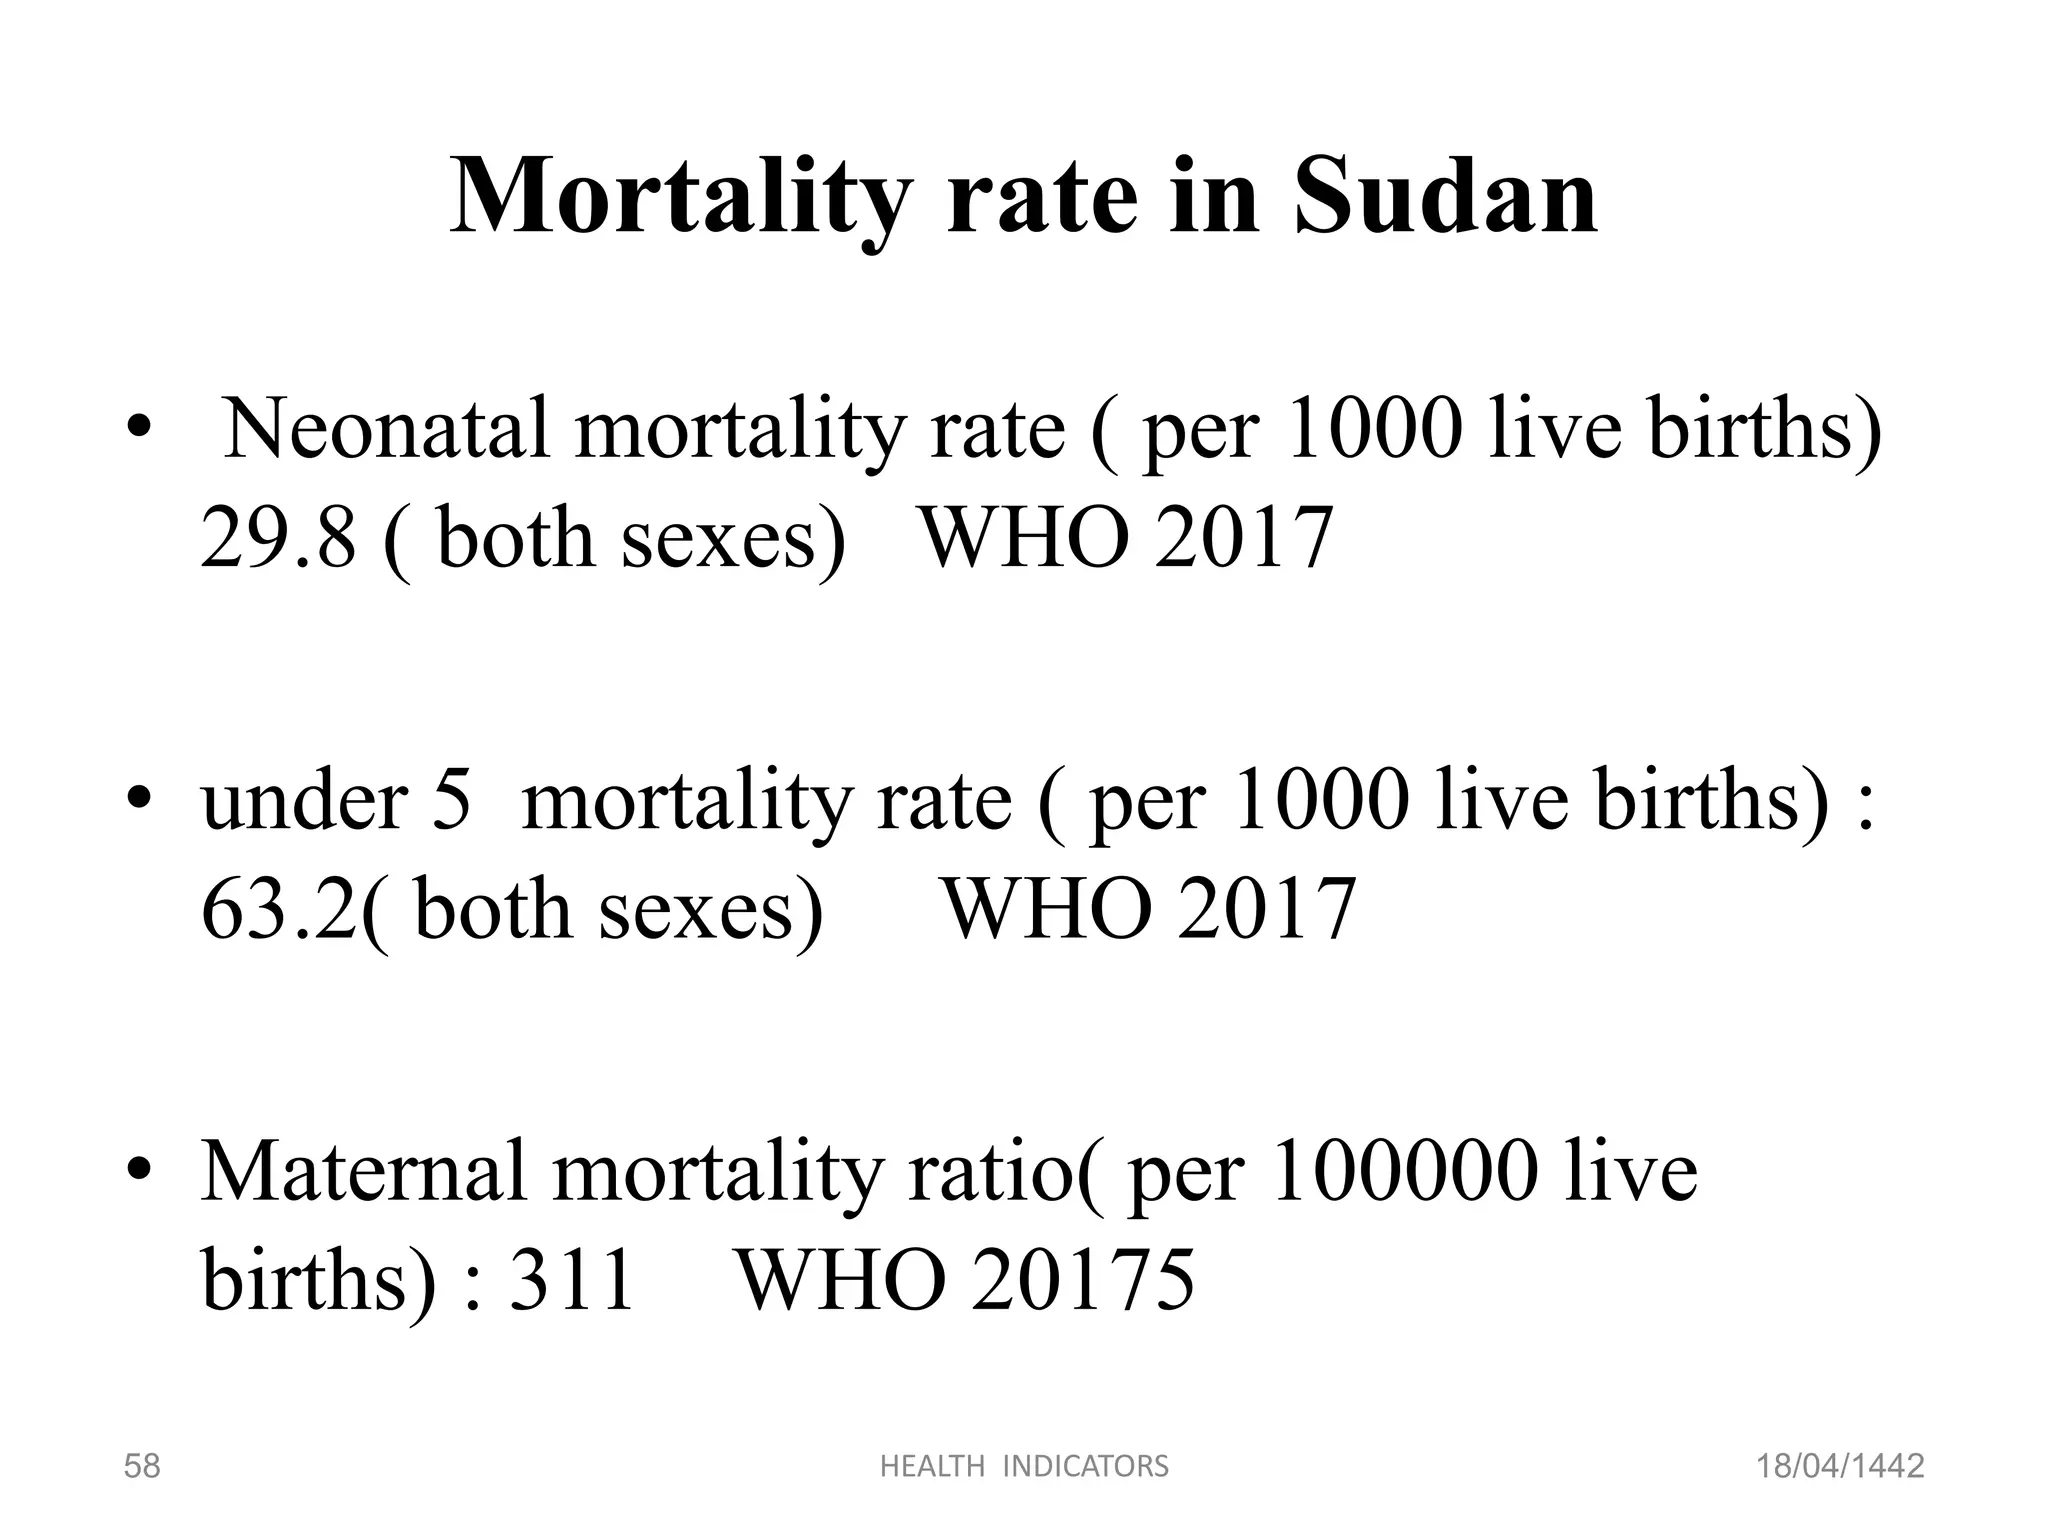
Detailed descriptions of various mortality indicators such as Crude Death Rate, Expectation of Life, and Infant Mortality Rate with examples from Sudan.Definitions and metrics associated with morbidity, including incidence and prevalence rates.
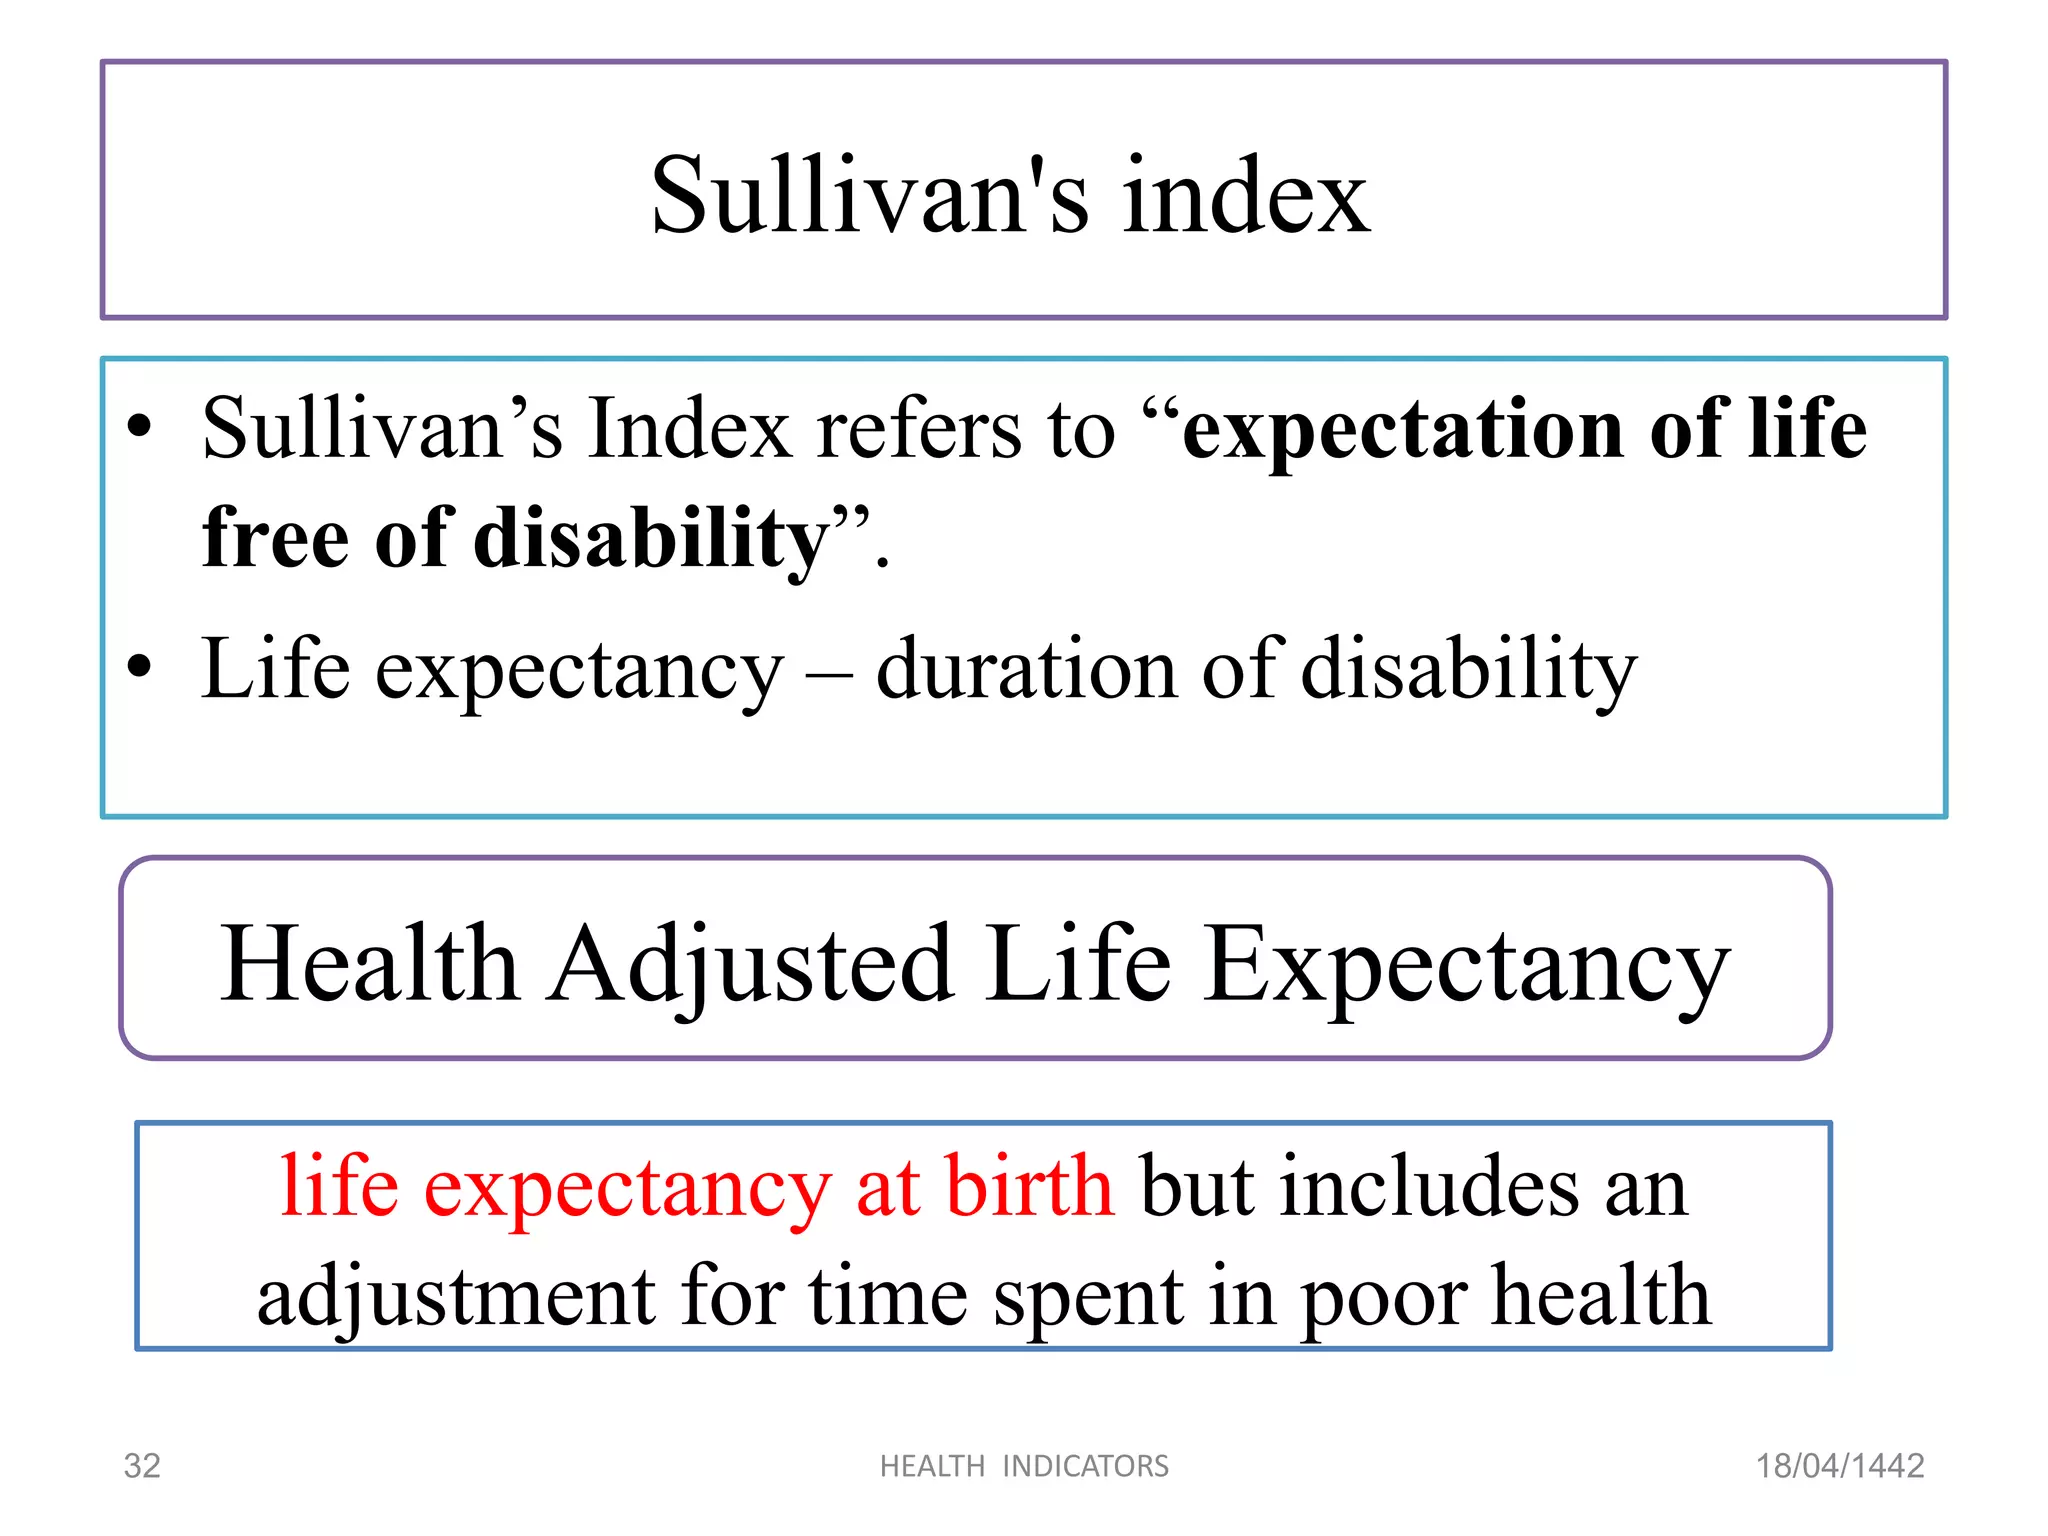
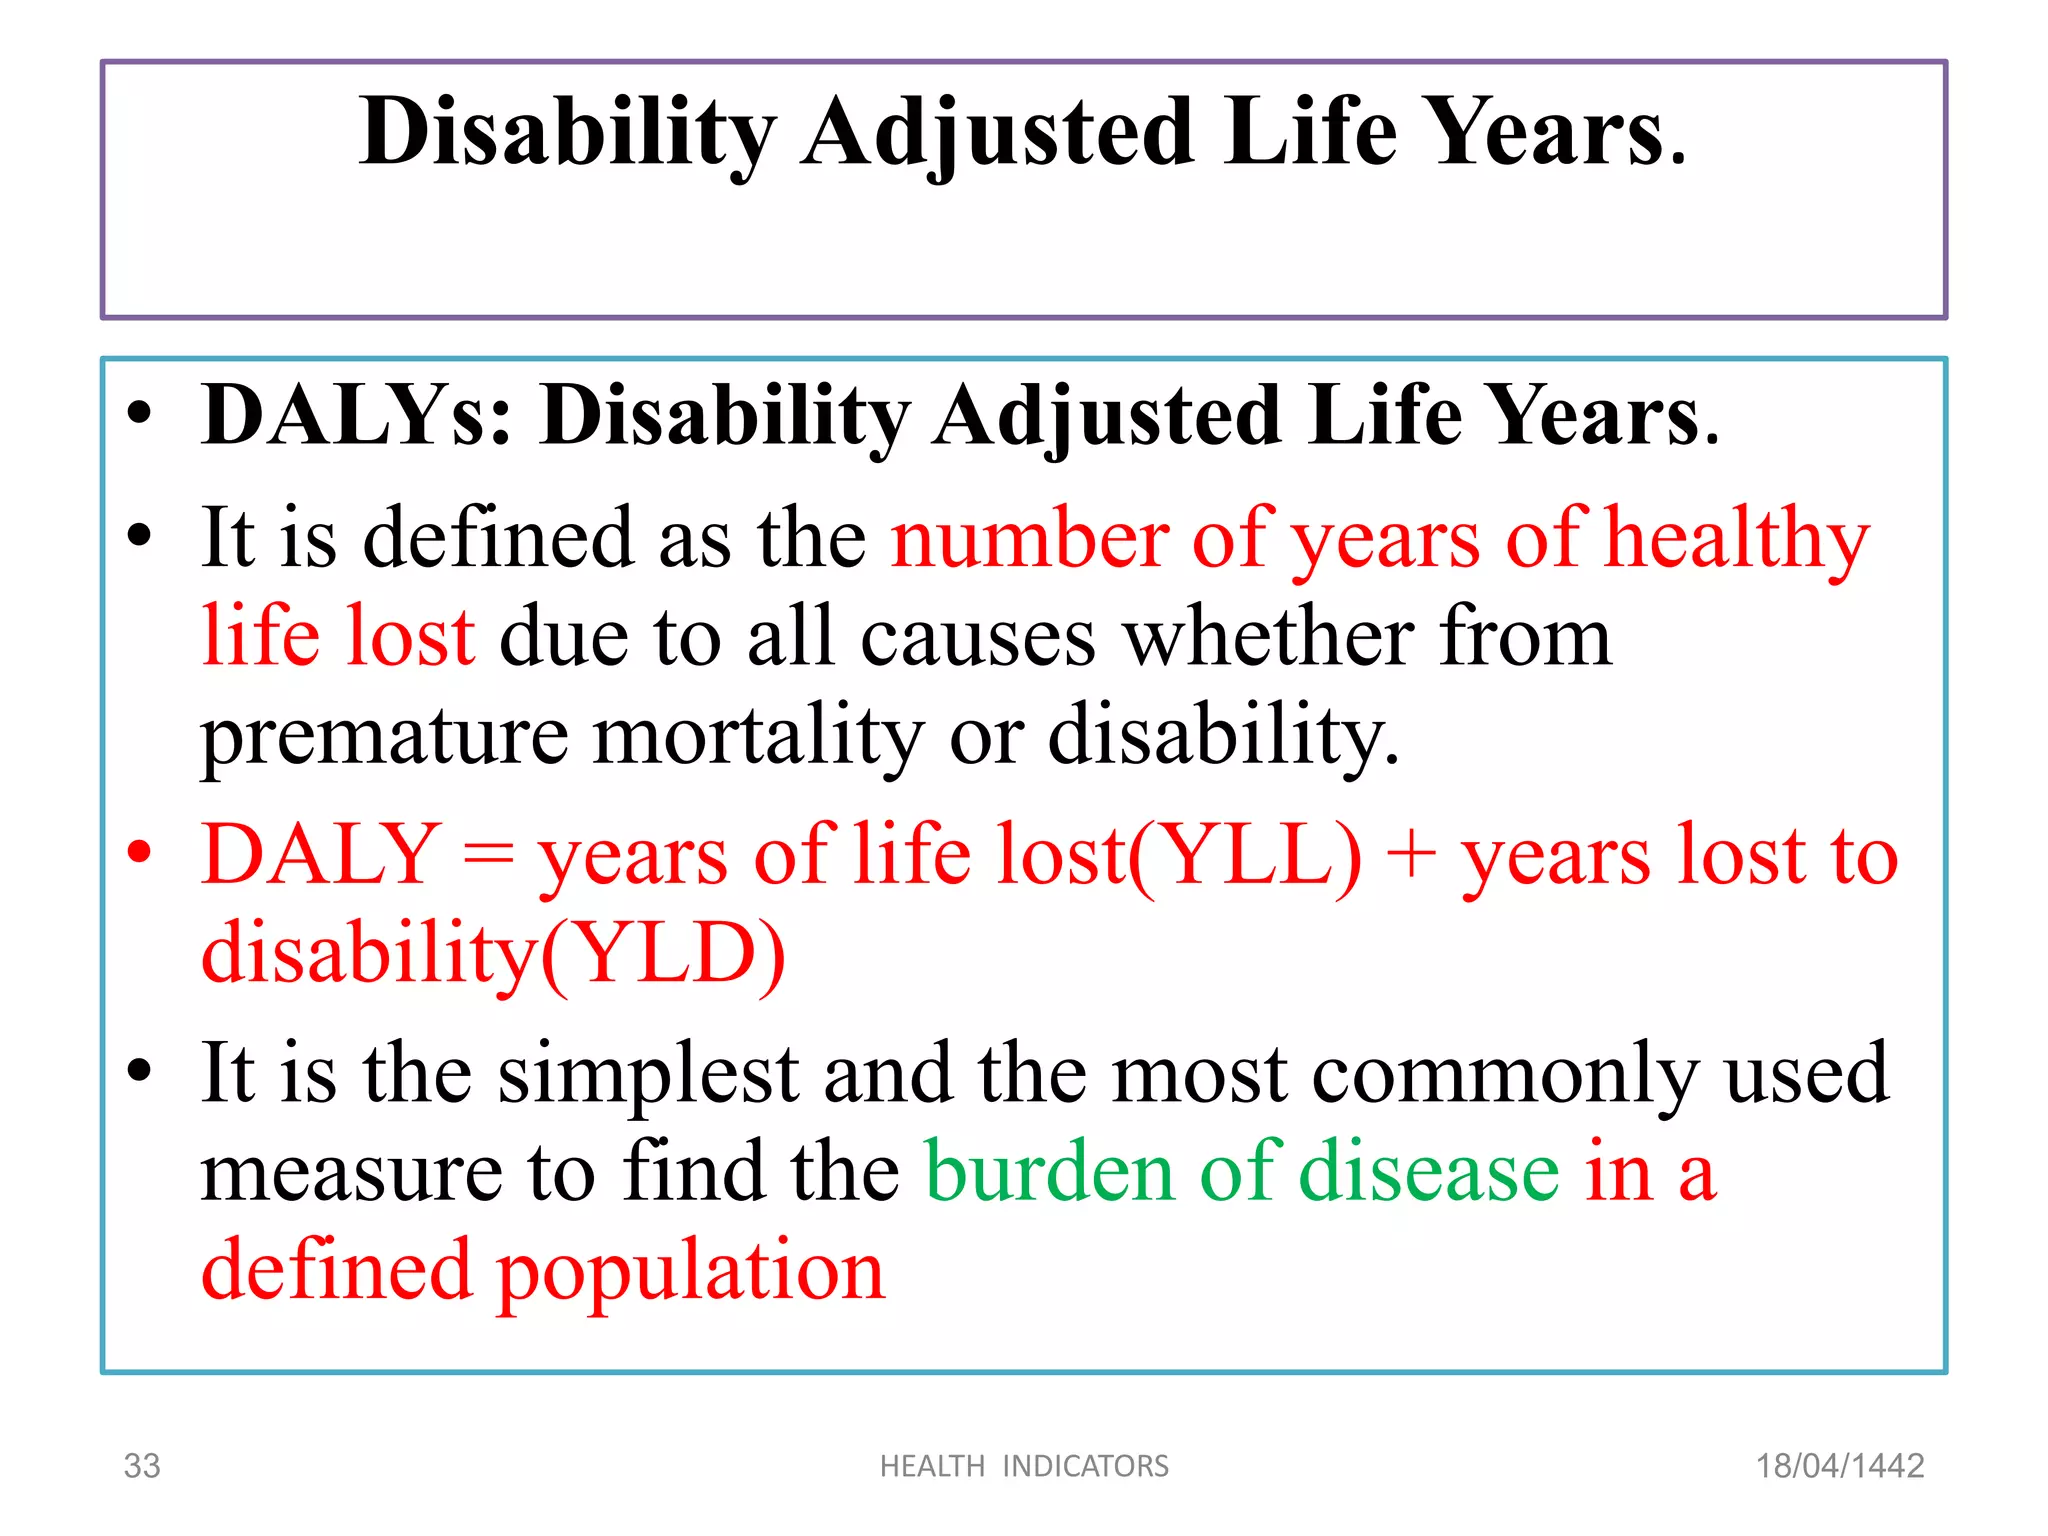
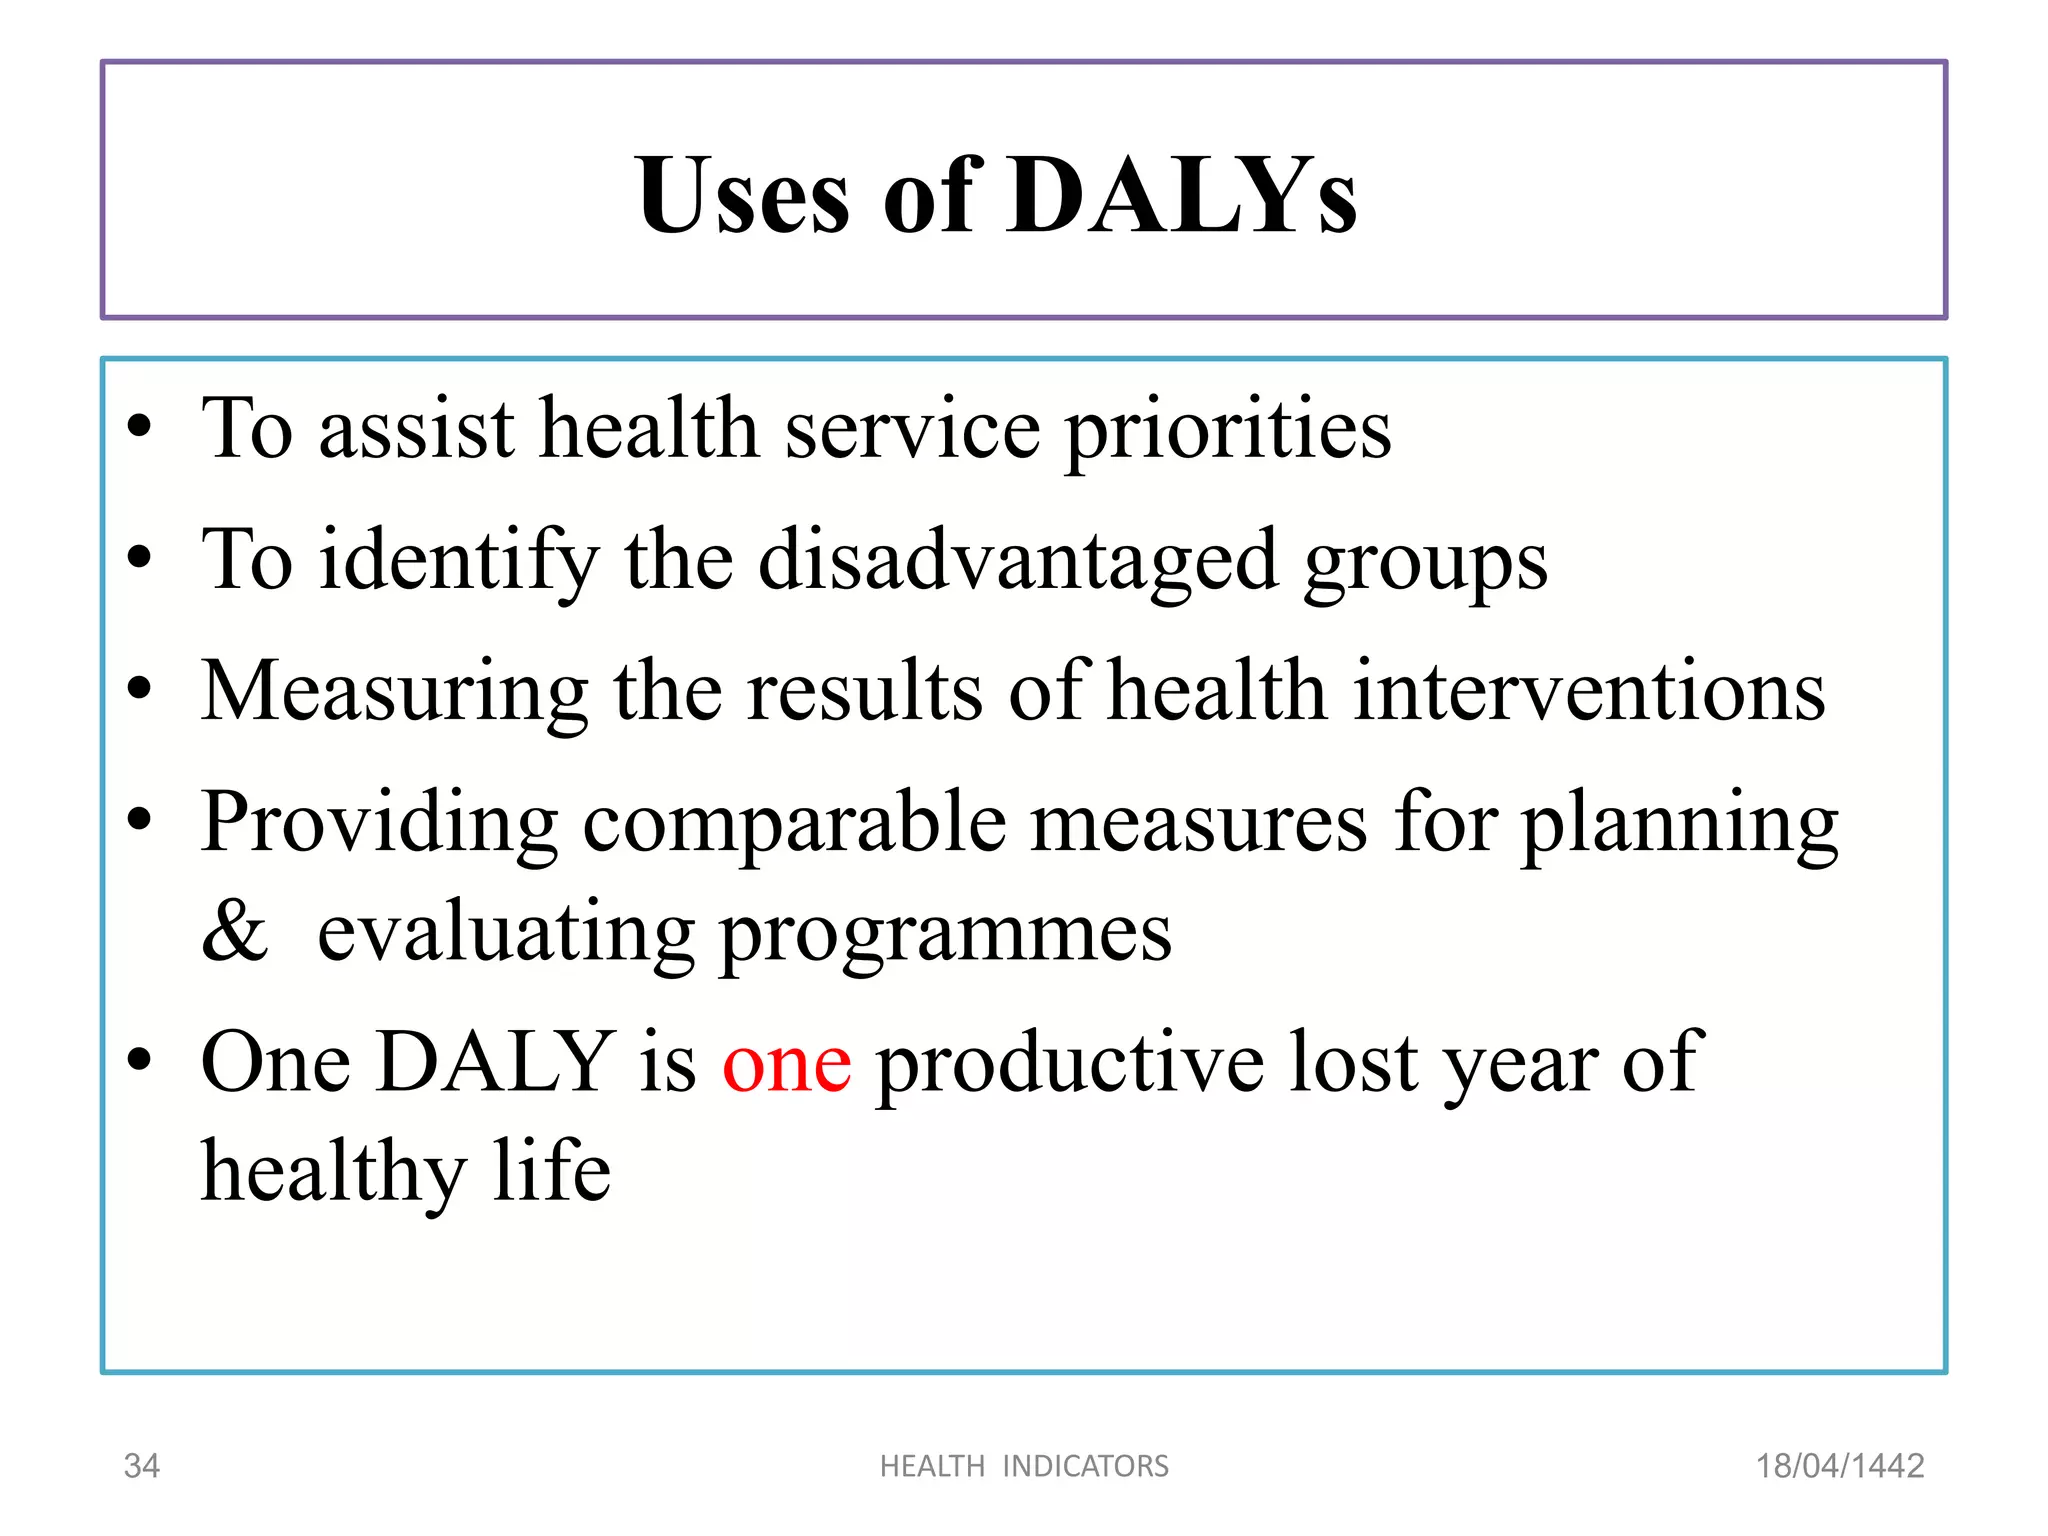
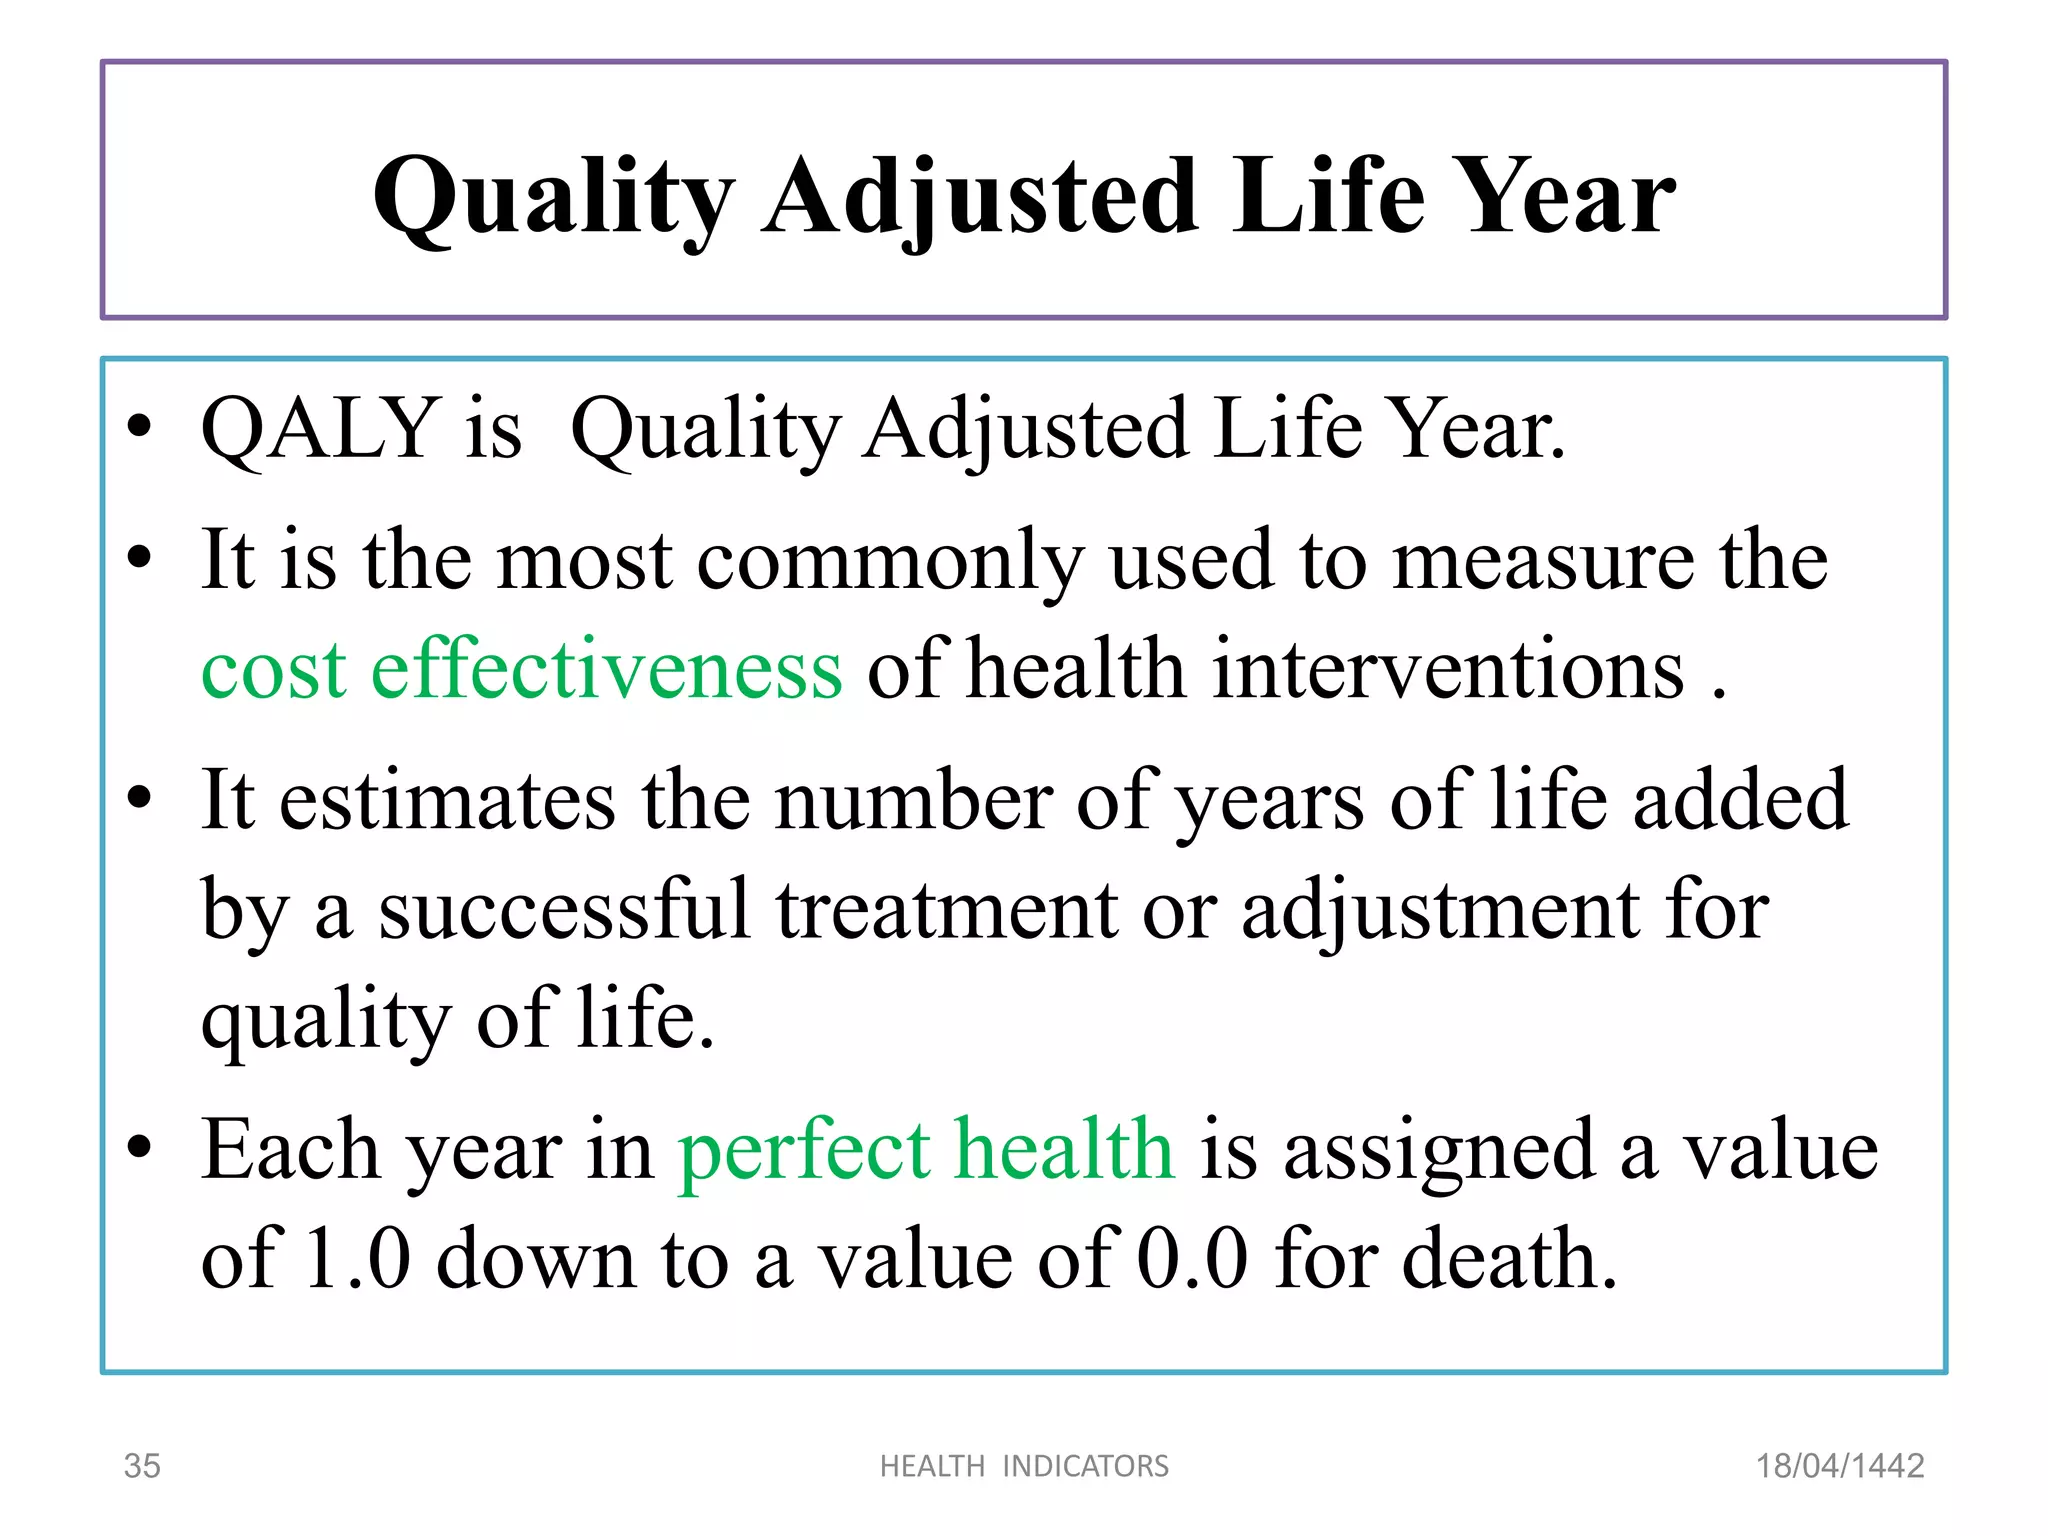
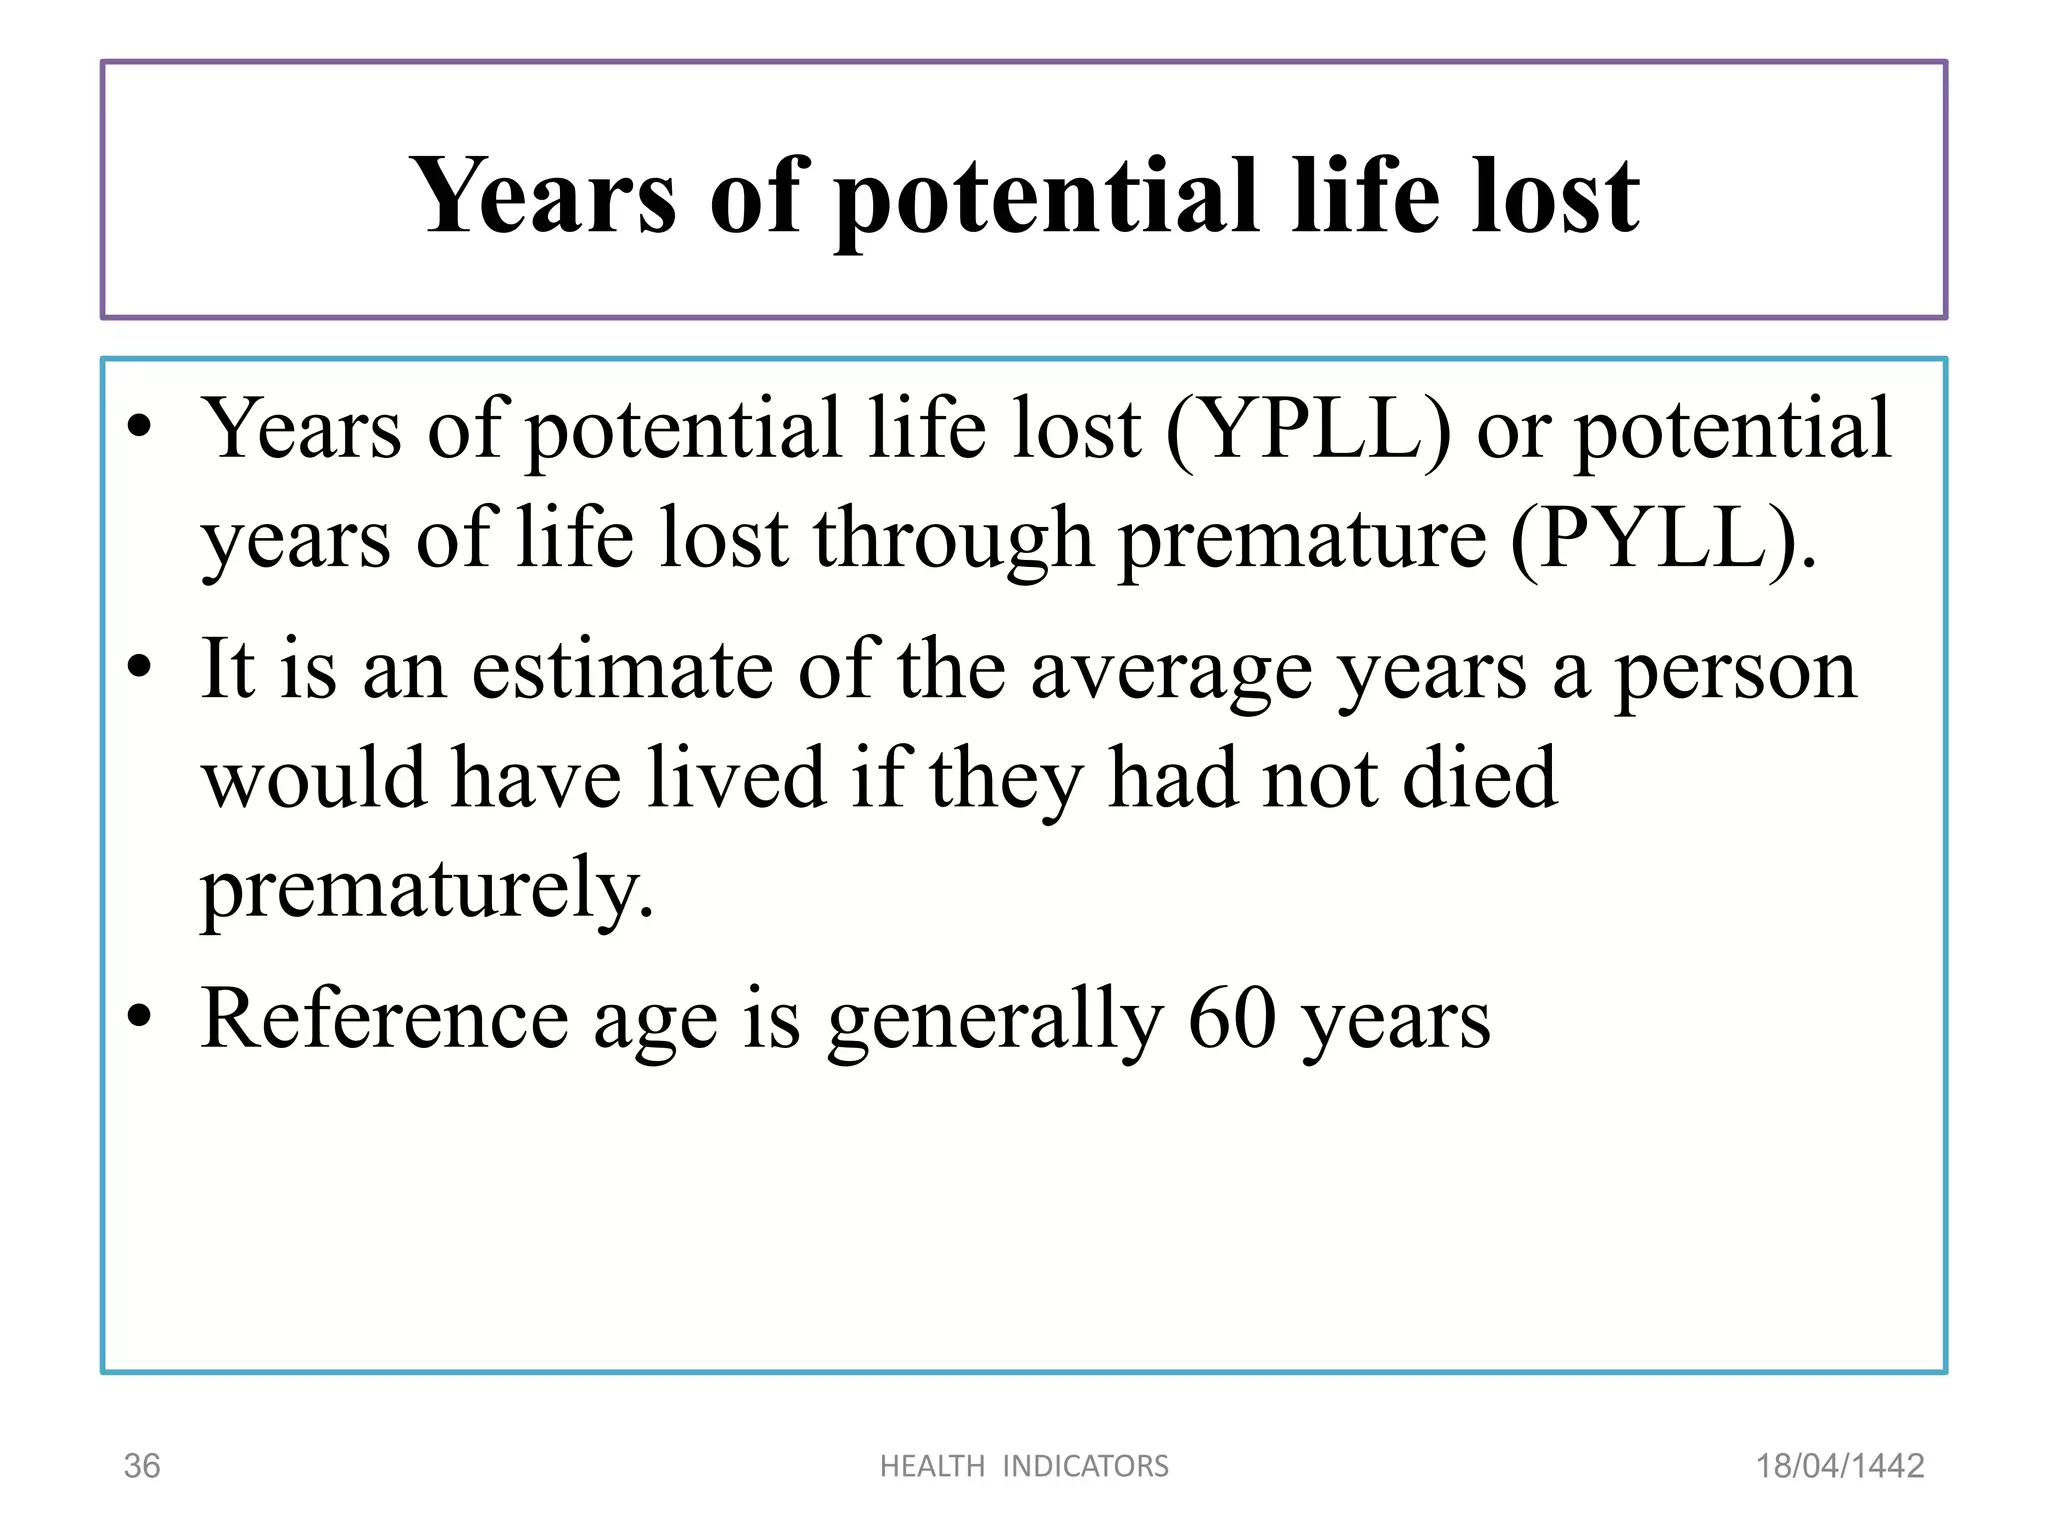
Discussion on disability rates, Sullivan's Index, DALYs, QALYs, and Years of Potential Life Lost.
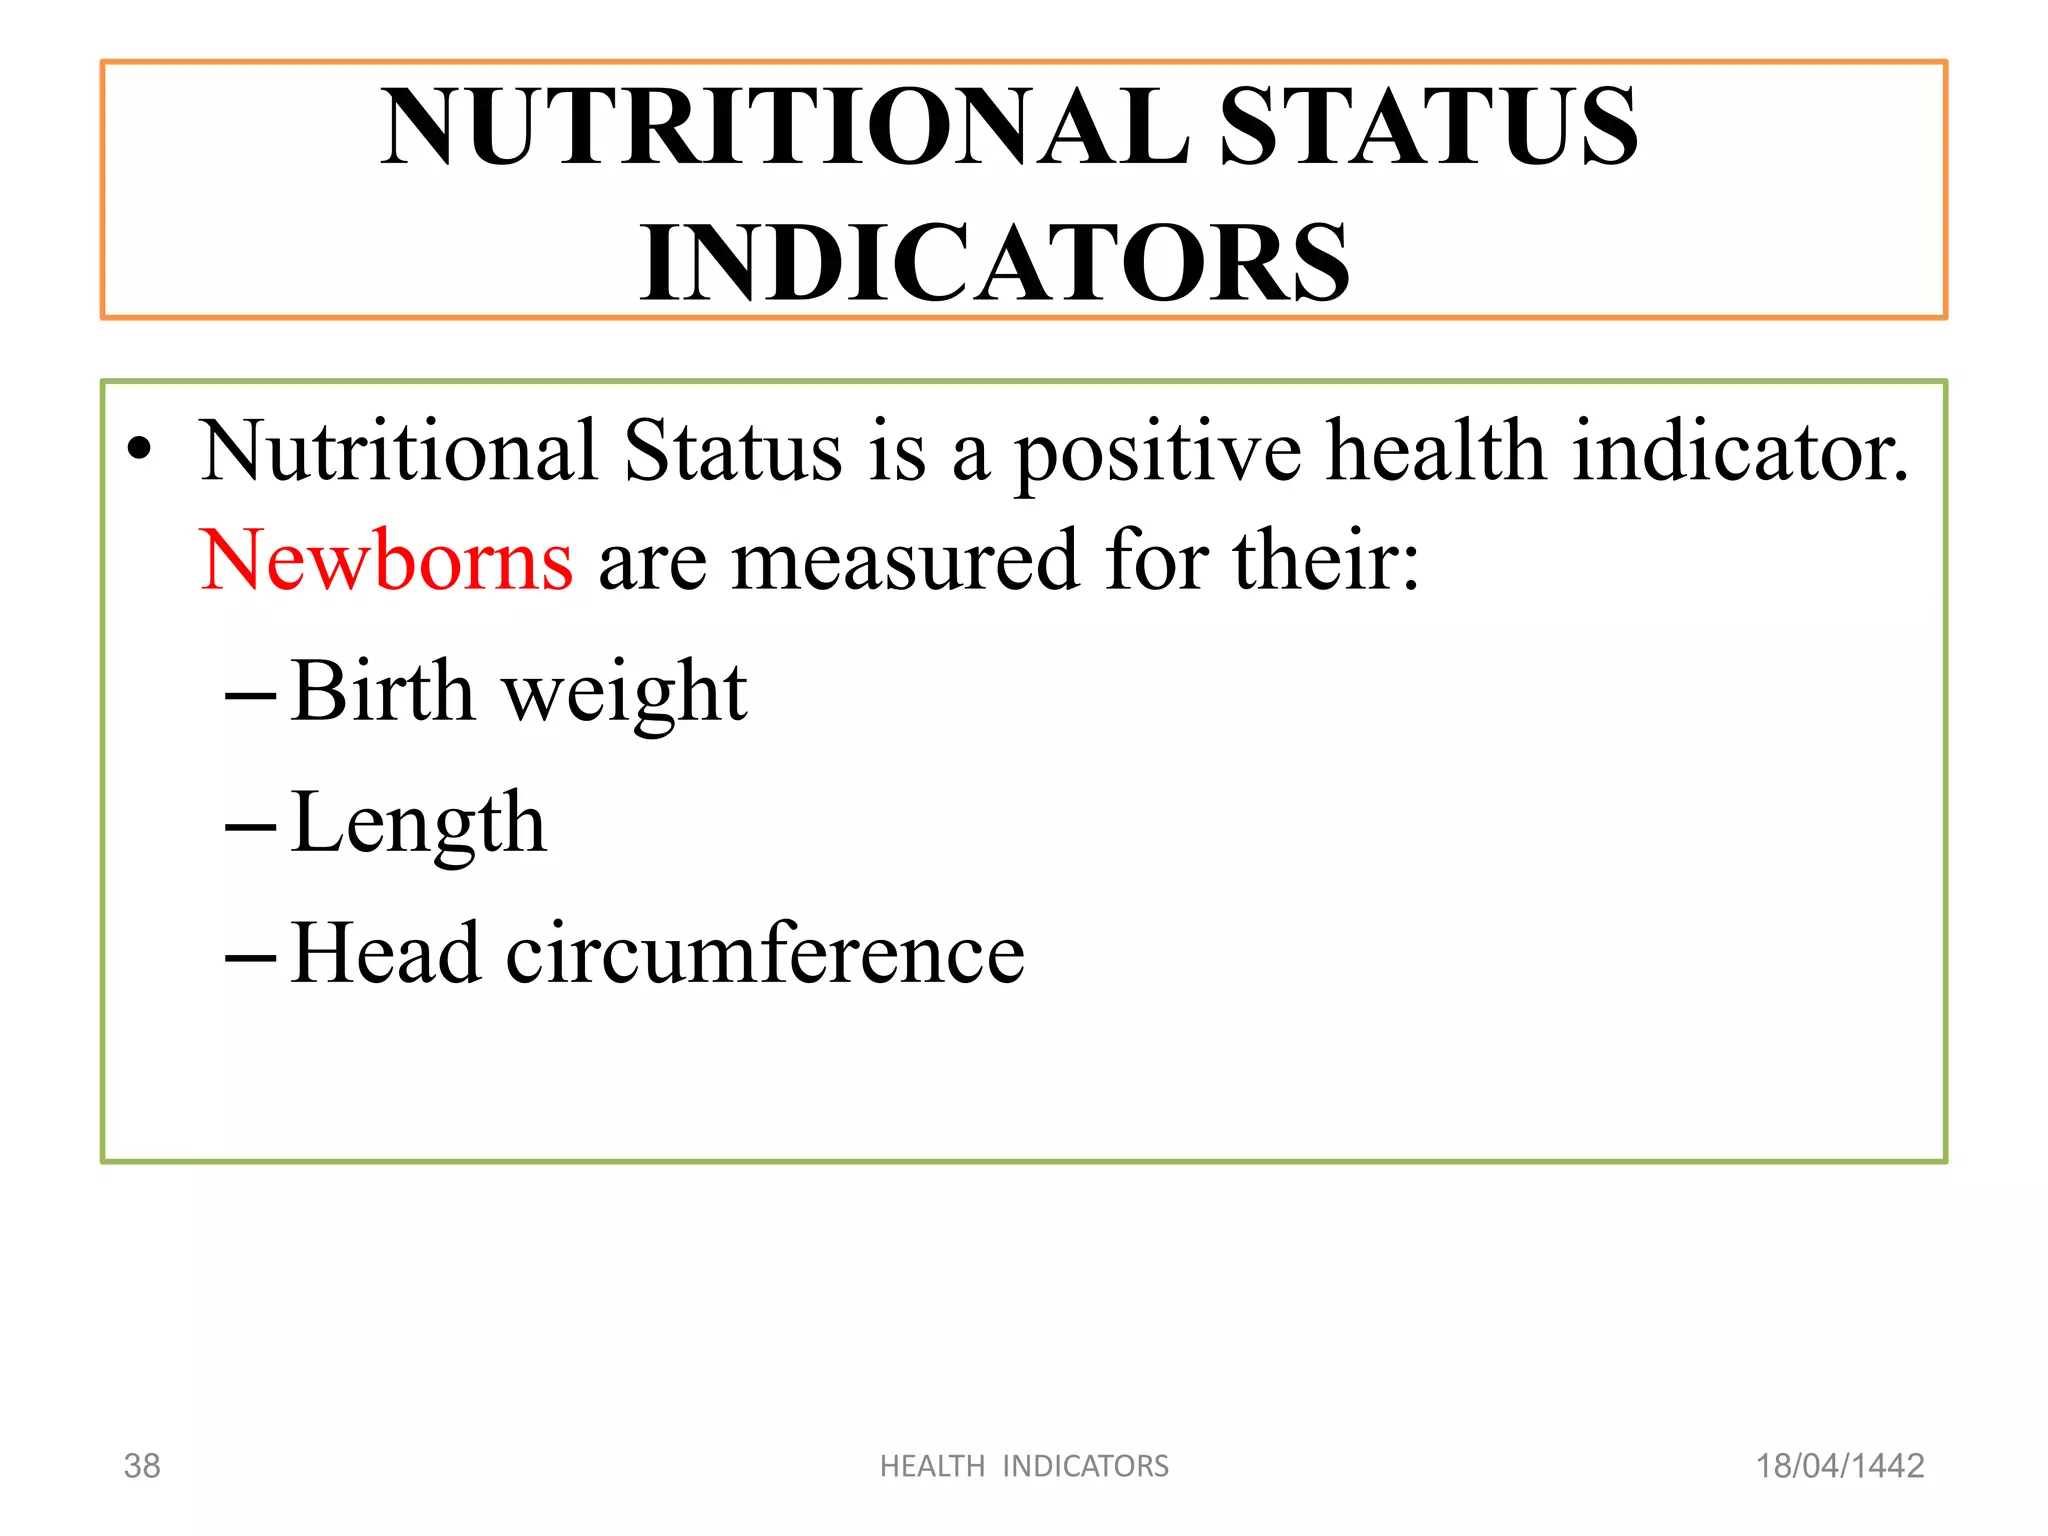
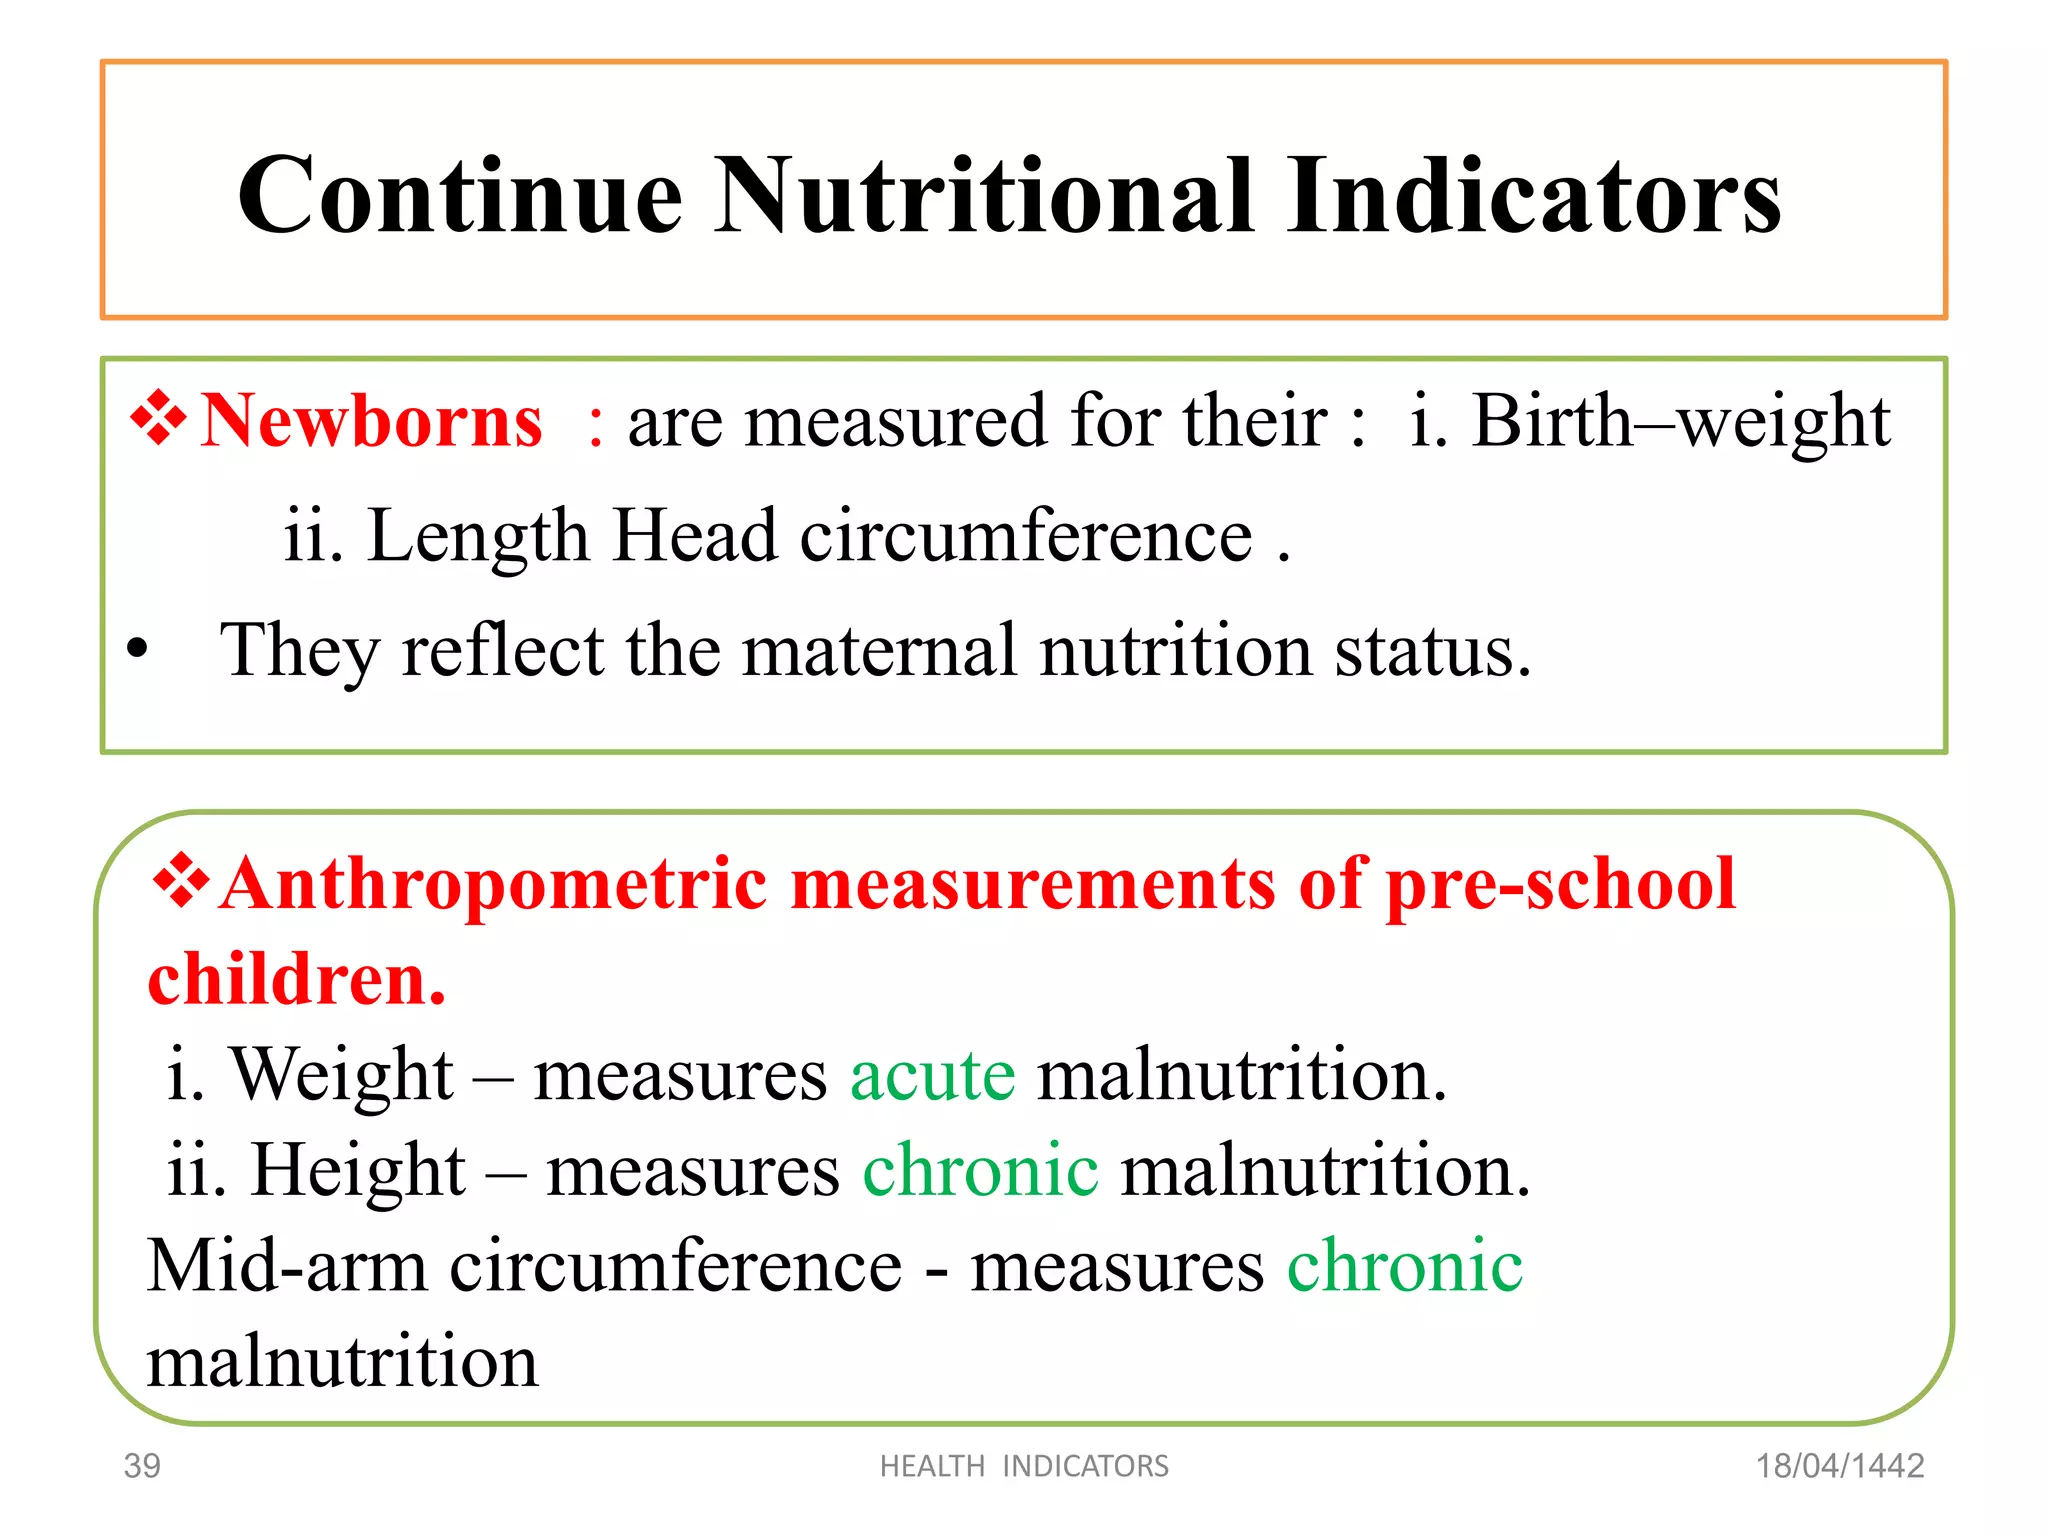
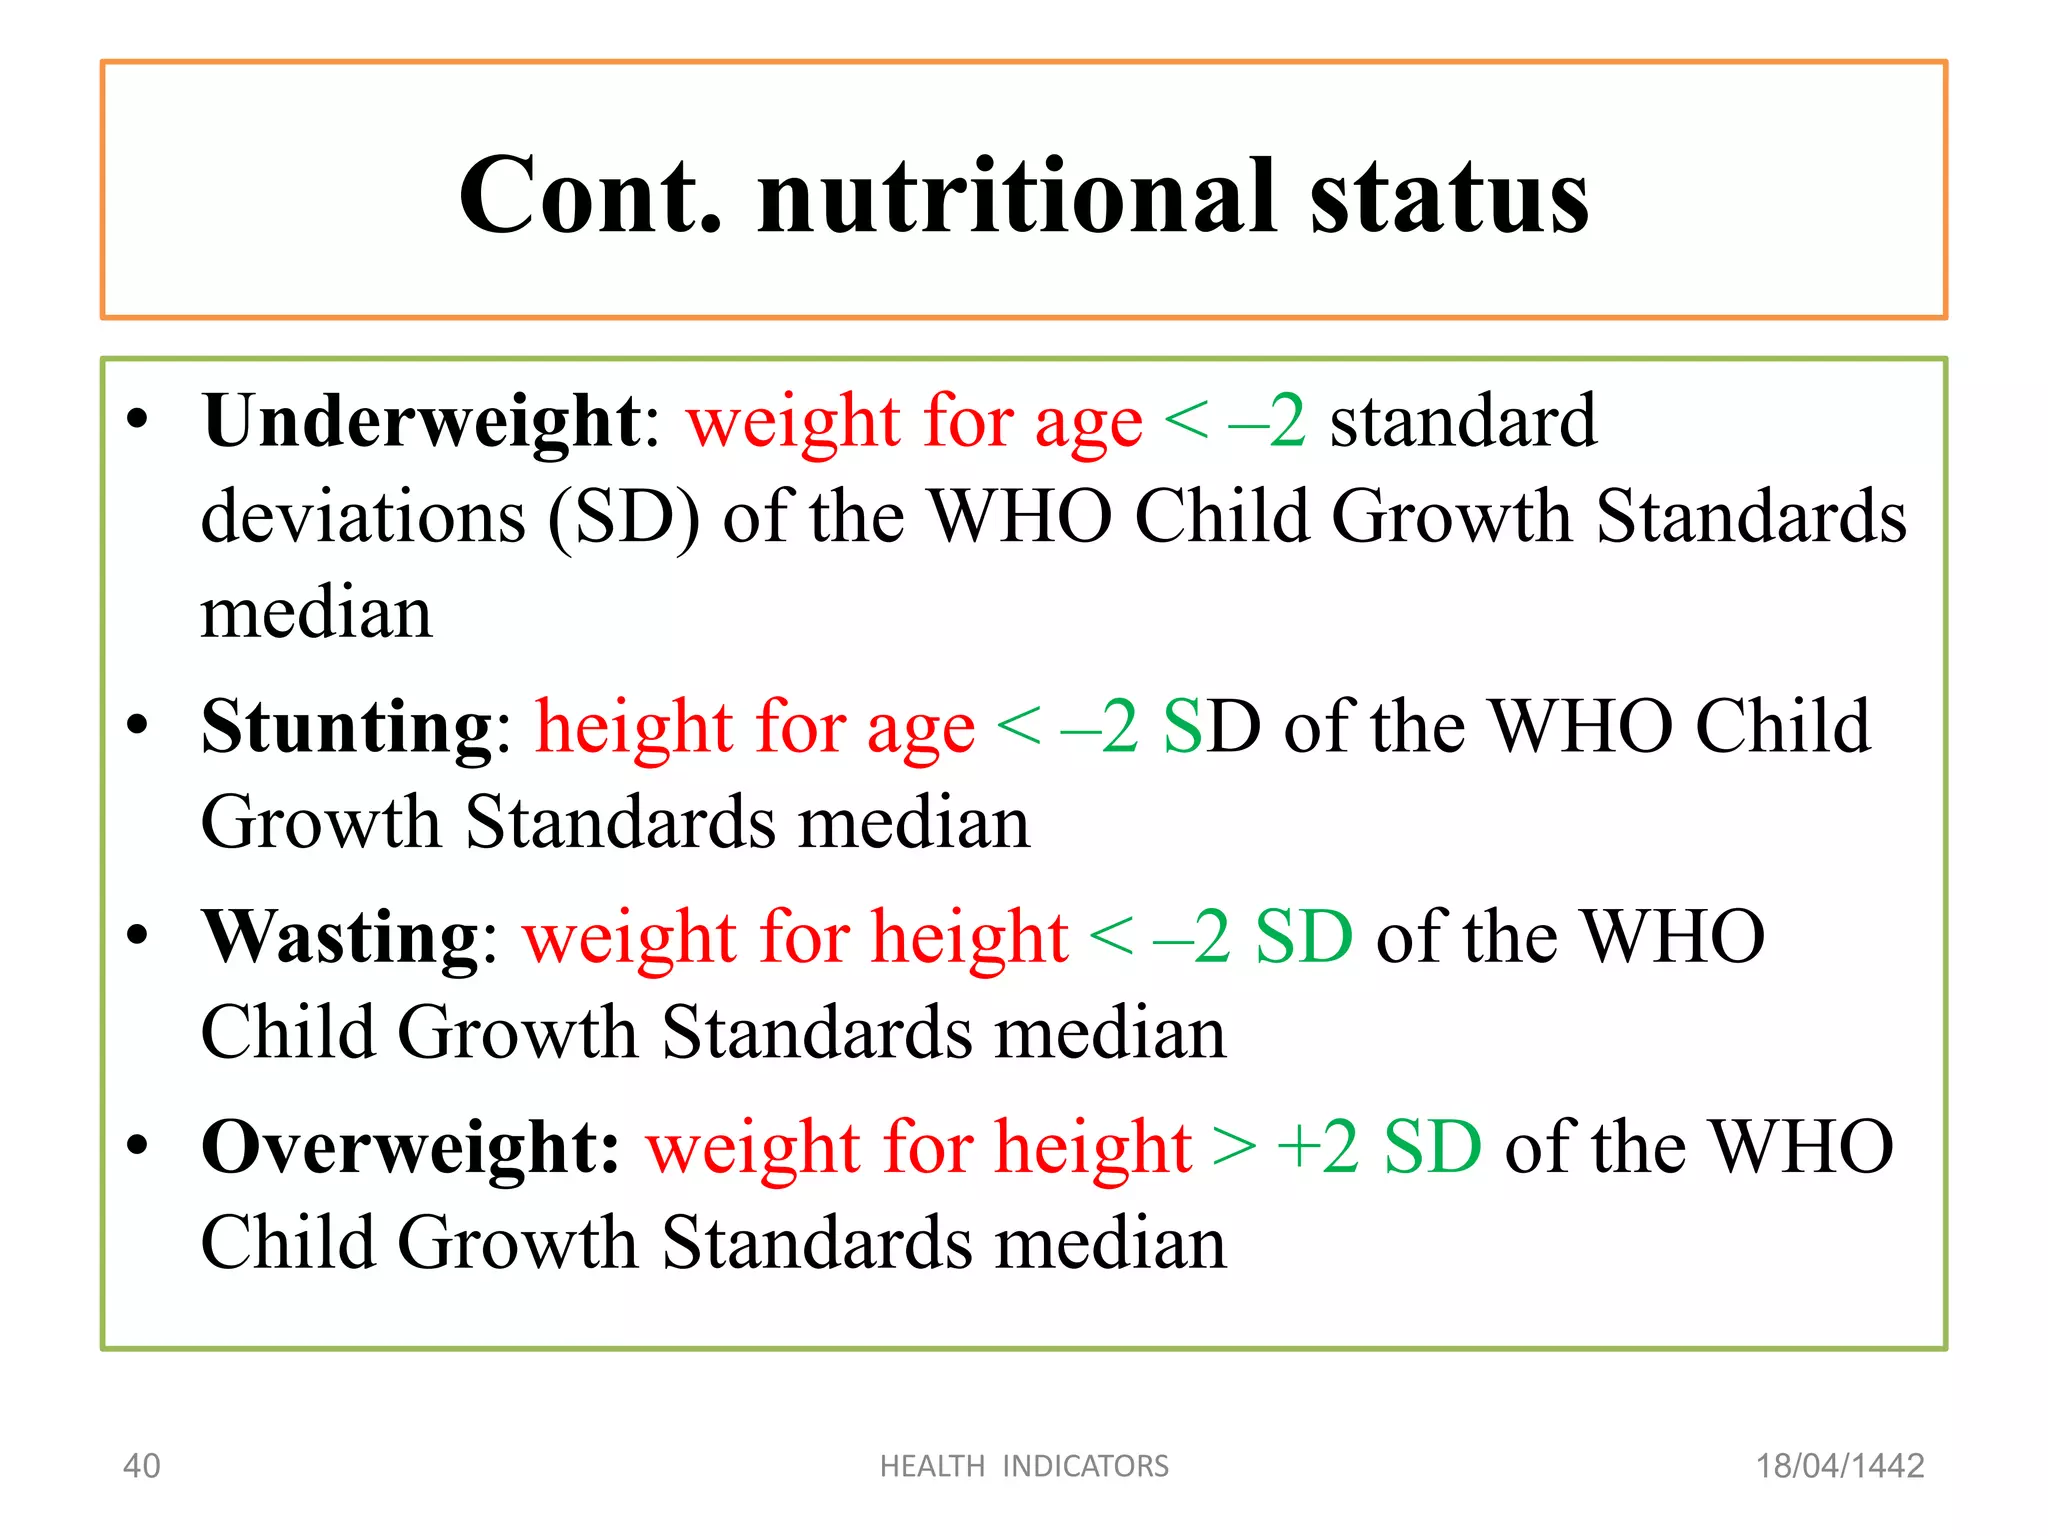
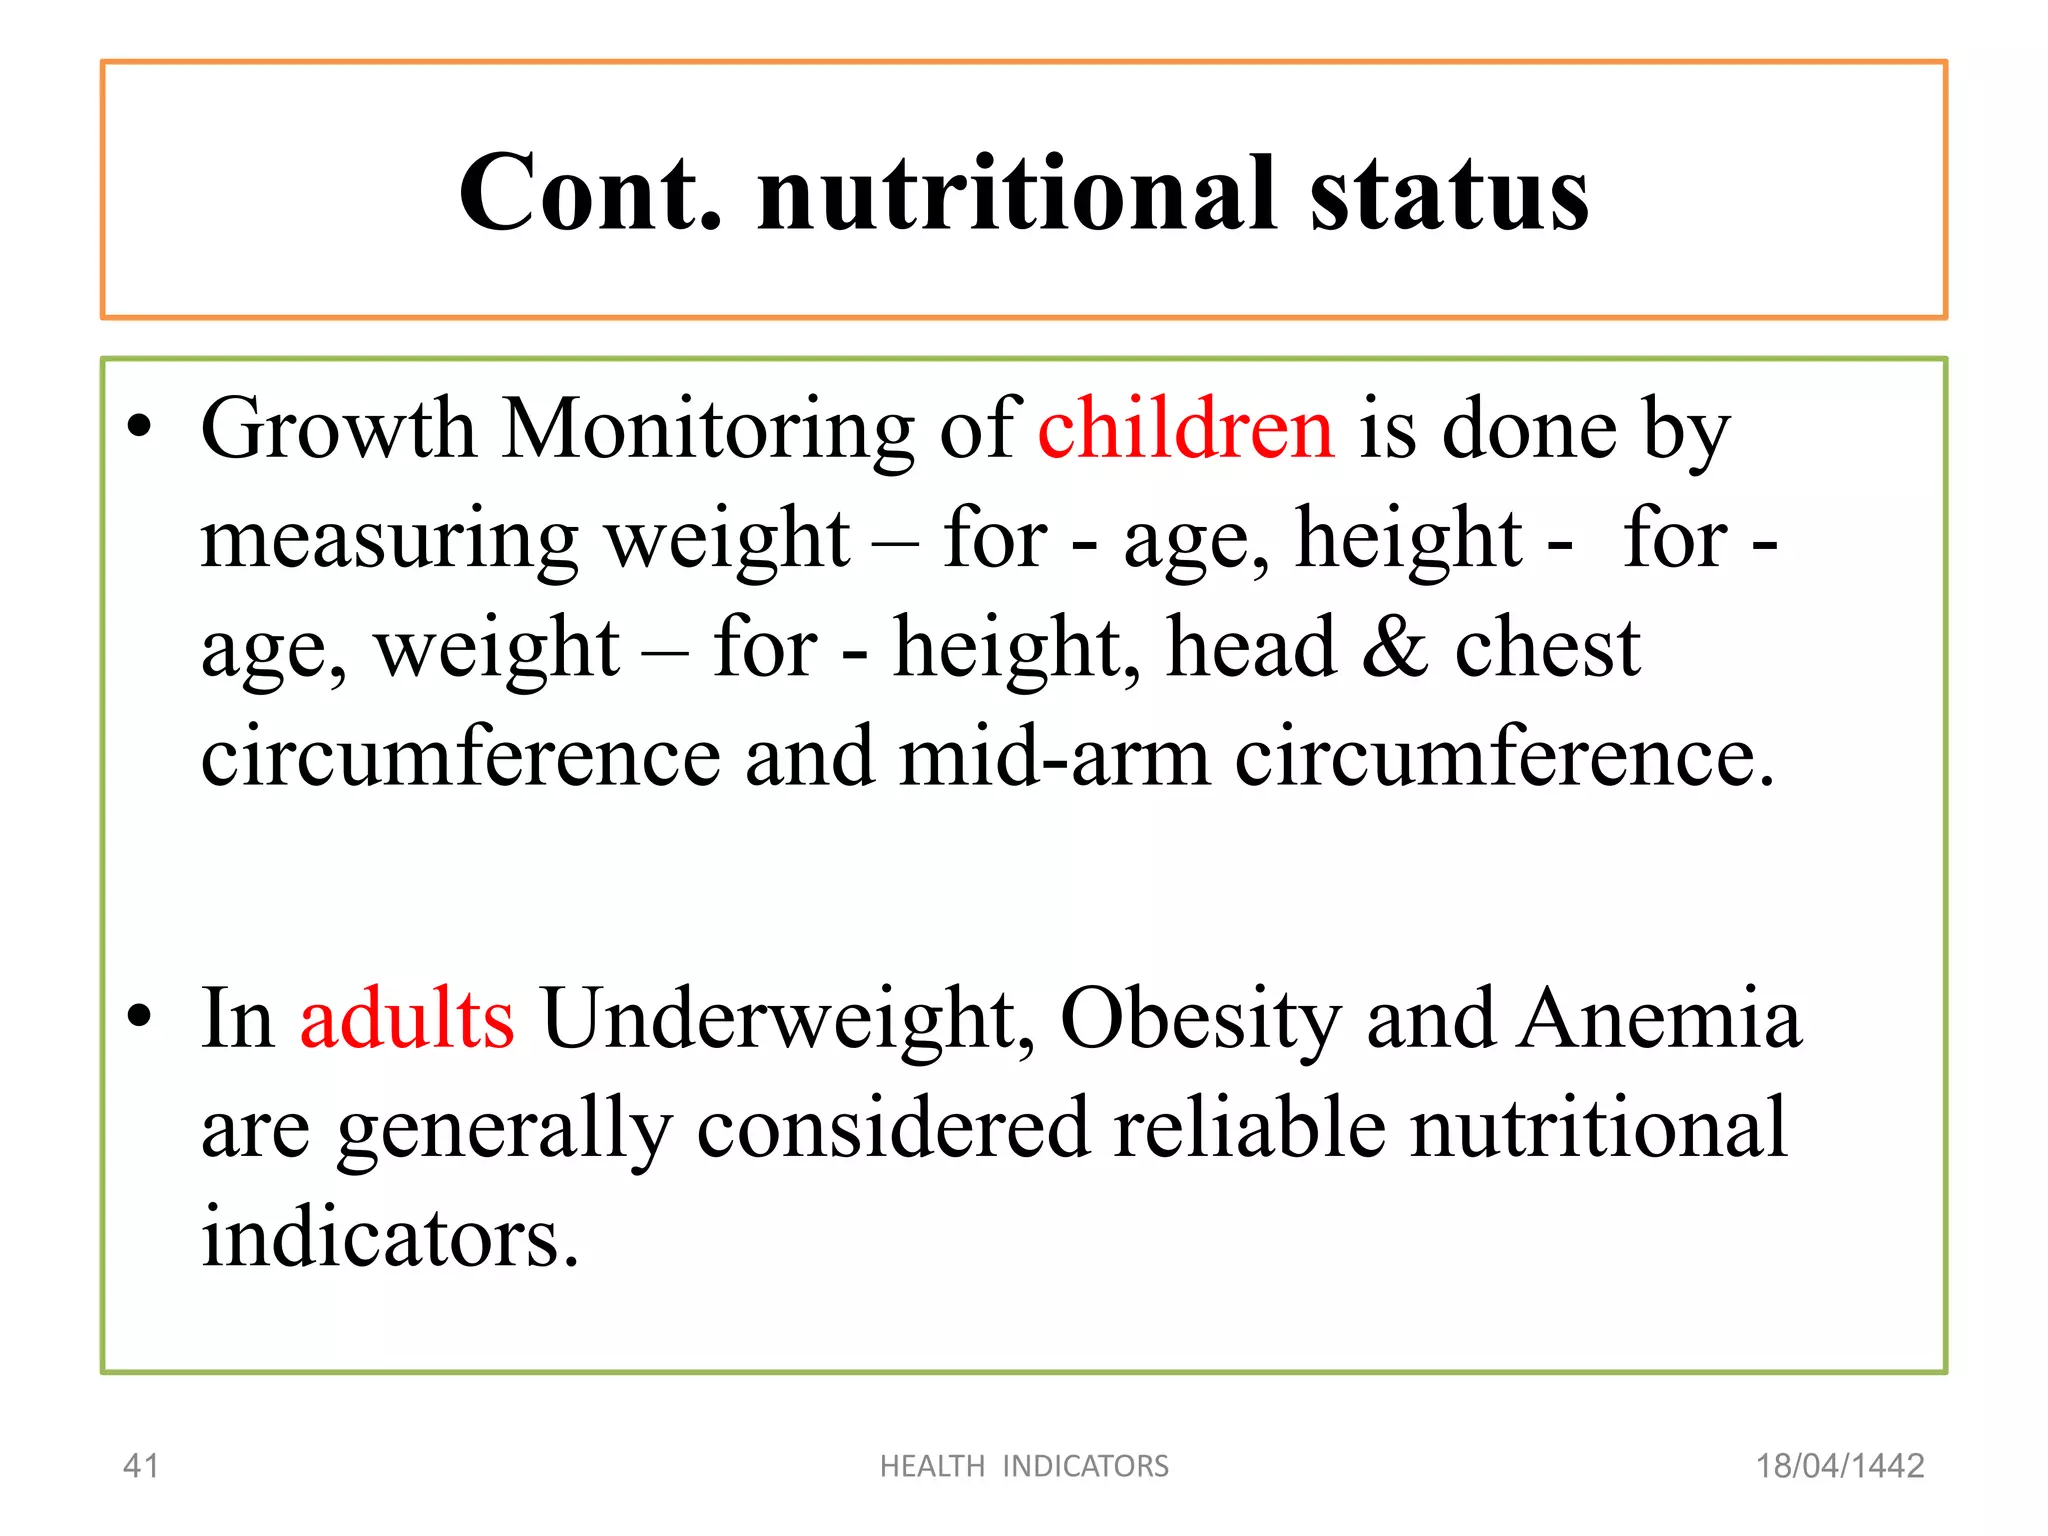
Indicators reflecting nutritional health through various measurements of growth and body conditions.
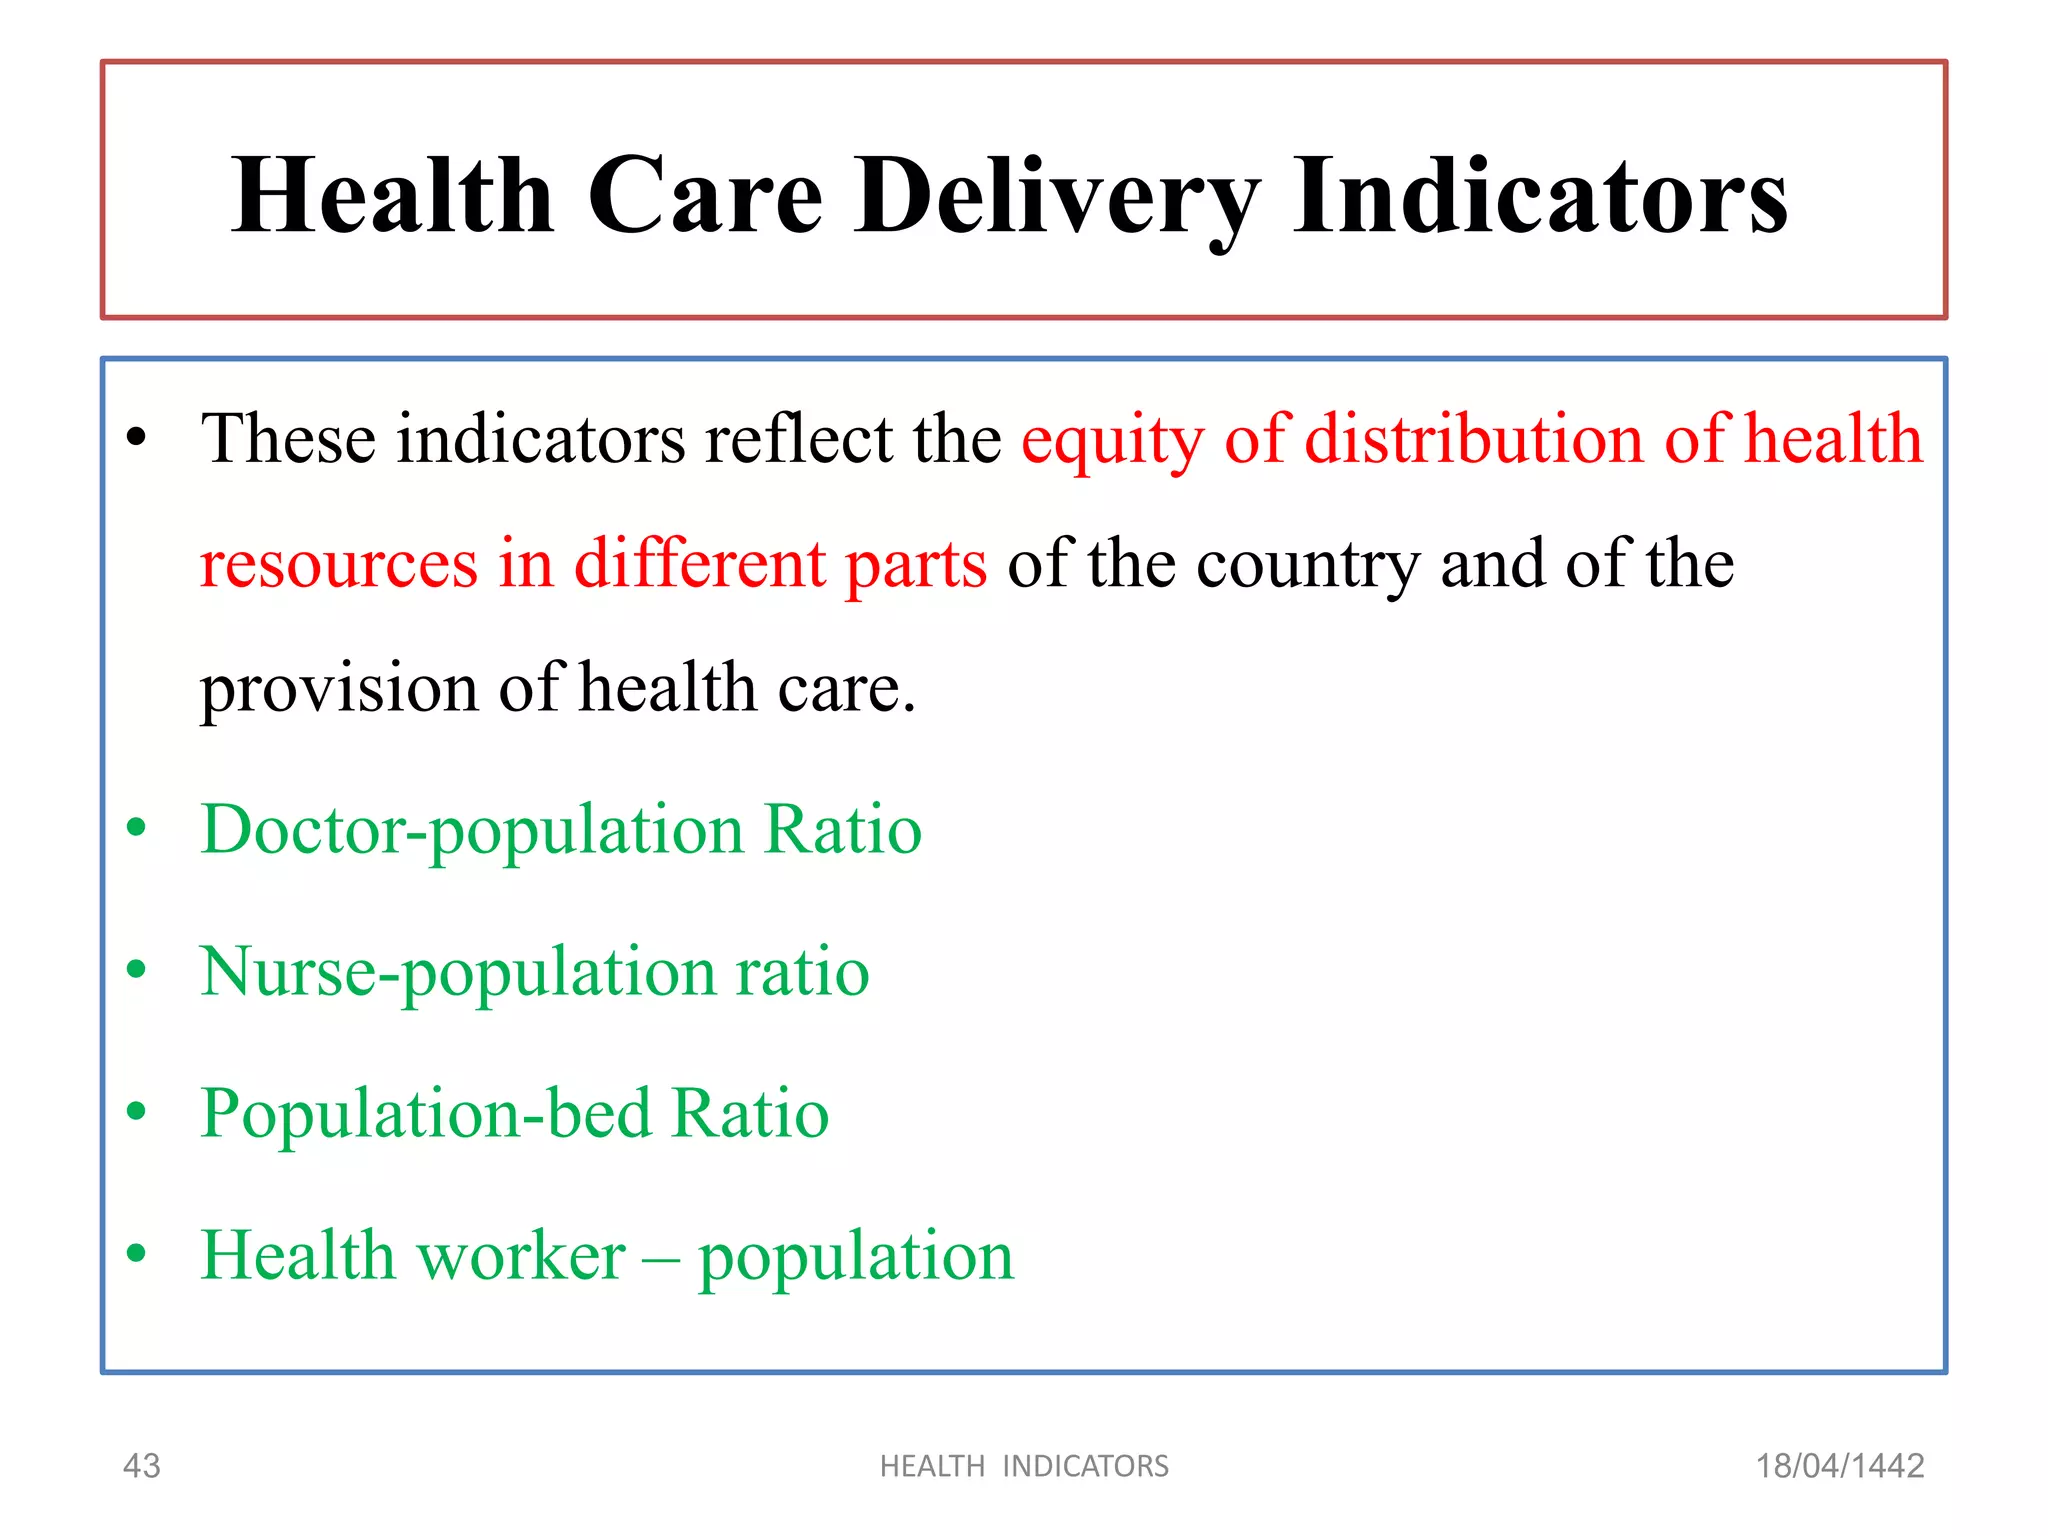
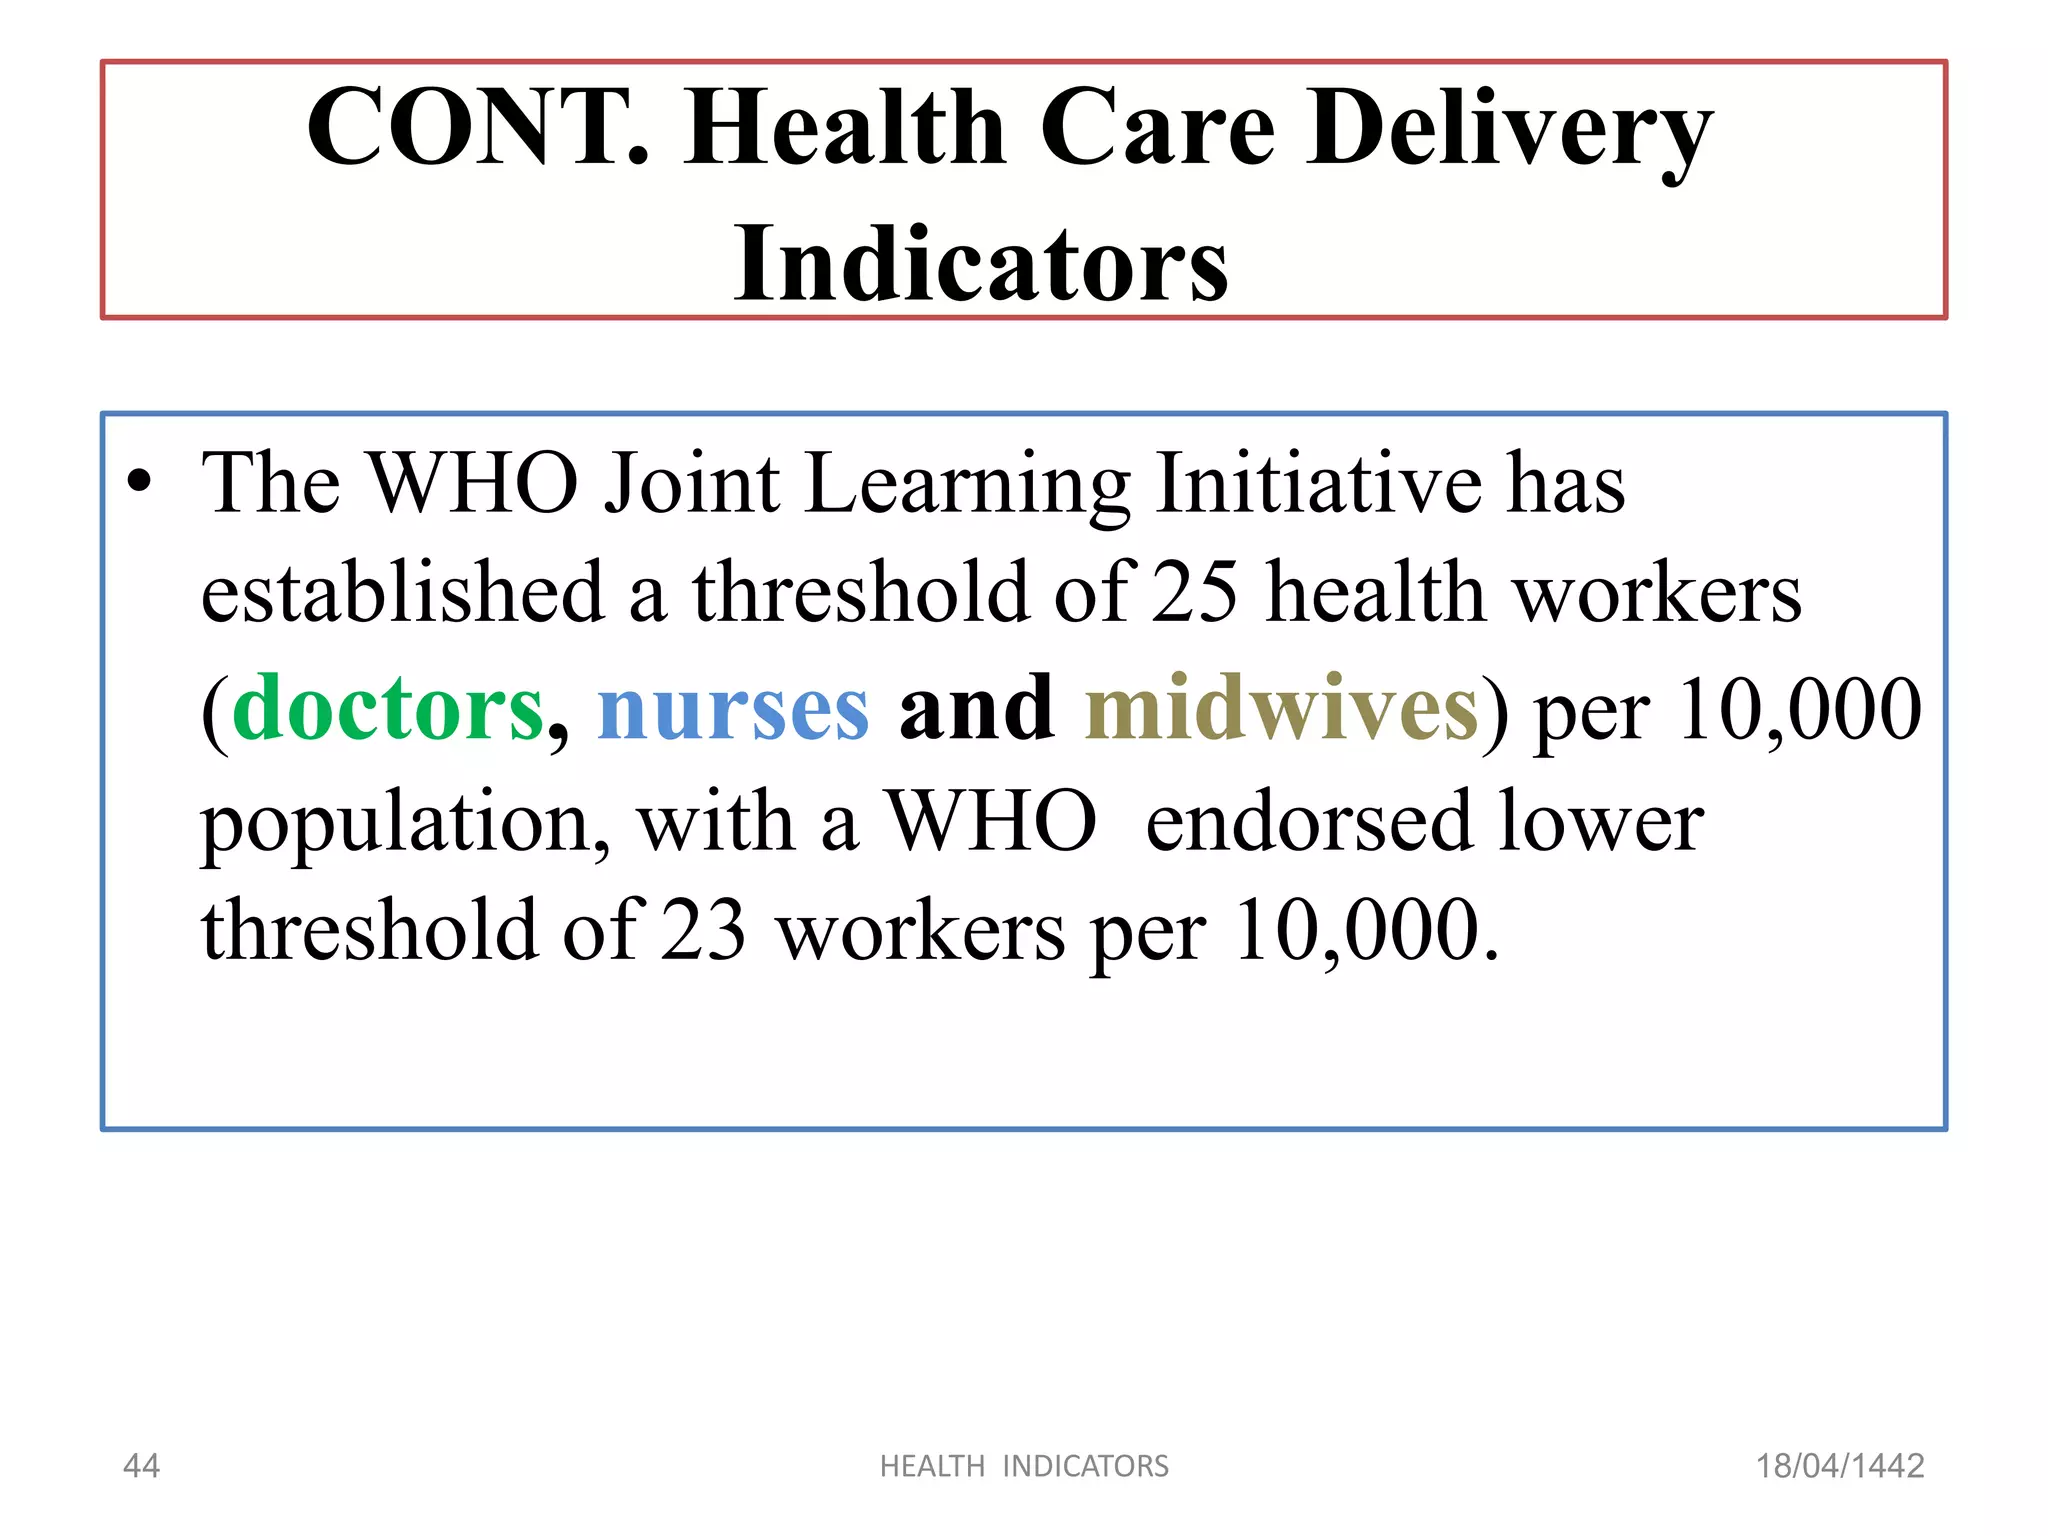
Indicators that assess equity in health resource distribution, including doctor-population and nurse-population ratios.
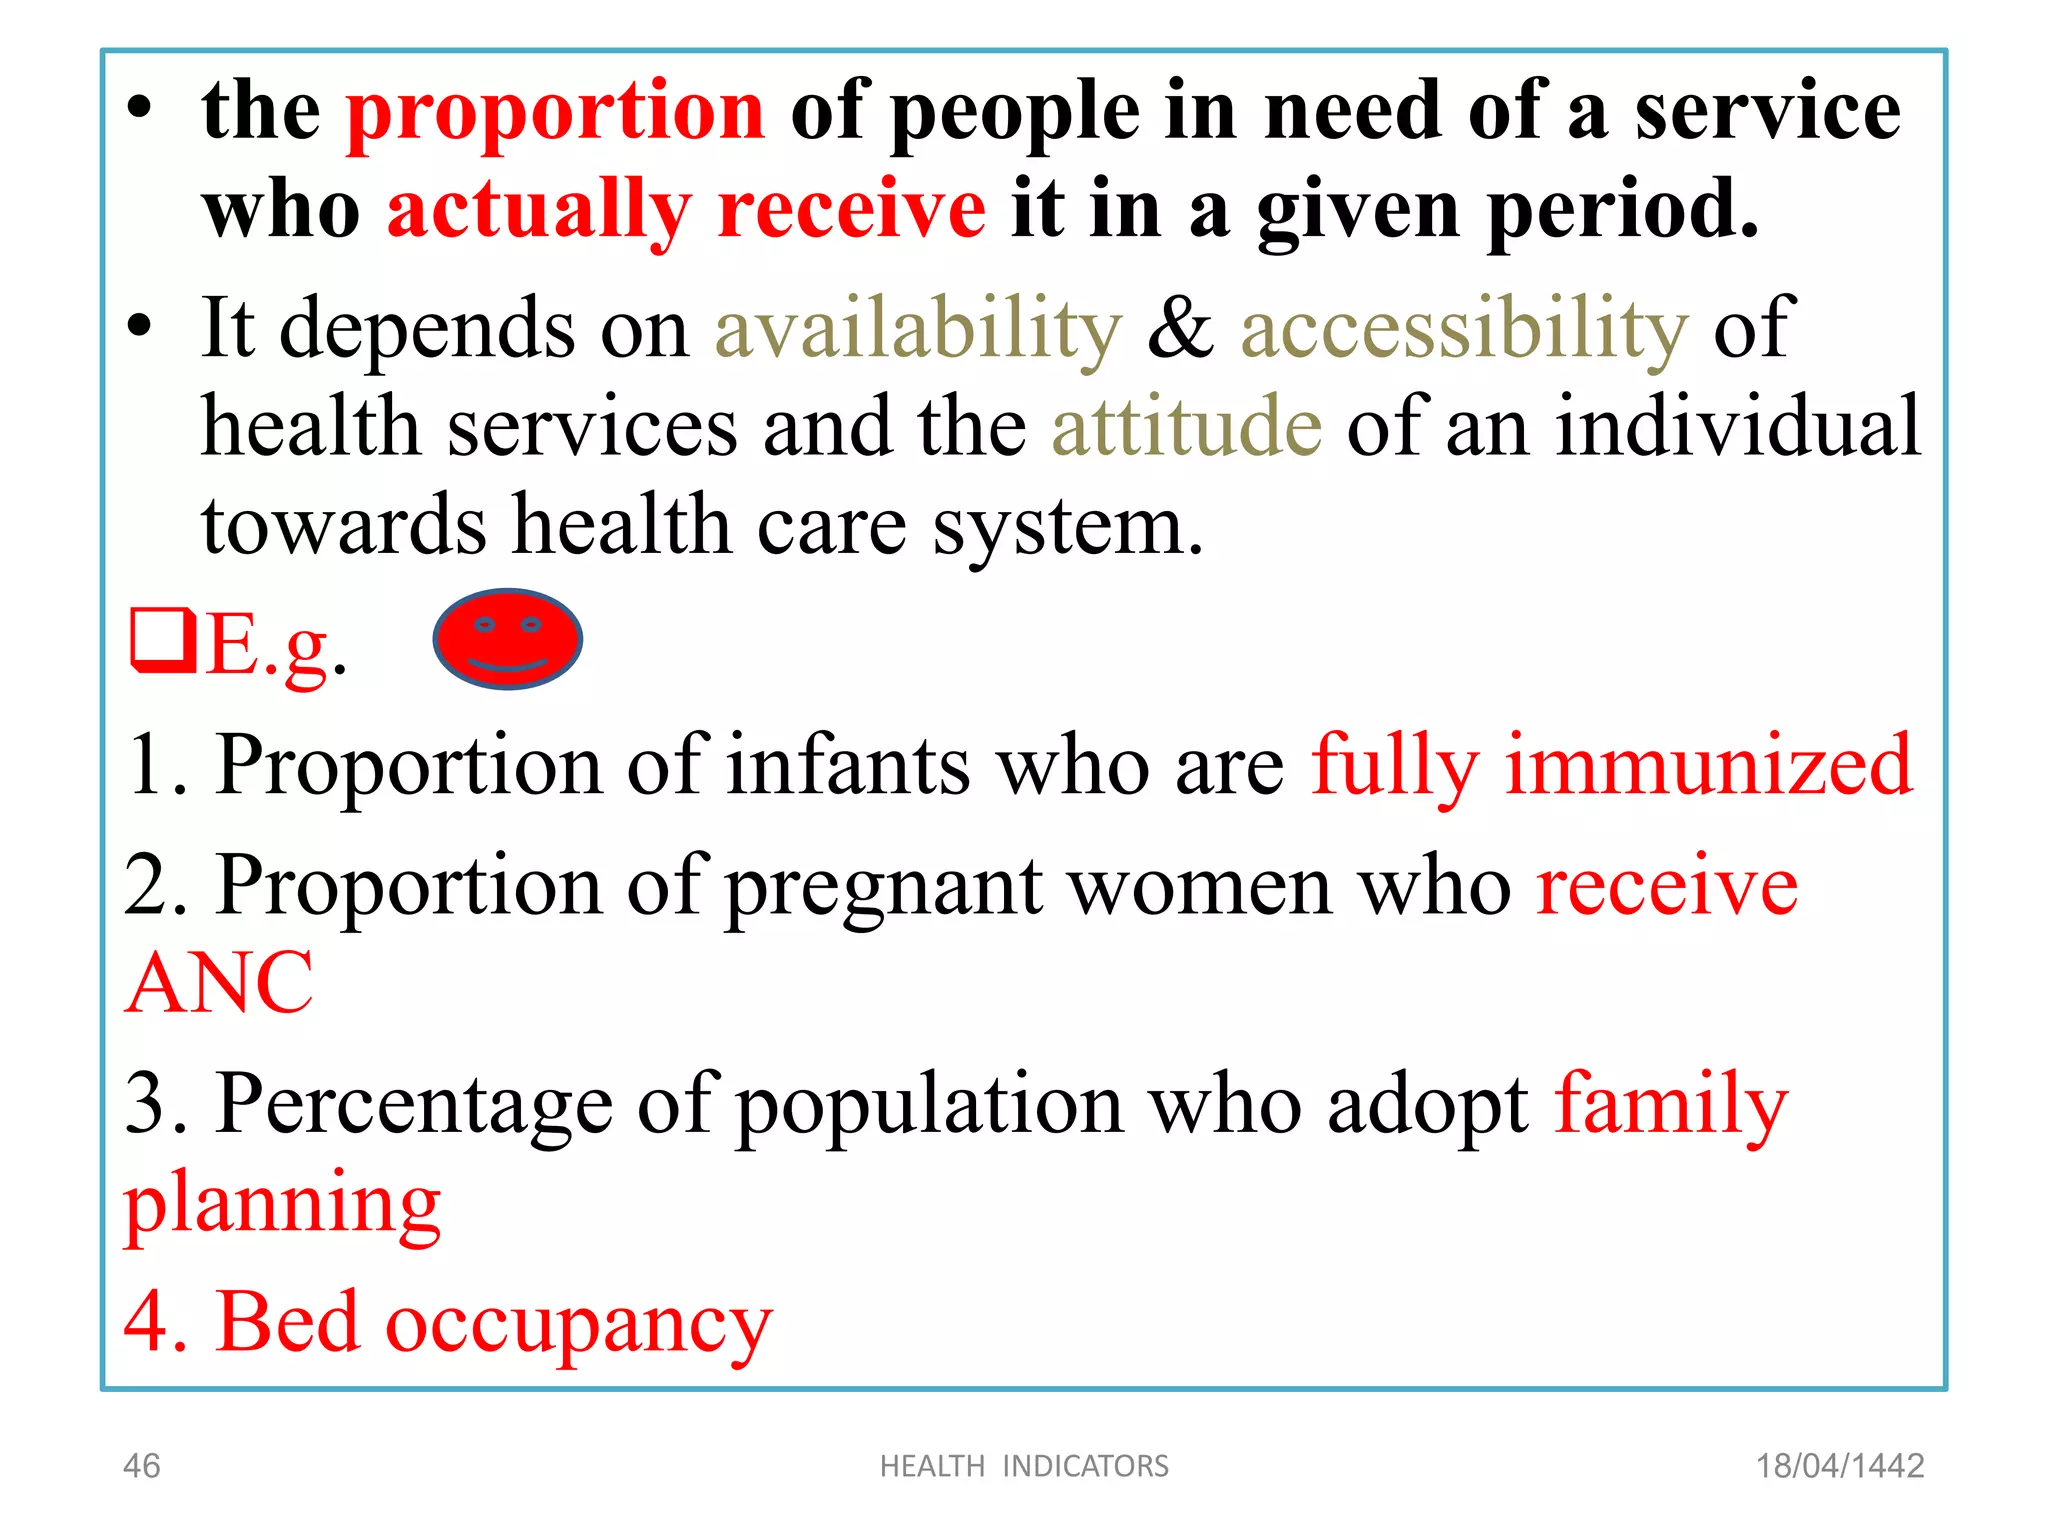
Explains utilization rates related to access and attitudes towards health services.
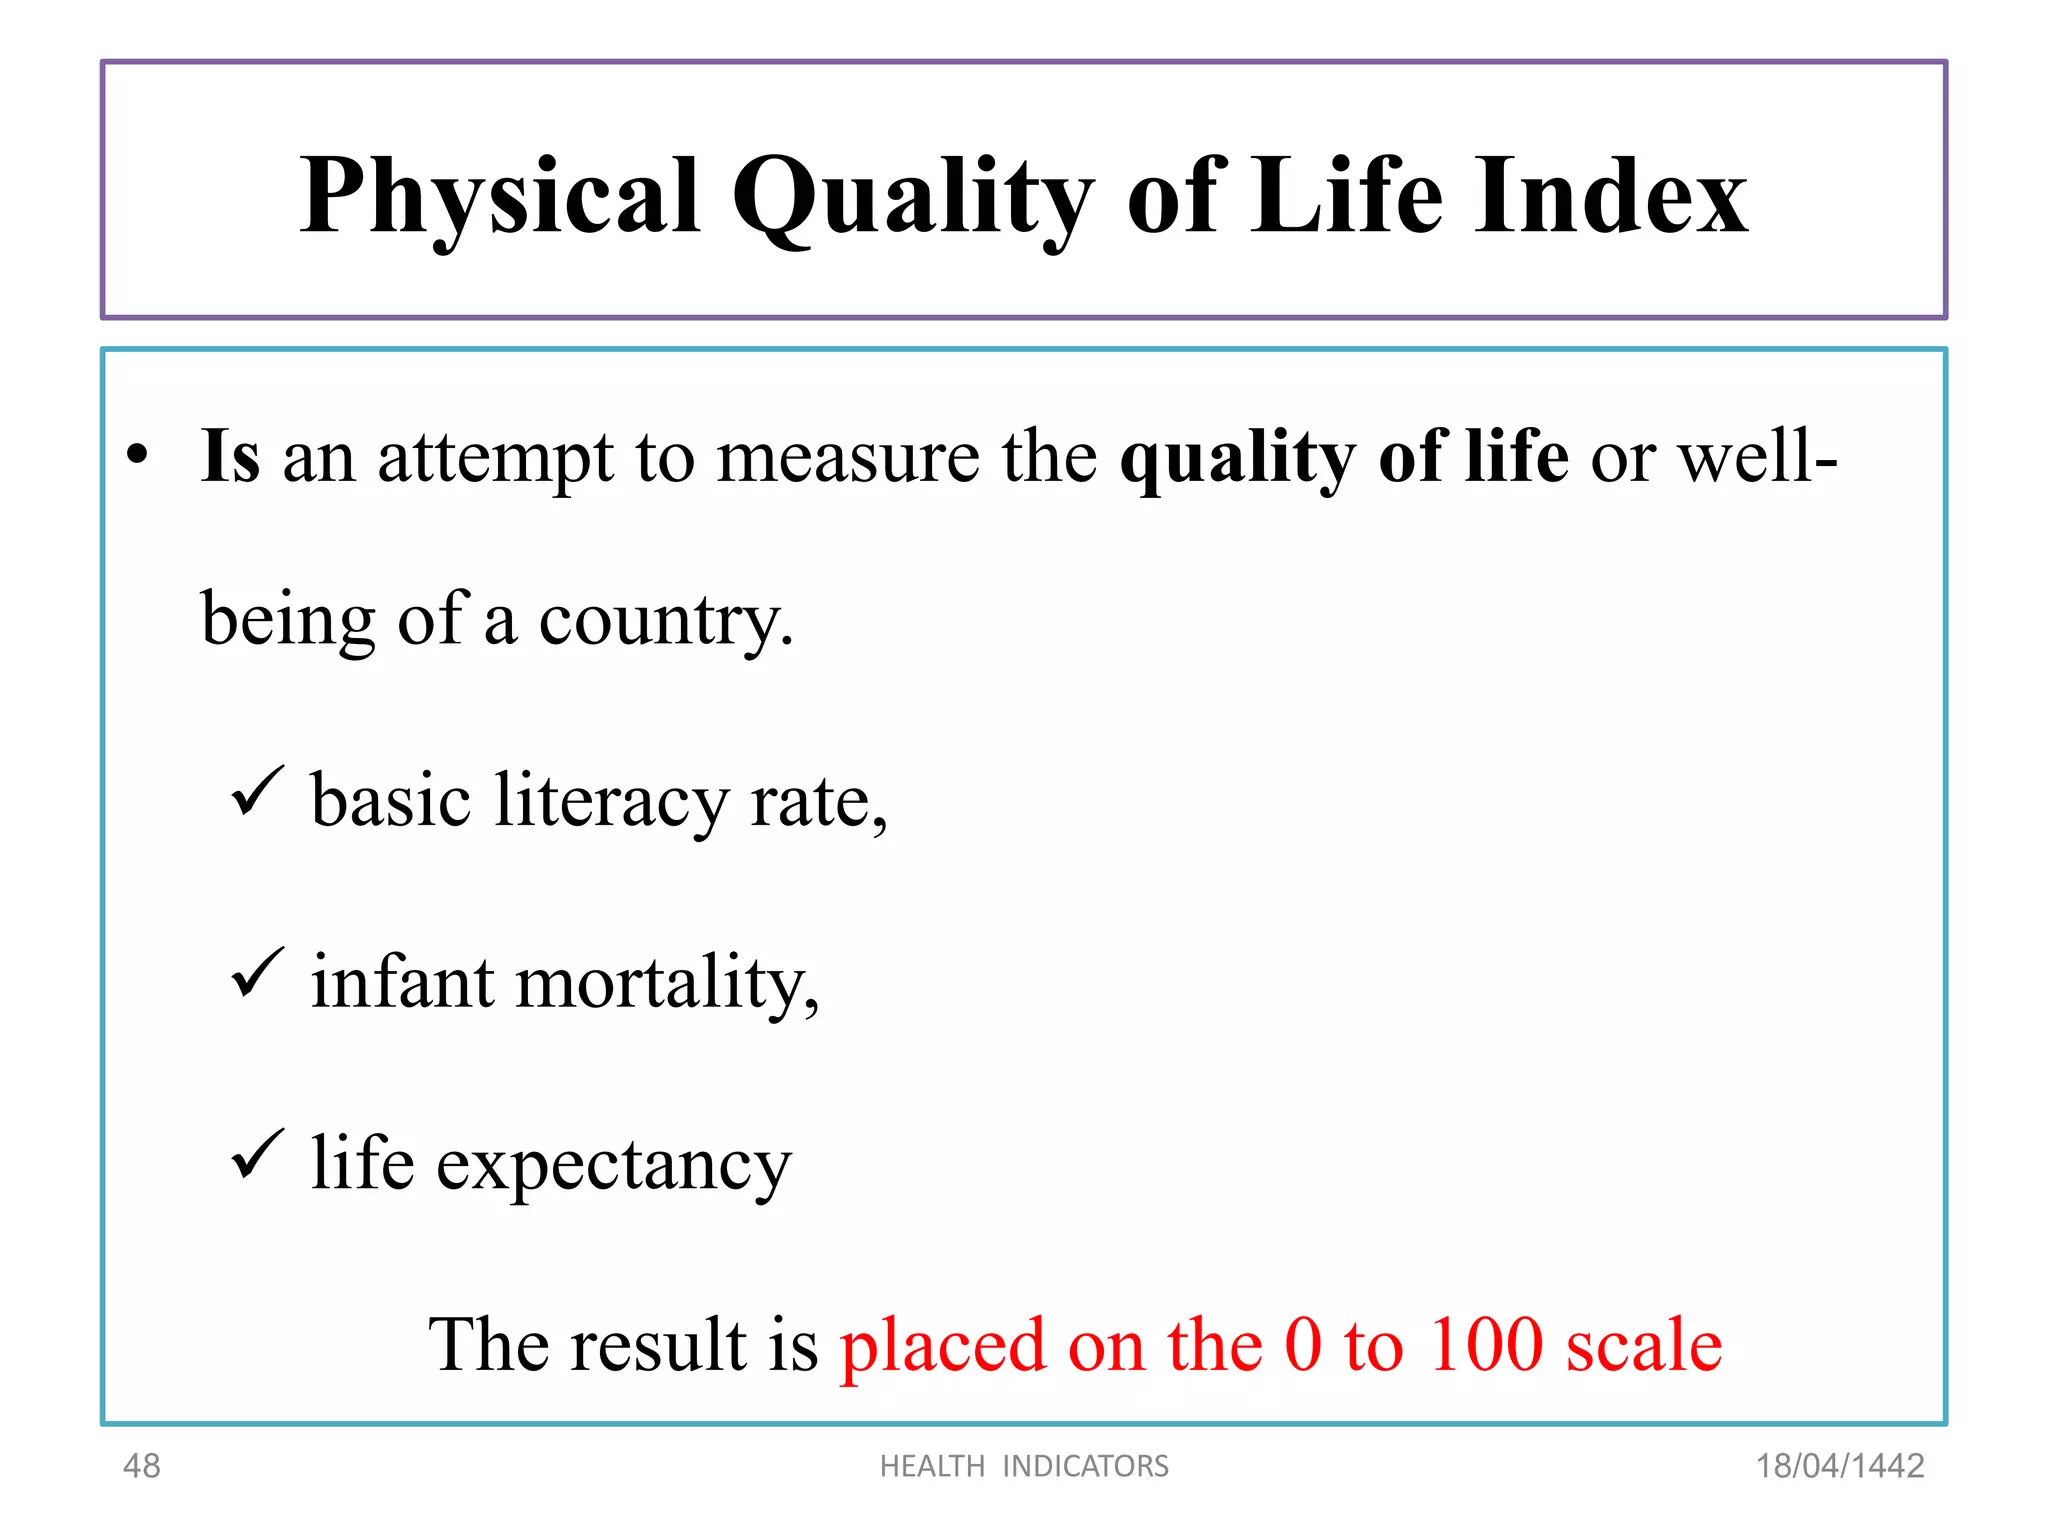
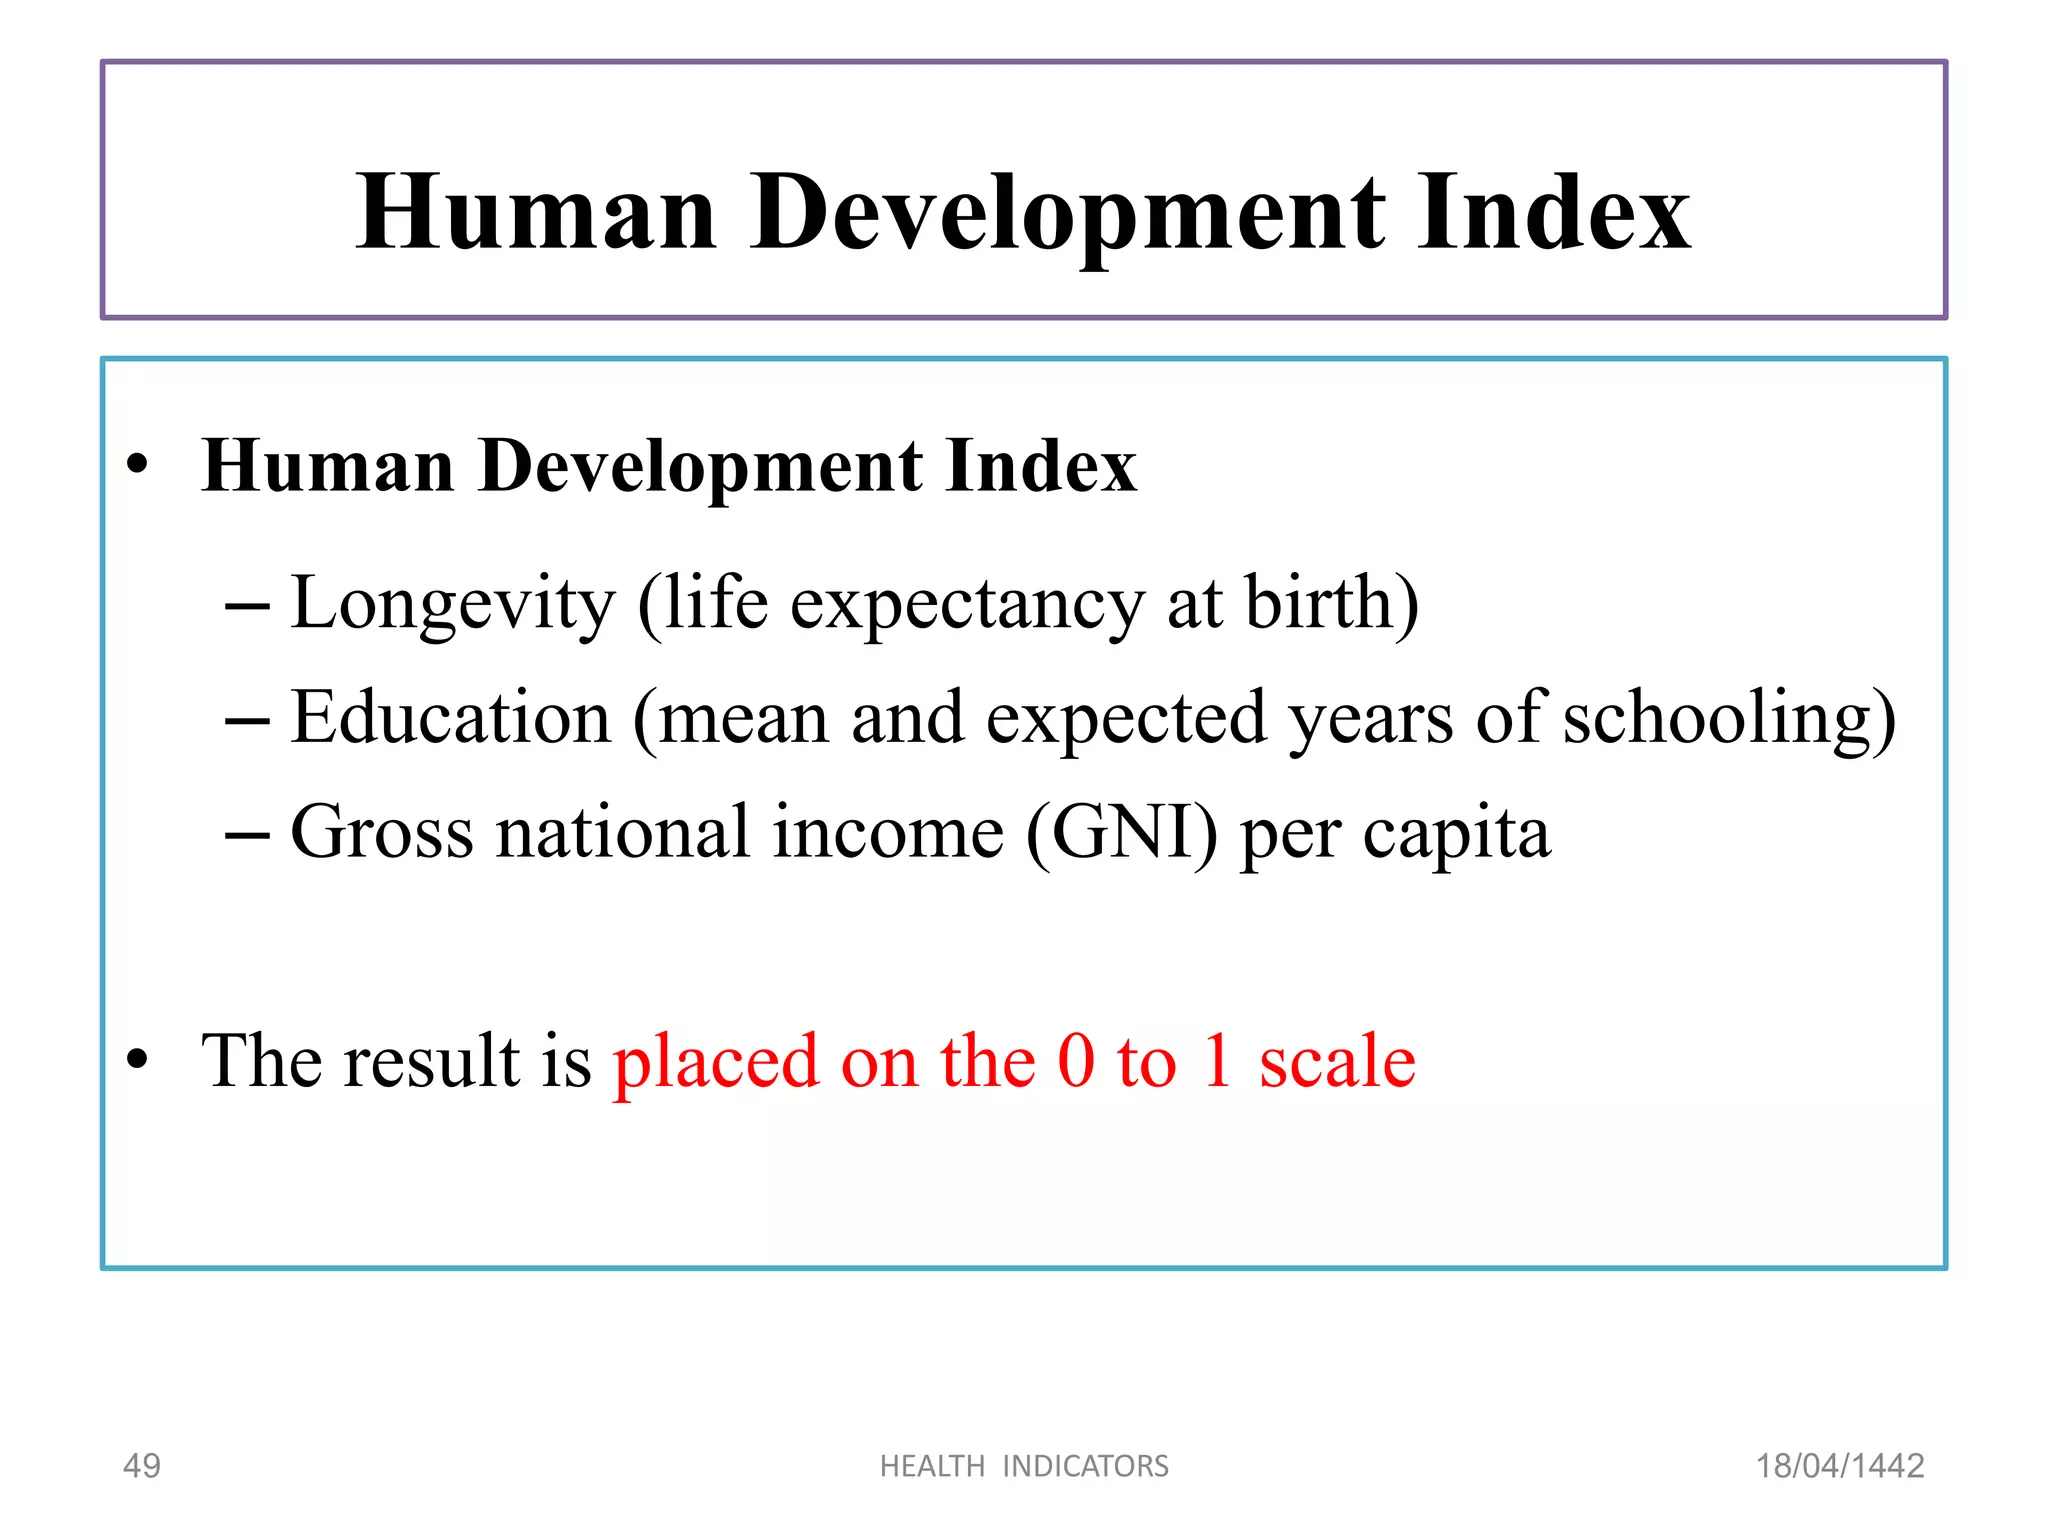
Measures quality of life through indices such as the Physical Quality of Life Index and Human Development Index.
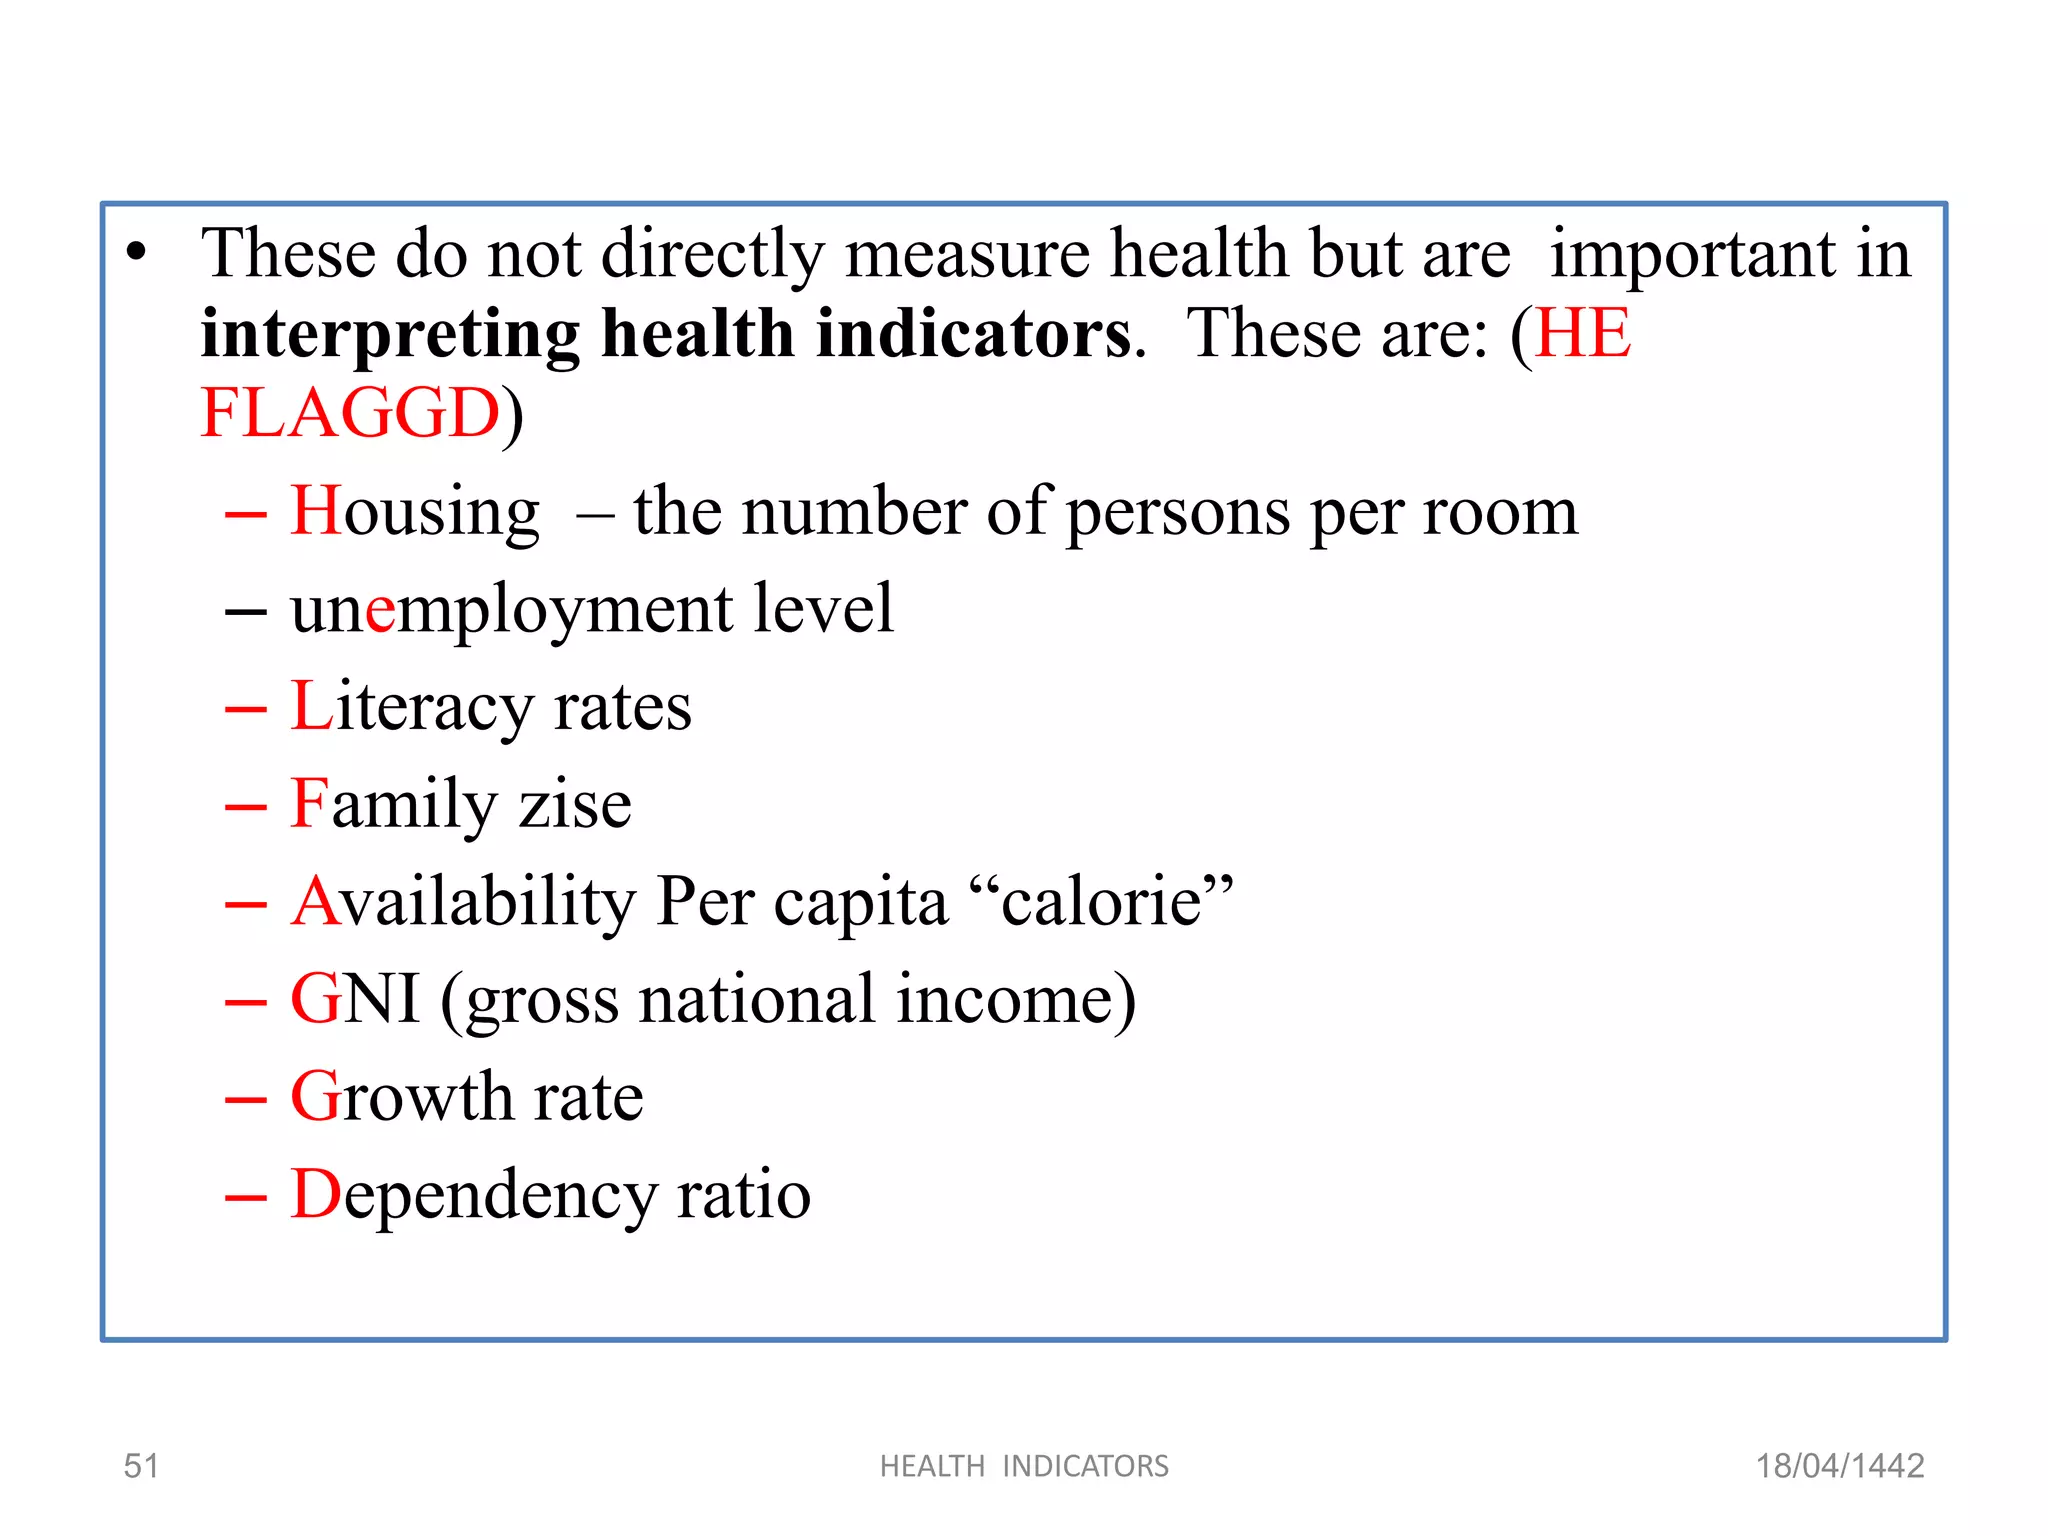
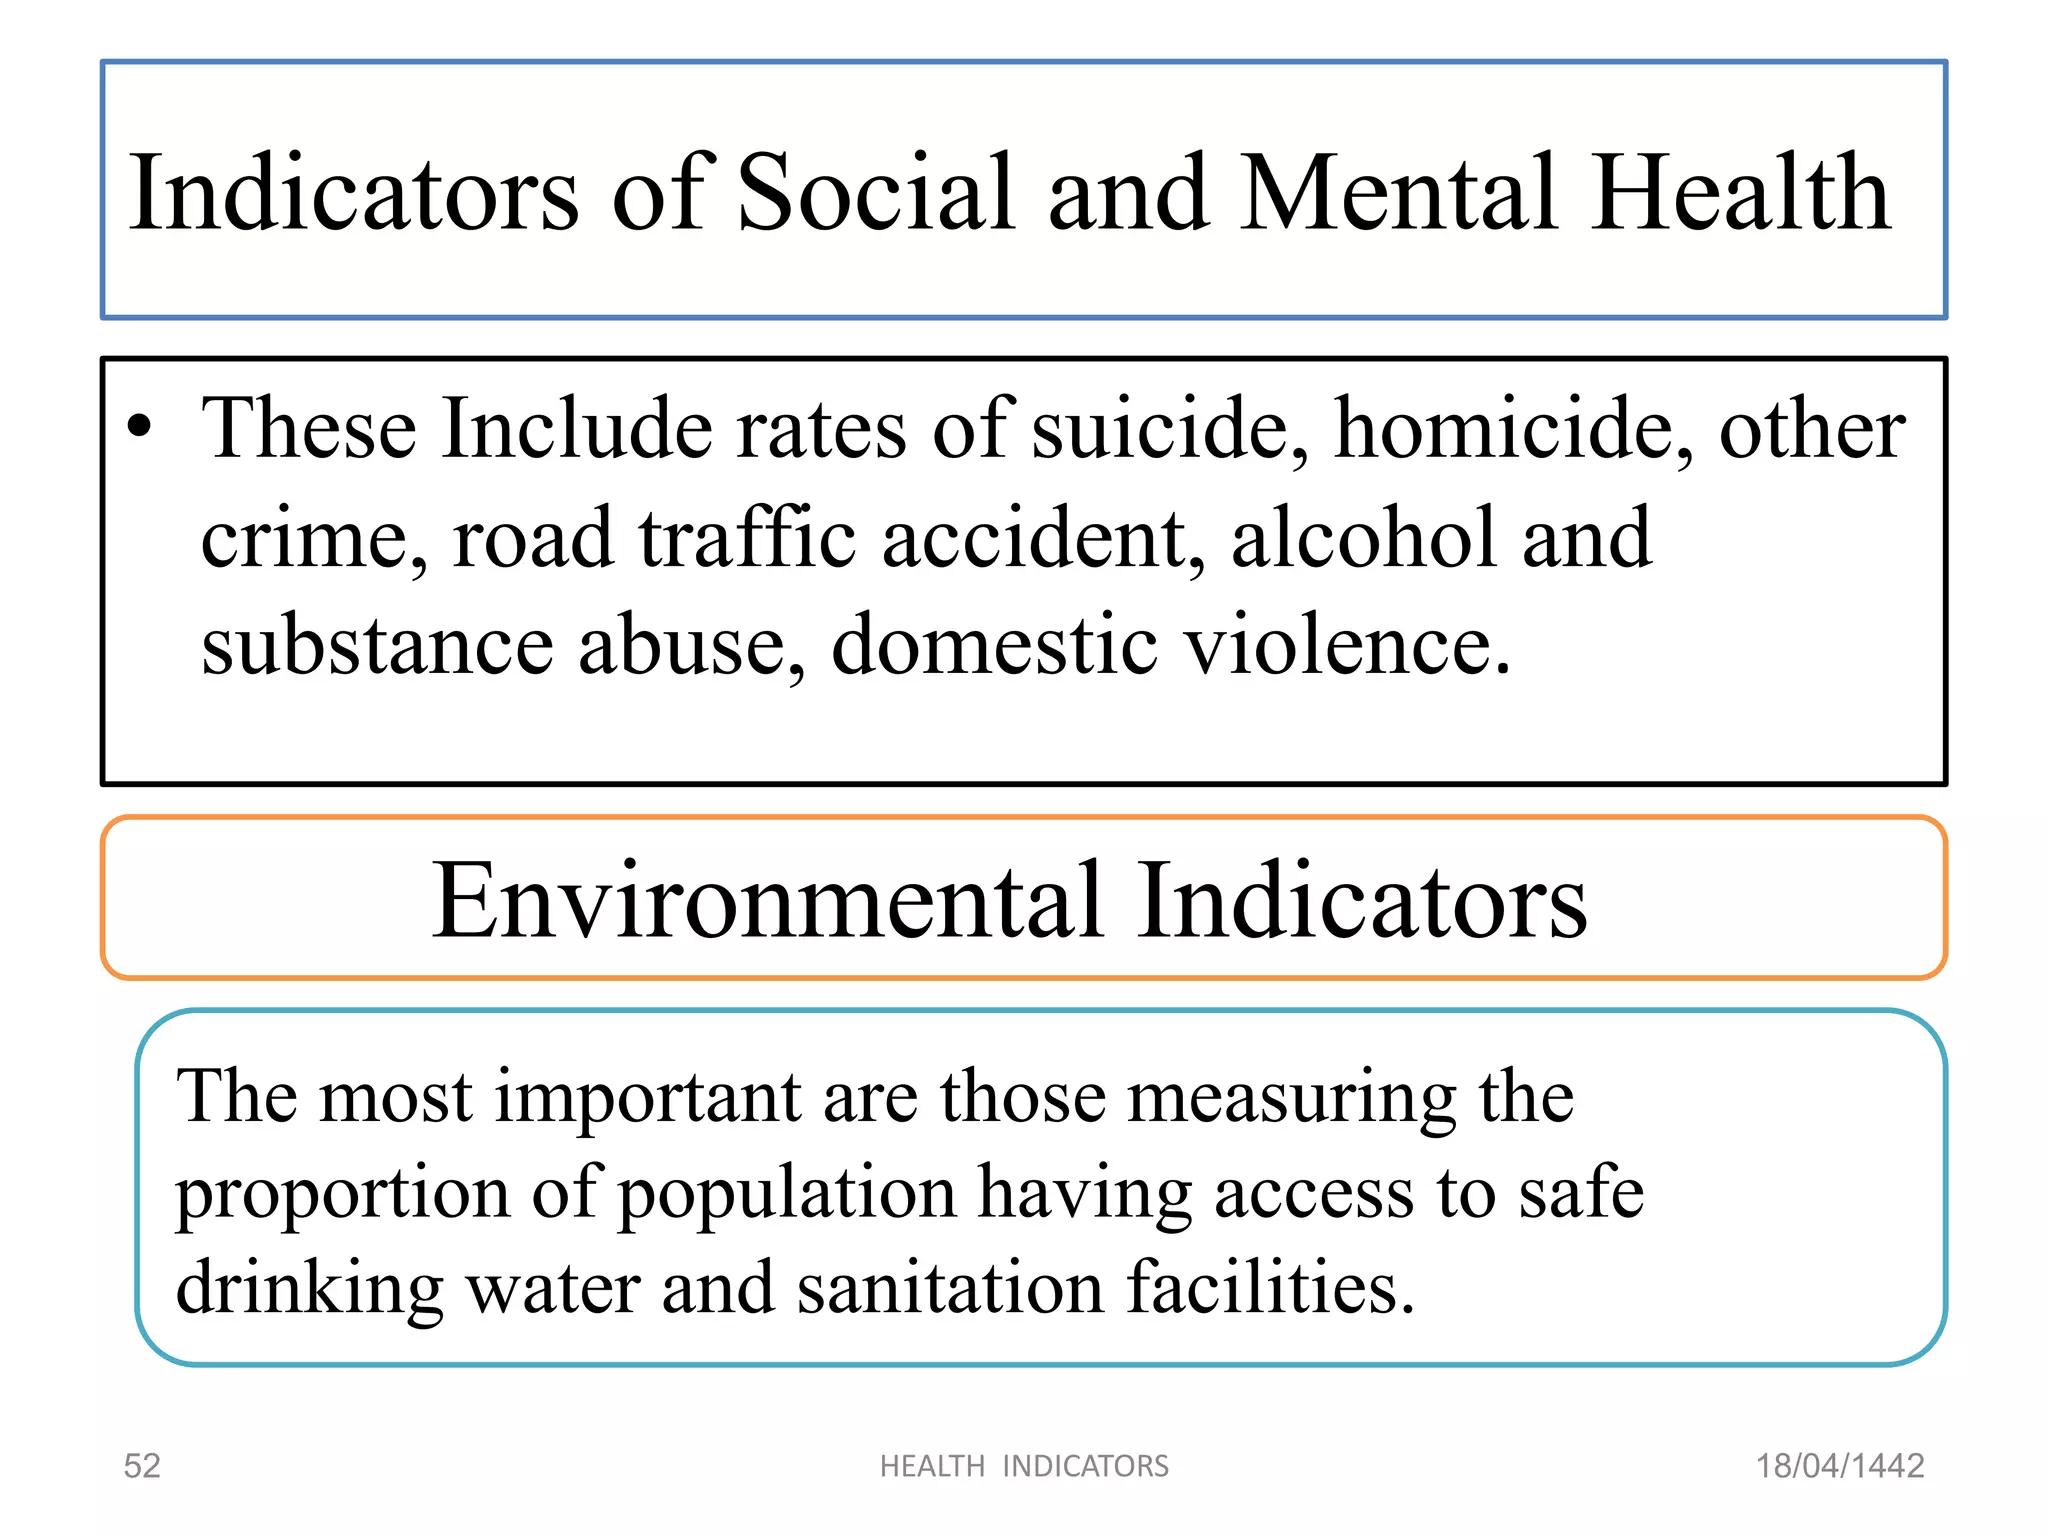
Socioeconomic indicators affecting health and environmental indicators relating to sanitation and safe water.
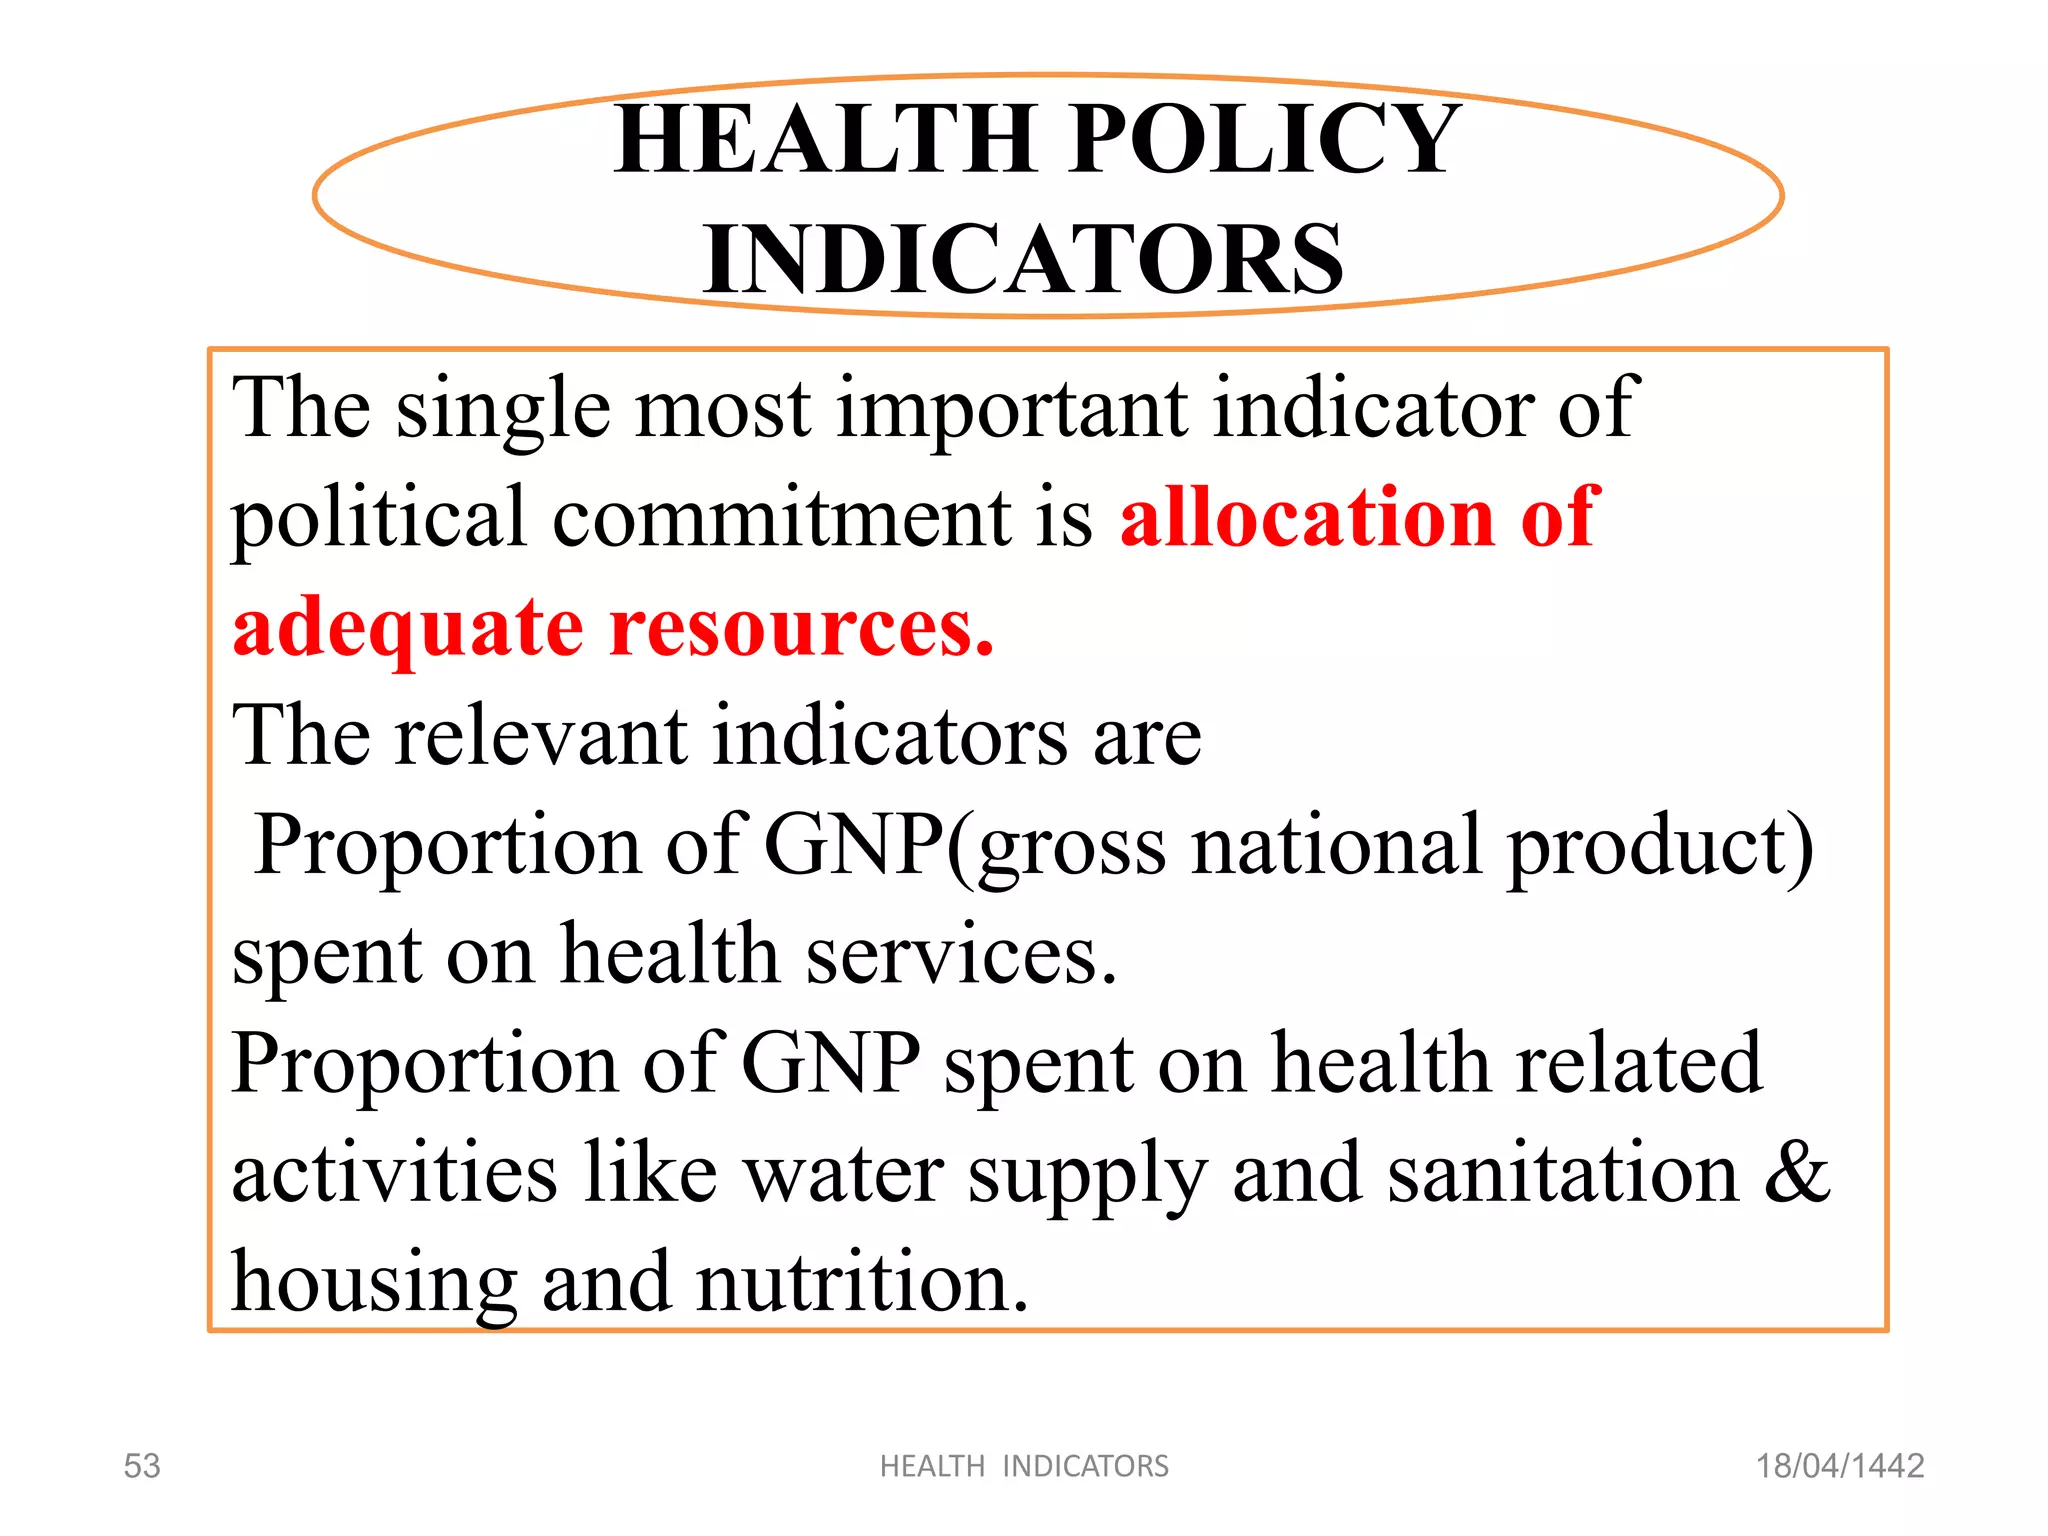
Key indicators of political commitment and resource allocation to health services.
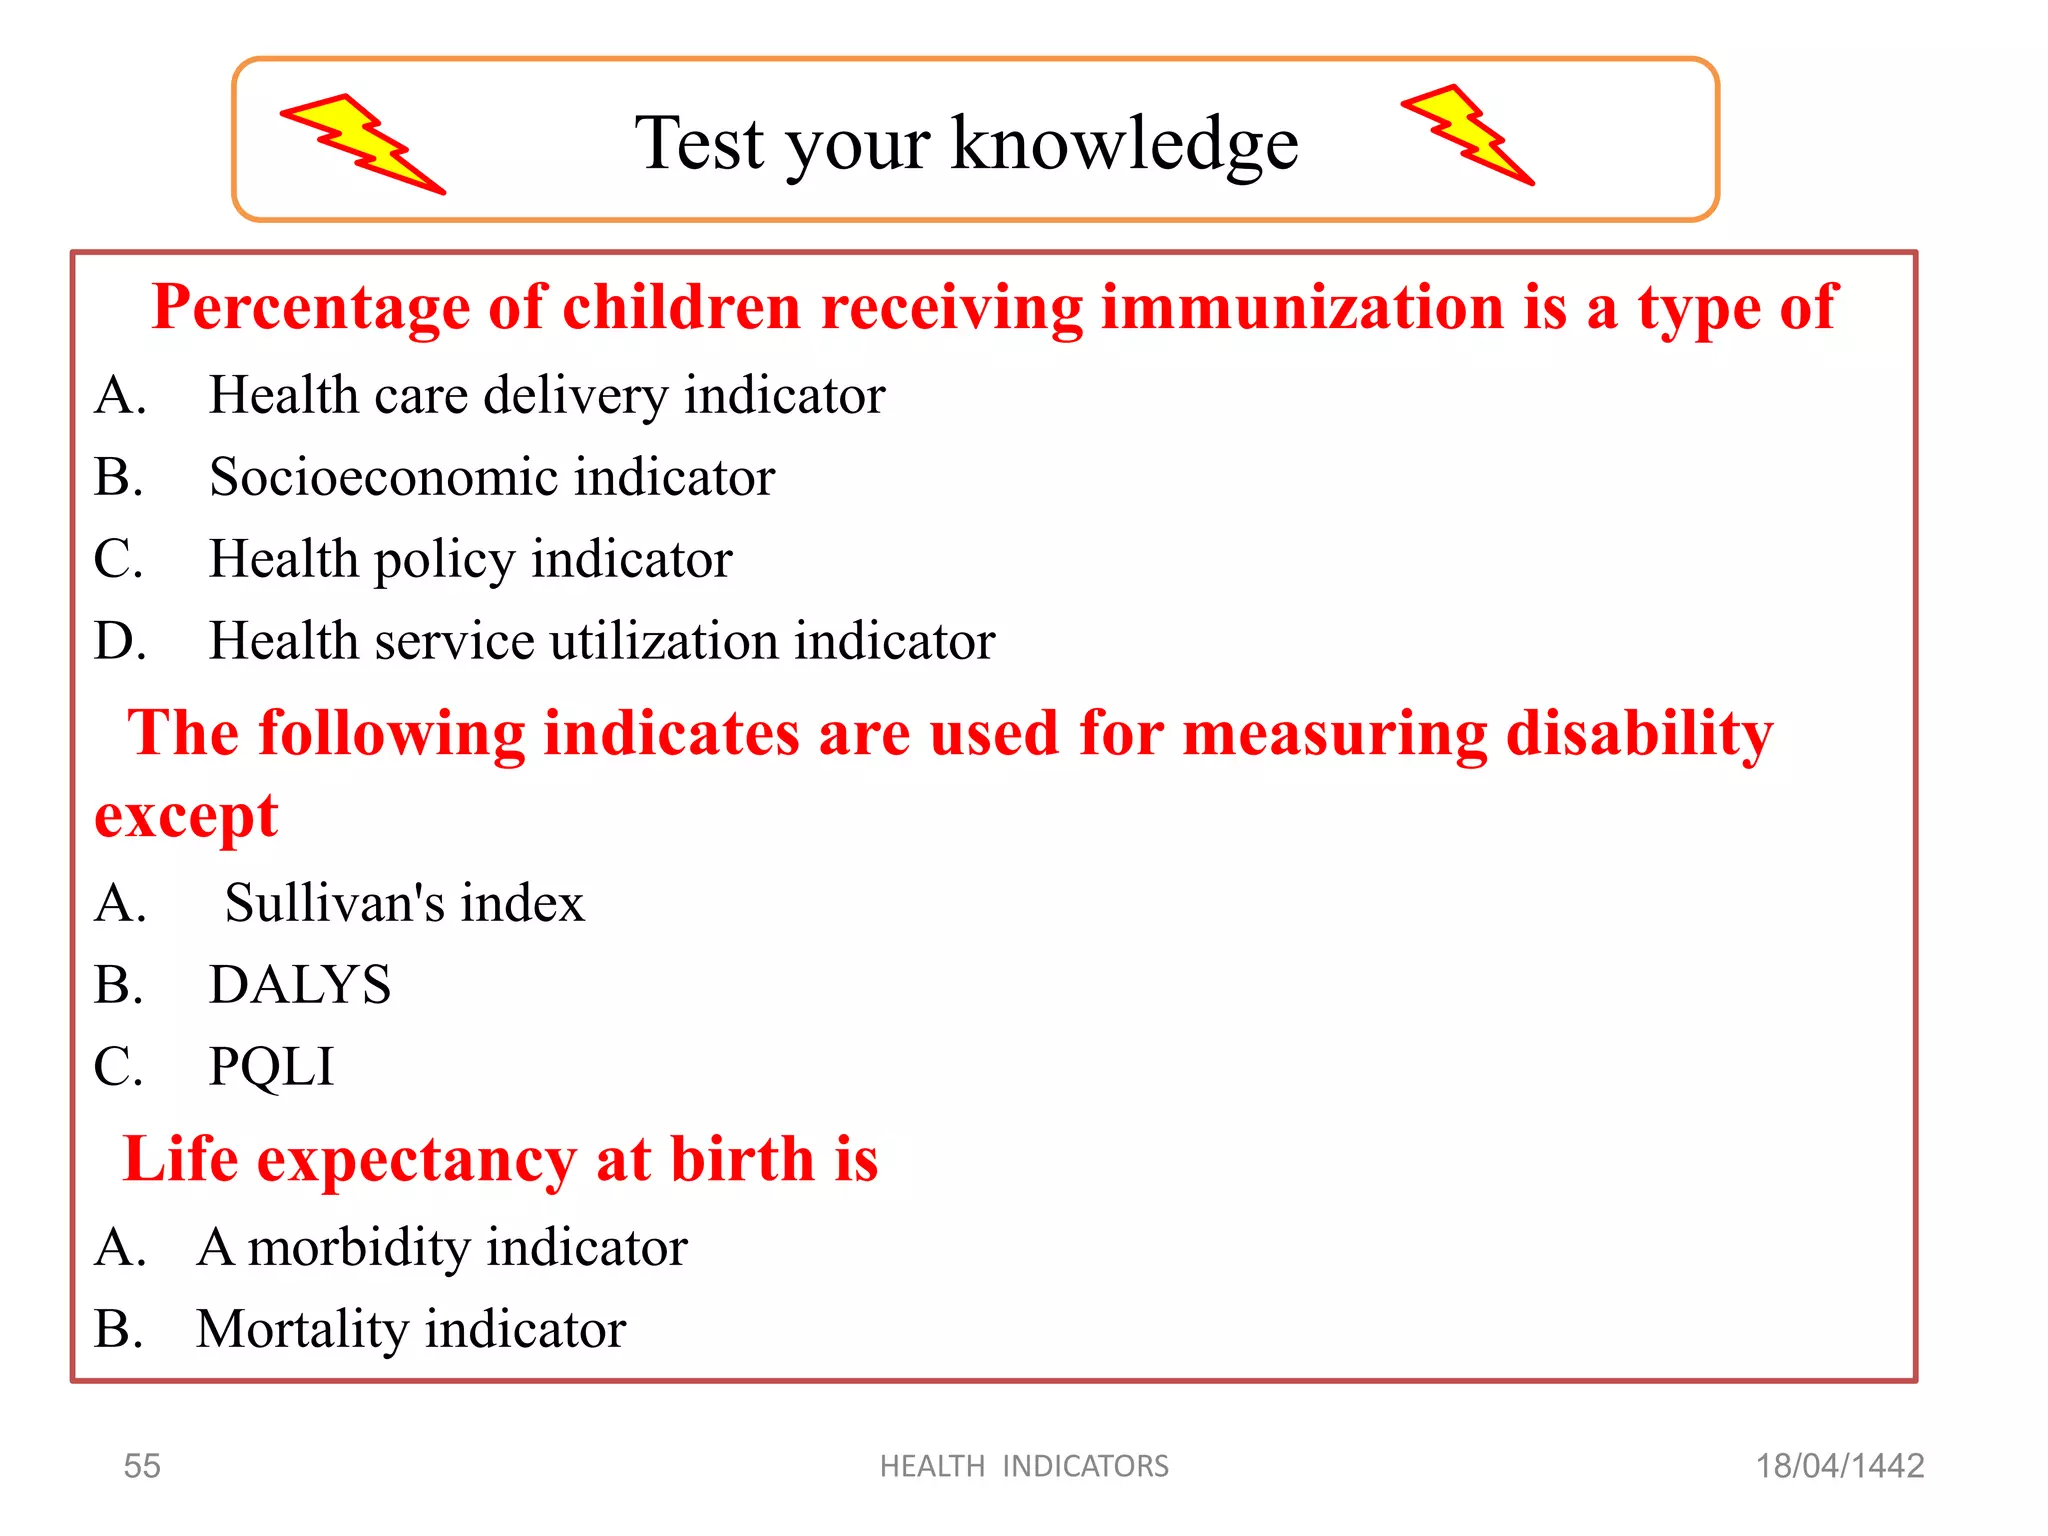
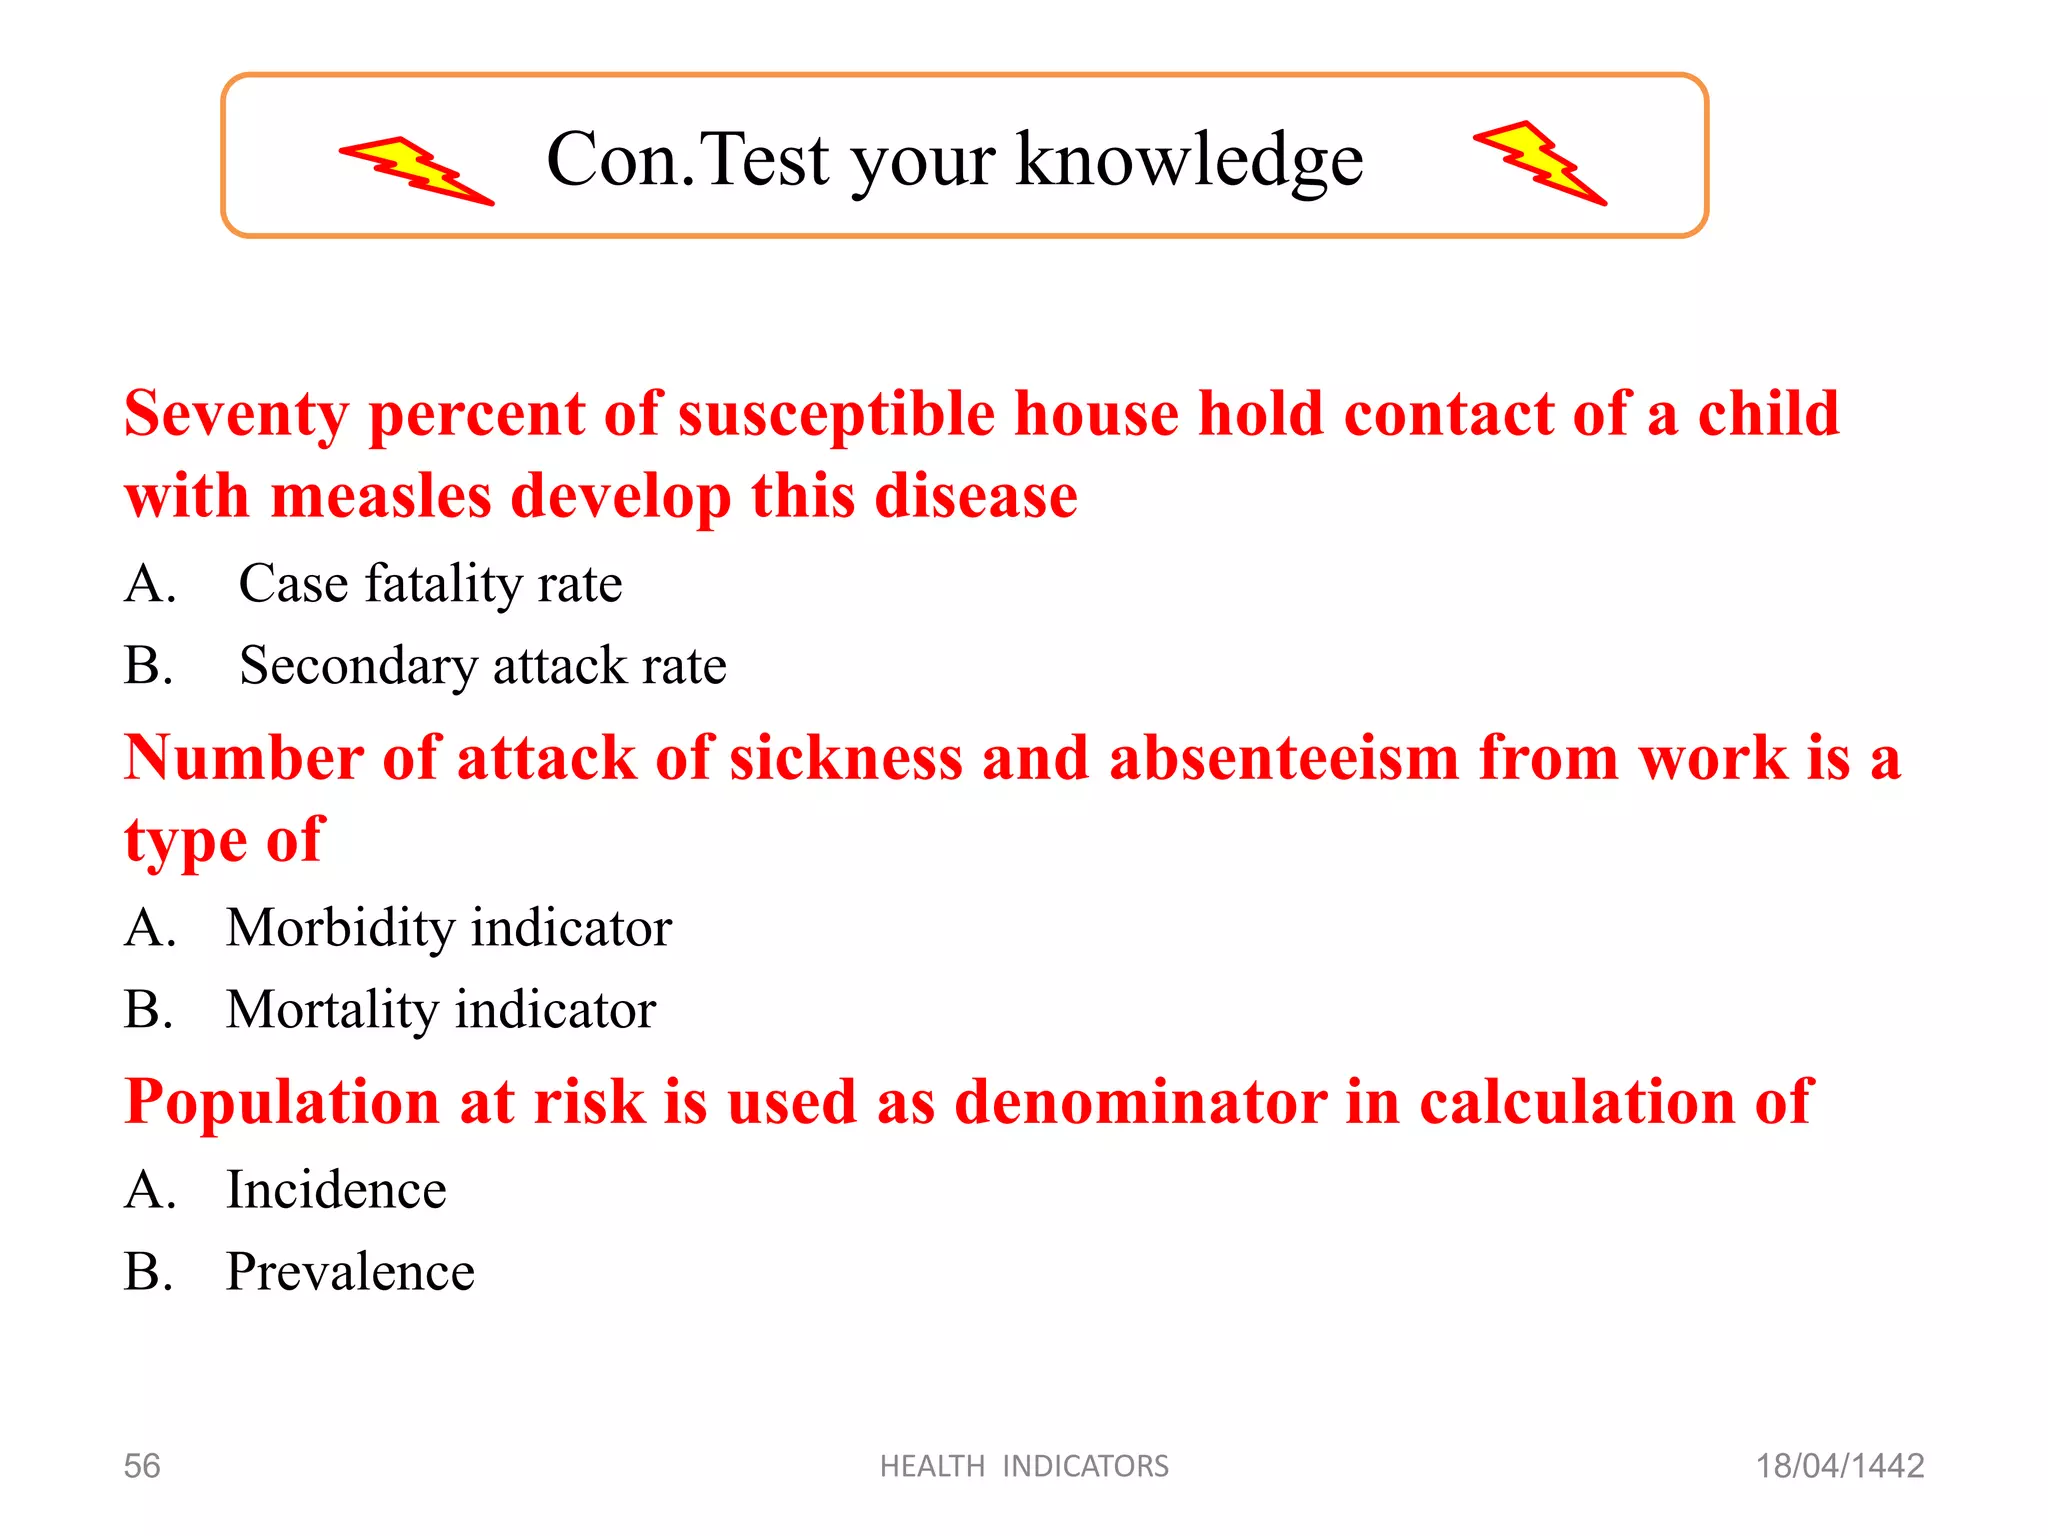
Multiple choice questions interactively testing knowledge on health indicators.
Statistical health indicators specific to Sudan, including mortality rates and life expectancy.
Citations and references for the content covered throughout the presentation.


