Download as PDF, PPTX


![Scene
Light
SDR
Signal
Camera
HLG
Signal
PQ
Signal
Sensor
Relative Linear Scene Light
(Volts)
Lens
Set Exposure (Iris)
Relative
Non-linear Signal
[0,1]
Absolute
Non-linear Signal
[0,1]
A Closer Look at the Camera
SDR OETF
(“Gamma”)
HLG OETF
PQ OETF
Relative
Non-linear Signal
[0,1]
6](https://image.slidesharecdn.com/hdrandwcgprinciplespart2-210615182338/85/HDR-and-WCG-Principles-Part-2-6-320.jpg)

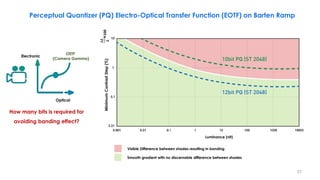
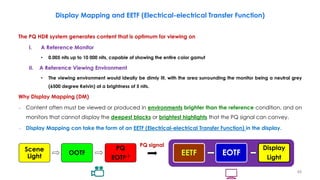
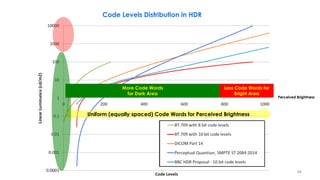
![Perceptual Quantizer (PQ) Electro-Optical Transfer Function (EOTF)
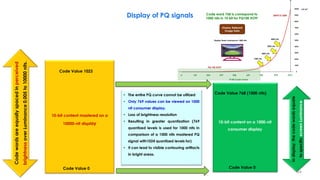
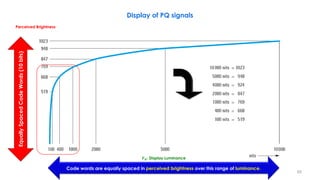
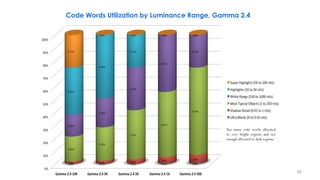
Code words are equally spaced in perceived brightness over this range of luminance.
Equally
Spaced
Code
Words
(10
bits)
Standardized as SMPTE ST-2084 and ITU-R BT.2100 (10 bit)
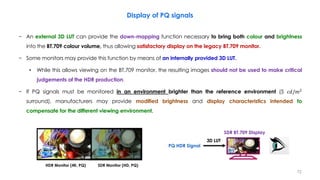
PQ HDR Display
Perceived Brightness
𝑭𝑫: Display Luminance
𝐹𝐷=EOTF[𝐸′
]=10000 Y
𝐸′
𝑚1 = 0.1593017578125
𝑚2= 78.84375
𝑐1= 0.8359375
𝑐2= 18.8515625
𝑐3= 18.6875
𝑌 =
max ሖ
𝐸
1
𝑚2 − 𝑐1 , 0
𝑐2 − 𝑐3
ሖ
𝐸
1
𝑚2
1
𝑚1
𝑬′ (video level) denotes a non-linear
colour value {𝑹′, 𝑮′, 𝑩′} or { 𝑳′, 𝑴′, 𝑺′} in
PQ space in the range [0:1]
𝐹𝐷
20](https://image.slidesharecdn.com/hdrandwcgprinciplespart2-210615182338/85/HDR-and-WCG-Principles-Part-2-20-320.jpg)

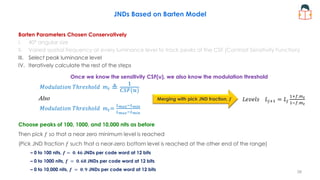
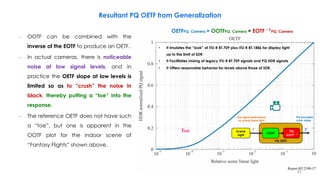
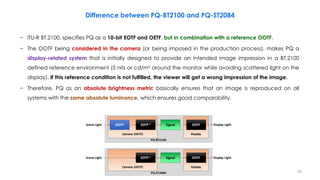
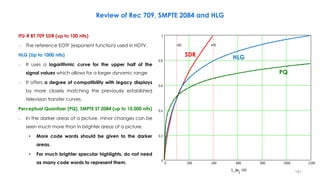
![Generalized OOTF from ITU-R BT.1886 in Combination with ITU-R BT.709
– We want the image from an SDR source and that from an HDR source to match everywhere the HDR
image brightness overlaps the range of the SDR source (i.e. for less than 100 nits).
– In order to maximize compatibility with existing SDR signals, it is desired an OOTF consistent with the
effective OOTF of existing practice which is:
– This maximizes compatibility for mixed source applications wherein some sources are HDR and some are
SDR.
SDR Signal
PQ HDR Signal
with less than 100 nits
luminance
• It maximize compatibility for PQ
HDR content less that 100 nits.
• It emulates the “look” of ITU-R
BT.709 plus ITU-R BT.1886 for
display light up to the limit of SDR
SDR Display
PQ HDR Display
𝑂𝑂𝑇𝐹𝑆𝐷𝑅 = 𝐸𝑂𝑇𝐹1886[𝑂𝐸𝑇𝐹709]
PQ HDR Signal
(up to 10000 nits)
40](https://image.slidesharecdn.com/hdrandwcgprinciplespart2-210615182338/85/HDR-and-WCG-Principles-Part-2-40-320.jpg)
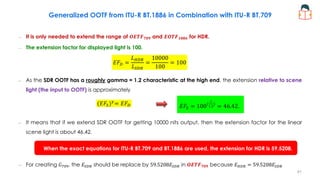
![Generalized OOTF from ITU-R BT.1886 in Combination with ITU-R BT.709
– To expand the range of 𝑂𝐸𝑇𝐹709 to 𝐺709 for HDR the equation is therefore:
– Note: HDR E is normalized to range of 0 to 1
– Consequently, the range of 𝑬′ is [𝟎, 𝟔. 𝟖𝟏𝟑] for HDR while it remains [0,1] for SDR.
𝑬 = 𝟏 ⇒ 𝐸′
= 6.813
𝑬 =
𝟏
𝟓𝟗. 𝟓𝟐𝟎𝟖
⇒ 𝐸′
= 1
𝑬 = 𝟎 ⇒ 𝐸′
= 0
𝐸′ = 𝐺709 𝐸 =
1.099(59.5208𝐸)0.45 − 0.099
0.018
59.5208
< 𝐸 < 1
4.5(59.5208𝐸) 0 < 𝐸 <
0.018
59.5208
𝐸′
= 𝐺709 𝐸 = ቊ1.099(59.5208𝐸)0.45 − 0.099 0.0003024 < 𝐸 < 1
267.84𝐸 0 < 𝐸 < 0.0003024
𝑉 = 𝐺709 𝐿 = ൝
1.099(𝐿)0.45 − 0.099 0.018 < 𝐿 < 1
4.5(𝐿) 0 < 𝐿 < 0.018
𝐿 : luminance of the image 0 <𝐿< 1
𝑉 : corresponding electrical signal
SDR OETF, 𝑶𝑬𝑻𝑭𝟕𝟎𝟗
Extended SDR OETF, 𝑮𝟕𝟎𝟗
HDR
SDR
42](https://image.slidesharecdn.com/hdrandwcgprinciplespart2-210615182338/85/HDR-and-WCG-Principles-Part-2-42-320.jpg)
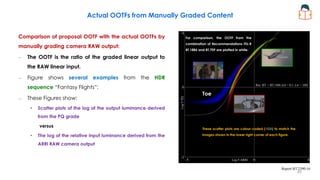
![Generalized OOTF from ITU-R BT.1886 in Combination with ITU-R BT.709
– To expand the range of 𝐸𝑂𝑇𝐹1886 to 𝐺1886 for HDR no change to the equation is necessary, the argument is
simply allowed to extend to 6.813 and hence the range increases from 100 to 10 000:
– These extensions satisfy the boundary conditions:
𝑬 = 𝟏 ⇒ 𝐸′
= 6.813 ⇒ A displayed luminance of 10 000 cd/m²
𝑬 =
𝟏
𝟓𝟗.𝟓𝟐𝟎𝟖
⇒ 𝐸′
= 1 ⇒ A displayed luminance of 100 cd/m²
FD = G1886[E'] = 100 E′ 2.4
FD = OOTF[E] = G1886 [G709[E]] =G1886 [E′] = 100𝐸′2.4
𝐸′
= 𝐺709 𝐸 = ቊ1.099(59.5208𝐸)0.45
− 0.099 0.0003024 < 𝐸 < 1
267.84𝐸 0 < 𝐸 < 0.0003024
𝑳 = 𝒂(𝐦𝐚𝐱 𝑽 + 𝒃 , 𝟎 )𝜸
𝑬𝑶𝑻𝑭𝟏𝟖𝟖𝟔 𝑮𝟏𝟖𝟖𝟔
The extension factor for
displayed light is 100.
𝑳 = (𝑽)𝜸
43](https://image.slidesharecdn.com/hdrandwcgprinciplespart2-210615182338/85/HDR-and-WCG-Principles-Part-2-43-320.jpg)
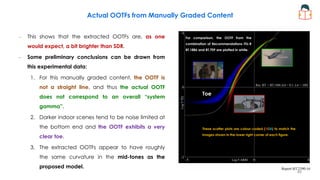
![Generalized OOTF from ITU-R BT.1886 in Combination with ITU-R BT.709
– The x-axis, is the same as 𝑬 for SDR while for HDR it is 𝟓𝟗. 𝟓𝟐𝟎𝟖𝑬 since the domain of 𝑬 is [0,1]:
OOTF[E] = G1886 [G709[E]]
• OETF709 is expanded to G709 for HDR
• EOTF1886 is expanded to G1886 for HDR
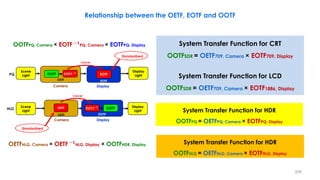
𝑶𝑶𝑻𝑭𝑺𝑫𝑹 = 𝑬𝑶𝑻𝑭𝟏𝟖𝟖𝟔[𝑶𝑬𝑻𝑭𝟕𝟎𝟗]
𝑶𝑶𝑻𝑭𝑯𝑫𝑹 = 𝑶𝑬𝑻𝑭𝑷𝑸 × 𝑬𝑶𝑻𝑭𝑷𝑸
FD
E
𝑬 =
𝟏
𝟓𝟗. 𝟓𝟐𝟎𝟖
°
44](https://image.slidesharecdn.com/hdrandwcgprinciplespart2-210615182338/85/HDR-and-WCG-Principles-Part-2-44-320.jpg)
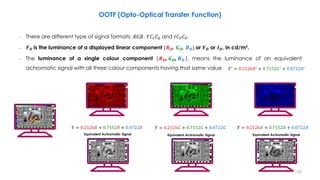
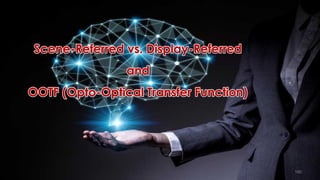
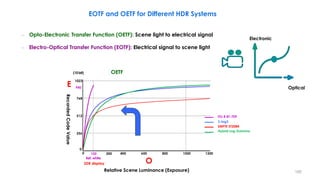
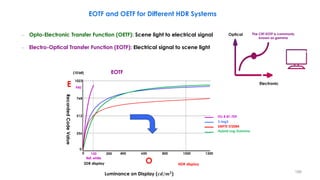
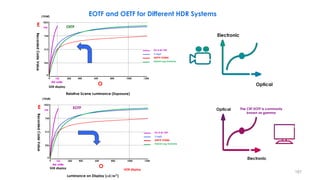
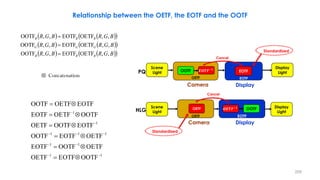
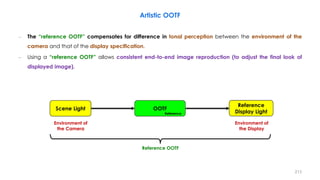
![Reference OOTF = OETF (PQ) + EOTF (PQ)
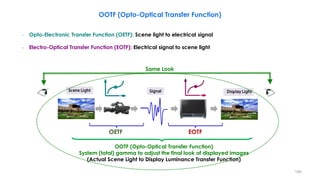
– Opto-Electronic Transfer Function (OETF): Scene light to electrical signal
– Electro-Optical Transfer Function (EOTF): Electrical signal to scene light
OOTF (Opto-Optical Transfer Function)
PQ OETF PQ EOTF
𝑬: [𝟎, 𝟏] 𝑬′
: [𝟎, 𝟏]
𝑭𝑫
Linear Scene-light
Signals 𝑹𝒔, 𝑮𝒔, 𝑩𝒔
Non-linear
Signals 𝑹𝒔, 𝑮𝒔, 𝑩𝒔
Linear Display-light
Signals 𝑹𝑫, 𝑮𝑫, 𝑩𝑫
𝑭𝑺
51](https://image.slidesharecdn.com/hdrandwcgprinciplespart2-210615182338/85/HDR-and-WCG-Principles-Part-2-51-320.jpg)
![– Opto-Electronic Transfer Function (OETF): Scene light to electrical signal
– Electro-Optical Transfer Function (EOTF): Electrical signal to scene light
OOTF (Opto-Optical Transfer Function)
PQ OETF PQ EOTF
𝑬: [𝟎, 𝟏] 𝑬′
: [𝟎, 𝟏]
Linear Scene-light
Signals 𝑹𝒔, 𝑮𝒔, 𝑩𝒔
Non-linear
Signals 𝑹𝒔, 𝑮𝒔, 𝑩𝒔
Linear Display-light
Signals 𝑹𝑫, 𝑮𝑫, 𝑩𝑫
Non linear color value,
encoded in PQ space in
the range [0,1].
The signal determined by scene
linear light, scaled by camera
exposure in the range [0:1].
𝑭𝑫 :The luminance of a displayed linear
component {𝑹𝑫, 𝑮𝑫, 𝑩𝑫} or 𝒀𝑫 or 𝑰𝑫, in cd/m².
The luminance of a single colour component (𝑹𝑫, 𝑮𝑫,
𝑩𝑫), means the luminance of an equivalent achromatic
signal with all three colour components having that
same value.
𝑭𝑫
𝑭𝑺
52](https://image.slidesharecdn.com/hdrandwcgprinciplespart2-210615182338/85/HDR-and-WCG-Principles-Part-2-52-320.jpg)
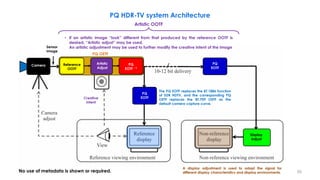
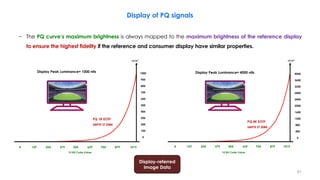
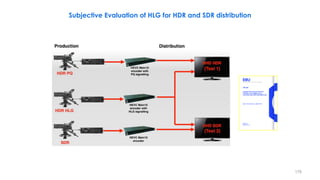
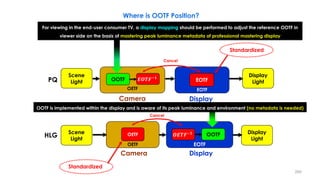
![To display HDR accurately, same settings between OETF of camera and EOTF of display are needed!!
--> Different settings make HDR signal and display to look wrong
Linear Scene Light
Cancel
OOTF=Artistic Intent
(seasoning)
EOTF-1
OOTF
Input [%]
Output
[cd/㎡ ]
Camera Monitor
Display Light
OETF
Optical Signal
Scene Light
Electronic Signal
EOTF
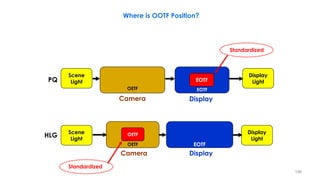
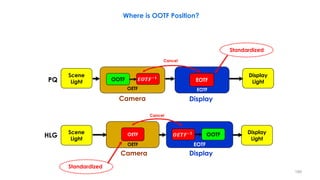
OOTF Position in PQ
Display-Referred Signal
Output [%]
Input [cd/㎡ ]
Display Linear Light
54](https://image.slidesharecdn.com/hdrandwcgprinciplespart2-210615182338/85/HDR-and-WCG-Principles-Part-2-54-320.jpg)
![To display HDR accurately, same settings between OETF of camera and EOTF of display are needed!!
--> Different settings make HDR signal and display to look wrong
Linear Scene Light
Cancel
OOTF=Artistic Intent
(seasoning)
EOTF-1
OOTF
Input [%]
Output
[cd/㎡ ]
Camera Monitor
Display Light
OETF
Optical Signal
Scene Light
Electronic Signal
EOTF
OOTF Position in PQ
Display-Referred Signal
Output [%]
Input [cd/㎡ ]
Display Linear Light
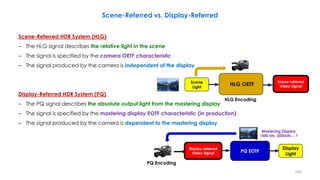
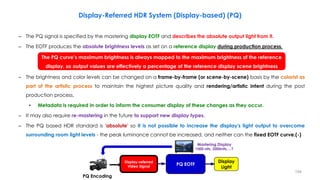
The PQ system specifies a display-referred HDR signal which means that the PQ signal describes the
absolute output light from the mastering display.
• Therefore, the mastering display EOTF transfer characteristics is implemented in the display and the
signal produced by the camera is dependent to the mastering display.
• That means that there is additional processing and metadata are required to convert the signal for a
particular screen.
55](https://image.slidesharecdn.com/hdrandwcgprinciplespart2-210615182338/85/HDR-and-WCG-Principles-Part-2-55-320.jpg)
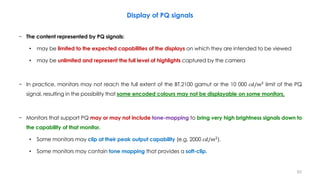
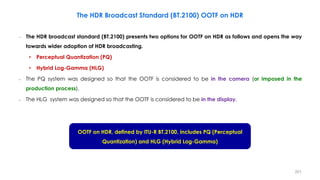
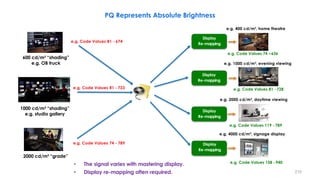
![PQ End to End Chain + Metadata
𝑬 𝑬′
𝑭𝑫
Non linear color value, encoded
in PQ space in the range [0,1].
The signal determined
by scene linear light, scaled by
camera exposure in the range [0:1]. The luminance of a displayed linear
component {𝑹𝑫, 𝑮𝑫, 𝑩𝑫} or 𝒀𝑫 or 𝑰𝑫.
Scene
Light
OOTF
PQ
𝑬𝑶𝑻𝑭−𝟏
Display-referred
Image Data
PQ OETF
PQ
EOTF
Display
Light
Decoding
Camera
Encoding
Mastering Display
E = {𝑹𝒔, 𝑮𝒔, 𝑩𝒔, 𝒀𝒔, or 𝑰𝒔}: The signal determined by scene linear light and scaled by camera exposure in the range [0:1].
E’= {R', G', B'} or { L', M', S'}: A non-linear PQ encoded color value in PQ space in the range [0,1].
𝑭𝑫: The luminance of a displayed linear component {𝑹𝑫, 𝑮𝑫, 𝑩𝑫} or 𝒀𝑫 or 𝑰𝑫, in cd/m².
• The luminance of a single colour component (𝑅𝐷, 𝐺𝐷, 𝐵𝐷), means the luminance of an equivalent achromatic signal
with all three colour components having that same value.
56](https://image.slidesharecdn.com/hdrandwcgprinciplespart2-210615182338/85/HDR-and-WCG-Principles-Part-2-56-320.jpg)
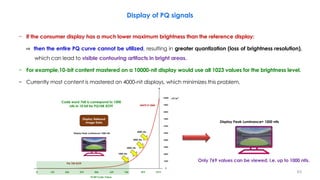
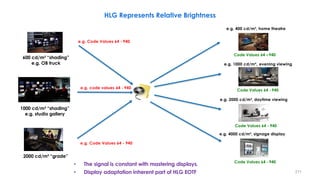
![PQ End to End Chain + Metadata
𝑬 𝑬′
Non linear color value, encoded
in PQ space in the range [0,1].
The signal determined
by scene linear light, scaled by
camera exposure in the range [0:1].
Scene
Light
OOTF
Display-referred
Image Data
PQ OETF
PQ
EOTF
Display
Light
Decoding
Camera
Encoding
Mastering Display
Display
Light
Display Adjustment
Other Display and Environments
OOTF
Adjust
PQ
EOTF
Decoding
Optional
Metadata
PQ
𝑬𝑶𝑻𝑭−𝟏
Metadata is needed for
display adjustment
The luminance of a displayed linear
component {𝑹𝑫, 𝑮𝑫, 𝑩𝑫} or 𝒀𝑫 or 𝑰𝑫.
𝑭𝑫
57](https://image.slidesharecdn.com/hdrandwcgprinciplespart2-210615182338/85/HDR-and-WCG-Principles-Part-2-57-320.jpg)
![
1
2
2
1
1
3
2
1
1
0
,
max
10000
EOTF
m
m
m
D
E
c
c
c
E
Y
Y
E
F
Parameter Values
Input signal to PQ electro-optical transfer
function (EOTF)
𝑬′ : Non-linear PQ encoded value.
The EOTF maps the non-linear PQ signal into display light.
Reference PQ EOTF 4a
(Note 4a – This same non-linearity (and its
inverse) should be used when it is necessary to
convert between the non-linear representation
and the linear representations.)
(Note 4b – In this Recommendation, when
referring to the luminance of a single colour
component (𝑅𝐷, 𝐺𝐷, 𝐵𝐷), it means the luminance
of an equivalent achromatic signal with all three
colour components having that same value.)
where:
𝑬′ (video level) denotes a non-linear colour value {𝑹′, 𝑮′, 𝑩′} or { 𝑳′, 𝑴′, 𝑺′} in PQ space in the range [0:1]
𝑭𝑫 is the luminance of a displayed linear component {𝑹𝑫, 𝑮𝑫, 𝑩𝑫} or 𝒀𝑫 or 𝑰𝑫, in cd/m². 4b
𝒀 denotes the normalized linear colour value, in the range [0:1] (Y=1 correspond to 𝑭𝑫=10000 nits)
𝑚1 = 2610/16384 = 0.1593017578125
𝑚2 = 2523/4096 × 128 = 78.84375
𝑐1 = 3424/4096 = 0.8359375 = 𝑐3 − 𝑐2 + 1
𝑐2 = 2413/4096 × 32 = 18.8515625
𝑐3 = 2392/4096 × 32 = 18.6875
Reference PQ EOTF, PQ OETF and PQ OOTF
𝑭𝑫
PQ
EOTF
Display
Light
Decoding
𝑬′
𝐹𝐷=EOTF[𝐸′
]=10000 Y
𝑌 =
max ሖ
𝐸
1
𝑚2 − 𝑐1 , 0
𝑐2 − 𝑐3
ሖ
𝐸
1
𝑚2
1
𝑚1
58](https://image.slidesharecdn.com/hdrandwcgprinciplespart2-210615182338/85/HDR-and-WCG-Principles-Part-2-58-320.jpg)
![Parameter Values
Input signal to PQ opto-electronic
transfer function (OETF)
𝑬: Scene linear light.
The OETF maps relative scene linear light into the non-linear PQ signal value.
Reference PQ OETF
Use of this OETF will yield the reference
OOTF when displayed on a reference
monitor employing the reference EOTF.
Where
𝑬′ is the resulting non-linear signal (𝑹′, 𝑮′, 𝑩′) in the range [0:1]
𝑭𝑫 and 𝑬 are as specified in the opto-optical transfer function
𝑚1, 𝑚2, 𝑐1, 𝑐2, 𝑐3 are as specified in the electro-optical transfer function.
Reference PQ EOTF, PQ OETF and PQ OOTF
𝐸′
= OETF[E] = EOTF−1
[OOTF[E]] = EOTF−1
[𝐹𝐷]
𝑭𝑫
PQ
EOTF
Display
Light
Decoding
Mastering Display
𝑬 𝑬′
OOTF
PQ
𝑬𝑶𝑻𝑭−𝟏
PQ OETF
Encoding
Scene
Light
𝐸𝑂𝑇𝐹−1
𝐹𝐷 =
𝑐1 + 𝑐2𝑌𝑚1
1 + 𝑐3𝑌𝑚1
𝑚2
𝑌 = 𝐹𝐷/10000
59](https://image.slidesharecdn.com/hdrandwcgprinciplespart2-210615182338/85/HDR-and-WCG-Principles-Part-2-59-320.jpg)
![Parameter Values
Input signal to PQ opto-optical transfer
function (OOTF)
𝑬: Scene linear light.
The OOTF maps relative scene linear light to display linear light.
Reference PQ OOTF
(Note 4c – The mapping of the camera
sensor signal output to 𝐸 may be
chosen to achieve the desired
brightness of the scene.)
where:
𝑬 = {𝑹𝒔, 𝑮𝒔, 𝑩𝒔, 𝒀𝒔, or 𝑰𝒔} is the signal determined by scene light and scaled by camera exposure
The values 𝑬 = {𝑹𝒔, 𝑮𝒔, 𝑩𝒔, 𝒀𝒔, or 𝑰𝒔} are in the range [0:1] 4c
𝑭𝑫 is the luminance of a displayed linear component {𝑹𝑫, 𝑮𝑫, 𝑩𝑫} or 𝒀𝑫 or 𝑰𝑫, in cd/m².
𝑬′ is a non-linear representation of 𝑬
Reference PQ EOTF, PQ OETF and PQ OOTF
FD = G1886[E'] = 100 E′ 2.4
FD = OOTF[E] = G1886 [G709[E]]
FD = G1886 [G709[E]] = G1886 E′
𝐸′
= 𝐺709 𝐸 = ቊ1.099(59.5208𝐸)0.45 − 0.099 0.0003024 < 𝐸 < 1
267.84𝐸 0 < 𝐸 < 0.0003024
FD = OOTF[E] = G1886 [G709[E]] =G1886 [E′] = 100𝐸′2.4
E:
OOTF[E] = G1886 [G709[E]]
𝑭𝑫
PQ
EOTF
Display
Light
Decoding
Mastering Display
𝑬 𝑬′
OOTF
PQ
𝑬𝑶𝑻𝑭−𝟏
PQ OETF
Encoding
Scene
Light
60](https://image.slidesharecdn.com/hdrandwcgprinciplespart2-210615182338/85/HDR-and-WCG-Principles-Part-2-60-320.jpg)
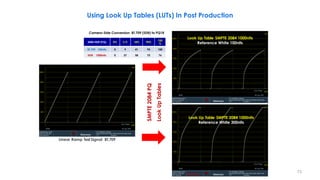
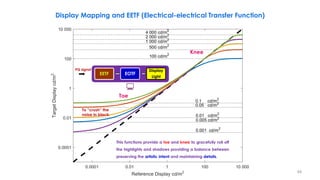
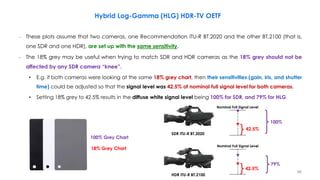
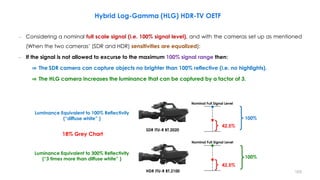
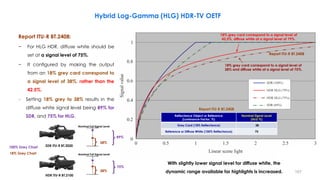
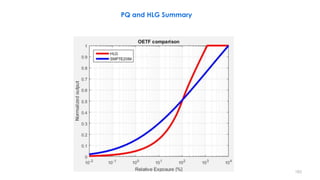
![Hybrid Log-Gamma (HLG) HDR-TV OETF
Standardized as ARIB STB-B67 and ITU-R BT.2100
a = 0.17883277
b = 0.28466892
c = 0.55991073
𝑬′
= 𝑶𝑬𝑻𝑭 𝑬 =
𝟑𝑬 𝟎 ≤ 𝑬 ≤
𝟏
𝟏𝟐
𝒂. 𝒍𝒏 𝟏𝟐𝑬 − 𝒃 + 𝒄
𝟏
𝟏𝟐
< 𝑬 ≤ 𝟏
a = 0.17883277, b = 0.28466892, c = 0.55991073
Linear Scene Light
Signal
Level
SDR OETF
SDR with Knee
HDR HLG OETF
Knee point: 87.5% signal level
Reflectance Object or Reference
(Luminance Factor, %)
Nominal Signal
Level (%)
Grey Card (18% Reflectance) 42.5
Reference or Diffuse White (100%
Reflectance)
79
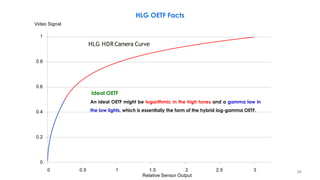
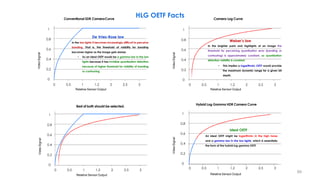
A notional SDR “knee” is shown on the same plot, with
a breakpoint of 87.5% signal level, which extends the
SDR dynamic capture range substantially.
SDR OETF
SDR with Knee
HDR HLG OETF
E (Scene Light) : signal for each colour component {Rs, Gs, Bs} proportional to scene linear light and scaled by
camera exposure, normalized to the range [0:1]
E′ (Video Level): The resulting non-linear signal {R′, G′, B′} in the range [0:1].
ITU-R Application 2 ,ARIB B67 (Association of Radio Industries and Businesses)
HLG can capture
nearly a factor of 3
more luminance than
100% reflectivity.
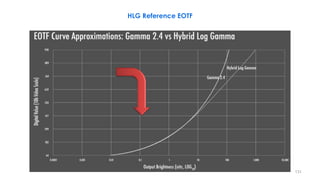
91](https://image.slidesharecdn.com/hdrandwcgprinciplespart2-210615182338/85/HDR-and-WCG-Principles-Part-2-91-320.jpg)
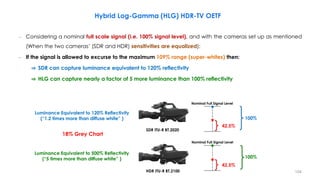
![Hybrid Log-Gamma (HLG) HDR-TV OETF
Standardized as ARIB STB-B67 and ITU-R BT.2100
a = 0.17883277
b = 0.28466892
c = 0.55991073
𝑬′
= 𝑶𝑬𝑻𝑭 𝑬 =
𝟑𝑬 𝟎 ≤ 𝑬 ≤
𝟏
𝟏𝟐
𝒂. 𝒍𝒏 𝟏𝟐𝑬 − 𝒃 + 𝒄
𝟏
𝟏𝟐
< 𝑬 ≤ 𝟏
E (Scene Light) : signal for each colour component {Rs, Gs, Bs} proportional to scene linear light and scaled by
camera exposure, normalized to the range [0:1]
E′ (Video Level): The resulting non-linear signal {R′, G′, B′} in the range [0:1].
a = 0.17883277, b = 0.28466892, c = 0.55991073
Linear Scene Light
Signal
Level
SDR OETF
SDR with Knee
HDR HLG OETF
Knee point: 87.5% signal level
More
Code
Words
for
Dark
Area
Less
Code
Words
for
Bright
Area
A notional SDR “knee” is shown on the same plot, with
a breakpoint of 87.5% signal level, which extends the
SDR dynamic capture range substantially.
Reflectance Object or Reference
(Luminance Factor, %)
Nominal Signal
Level (%)
Grey Card (18% Reflectance) 42.5
Reference or Diffuse White (100%
Reflectance)
79
SDR OETF
SDR with Knee
HDR HLG OETF
ITU-R Application 2 ,ARIB B67 (Association of Radio Industries and Businesses)
HLG can capture
nearly a factor of 3
more luminance than
100% reflectivity.
92](https://image.slidesharecdn.com/hdrandwcgprinciplespart2-210615182338/85/HDR-and-WCG-Principles-Part-2-92-320.jpg)

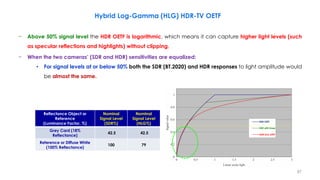
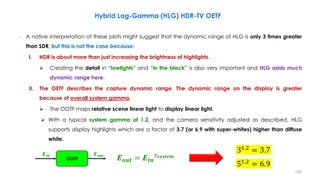
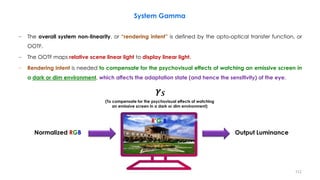
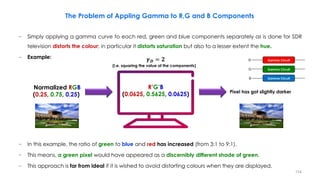
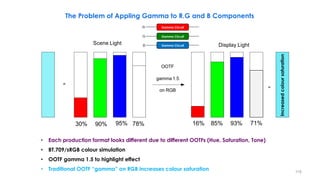
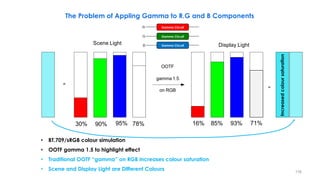
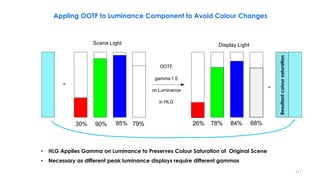
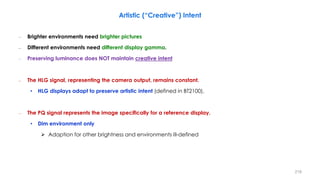
![− Instead of the current SDR practice of applying a gamma curve independently to each colour
component, for HDR it should be applied to the luminance alone.
− By applying rendering intent (OOTF) to the luminance component only it is possible to avoid colour
changes in the display.
− According to Recommendation ITU-R BT.2100, luminance is given by:
− 𝒀𝒔: normalized linear scene luminance
− 𝑹𝒔, 𝑮𝒔 and 𝑩𝒔: normalized linear scene light (i.e. before applying OETF) colour components signals
𝒀𝒔 = 𝟎. 𝟐𝟔𝟐𝟕𝑹𝒔 + 𝟎. 𝟔𝟕𝟖𝟎𝑮𝒔 + 𝟎. 𝟎𝟓𝟗𝟑𝑩𝒔
HLG OETF HLG EOTF
𝑬: [𝟎,𝟏] 𝑬′: [𝟎,𝟏]
𝑭𝑫
Linear Scene-light
Signals 𝑹𝒔, 𝑮𝒔, 𝑩𝒔
Linear Display-light
Signals 𝑹𝑫, 𝑮𝑫, 𝑩𝑫
Non-linear
Signals 𝑹𝒔, 𝑮𝒔, 𝑩𝒔
Appling OOTF to Luminance Component to Avoid Colour Changes
𝑭𝑺
118](https://image.slidesharecdn.com/hdrandwcgprinciplespart2-210615182338/85/HDR-and-WCG-Principles-Part-2-118-320.jpg)
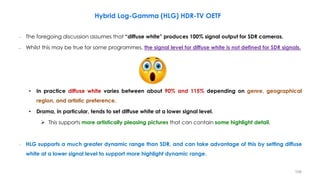
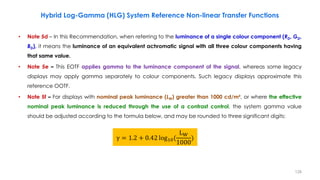
![− The HLG reference OOTF is therefore given by:
𝑭𝑫: luminance of a displayed linear component {𝑹𝑫, 𝑮𝑫, or 𝑩𝑫}, in cd/m²
𝑬: signal for each colour component {𝑹𝑺, 𝑮𝑺, 𝑩𝑺} proportional to scene linear light and scaled by camera
exposure, normalized to the range [0:1].
𝜶 : user adjustment for the luminance of the display, commonly known in the past as a “contrast control”.
• It represents 𝑳𝑾, the nominal peak luminance of a display for achromatic pixels in cd/m².
𝜸 : is an exponent, which varies depending on 𝑳𝑾, and which is equal to 1.2 at the nominal display peak
luminance of 1000 cd/m²
𝒀𝒔 = 𝟎. 𝟐𝟔𝟐𝟕𝑹𝒔 + 𝟎. 𝟔𝟕𝟖𝟎𝑮𝒔 + 𝟎. 𝟎𝟓𝟗𝟑𝑩𝒔
𝑭𝑫 = 𝑶𝑶𝑻𝑭 𝑬 = 𝛂𝒀𝑺
𝜸−𝟏
𝑬
𝑹𝑫 = 𝛂𝒀𝑺
𝜸−𝟏
𝑹𝑺
𝑮𝑫 = 𝛂𝒀𝑺
𝜸−𝟏
𝑮𝑺
𝑩𝑫 = 𝛂𝒀𝑺
𝜸−𝟏
𝑩𝑺
Appling OOTF to Luminance Component to Avoid Colour Changes
119](https://image.slidesharecdn.com/hdrandwcgprinciplespart2-210615182338/85/HDR-and-WCG-Principles-Part-2-119-320.jpg)
![Reference OOTF = OETF (HLG) + EOTF (HLG)
– Opto-Electronic Transfer Function (OETF): Scene light to electrical signal
– Electro-Optical Transfer Function (EOTF): Electrical signal to scene light
OOTF (Opto-Optical Transfer Function)
HLG OETF HLG EOTF
𝑬: [𝟎, 𝟏] 𝑬′
: [𝟎, 𝟏]
𝑭𝑫
Linear Scene-light
Signals 𝑹𝒔, 𝑮𝒔, 𝑩𝒔
Non-linear
Signals 𝑹𝒔, 𝑮𝒔, 𝑩𝒔
Linear Display-light
Signals 𝑹𝑫, 𝑮𝑫, 𝑩𝑫
𝑭𝑺
120](https://image.slidesharecdn.com/hdrandwcgprinciplespart2-210615182338/85/HDR-and-WCG-Principles-Part-2-120-320.jpg)
![– Opto-Electronic Transfer Function (OETF): Scene light to electrical signal
– Electro-Optical Transfer Function (EOTF): Electrical signal to scene light
OOTF (Opto-Optical Transfer Function)
HLG OETF HLG EOTF
𝑬: [𝟎, 𝟏] 𝑬′
: [𝟎, 𝟏]
Linear Scene-light
Signals 𝑹𝒔, 𝑮𝒔, 𝑩𝒔
Non-linear
Signals 𝑹𝒔, 𝑮𝒔, 𝑩𝒔
Linear Display-light
Signals 𝑹𝑫, 𝑮𝑫, 𝑩𝑫
Non linear color value,
encoded in PQ space in
the range [0,1].
The signal determined by scene
linear light, scaled by camera
exposure in the range [0:1].
𝑭𝑫 :The luminance of a displayed linear
component {𝑹𝑫, 𝑮𝑫, 𝑩𝑫} in cd/m².
The luminance of a single colour component (𝑹𝑫, 𝑮𝑫,
𝑩𝑫 ), means the luminance of an equivalent
achromatic signal with all three colour components
having that same value.
𝑭𝑫
𝑭𝑺
121](https://image.slidesharecdn.com/hdrandwcgprinciplespart2-210615182338/85/HDR-and-WCG-Principles-Part-2-121-320.jpg)
![To display HDR accurately, same settings between OETF of camera and EOTF of display are needed!!
--> Different settings make HDR signal and display to look wrong
Cancel
OOTF=Artistic Intent
(seasoning)
OETF-1 OOTF
Input [%]
Output
[cd/㎡ ]
Camera Monitor
Display Light
EOTF
Optical Signal
Scene Light
Electronic Signal
OETF
OOTF Position in HLG
Scene-Referred Signal
Linear Scene Light
Output [%]
Input [cd/㎡ ]
Display Linear Light
122](https://image.slidesharecdn.com/hdrandwcgprinciplespart2-210615182338/85/HDR-and-WCG-Principles-Part-2-122-320.jpg)
![To display HDR accurately, same settings between OETF of camera and EOTF of display are needed!!
--> Different settings make HDR signal and display to look wrong
Cancel
OOTF=Artistic Intent
(seasoning)
OETF-1 OOTF
Input [%]
Output
[cd/㎡ ]
Camera Monitor
Display Light
EOTF
Optical Signal
Scene Light
Electronic Signal
OETF
OOTF Position in HLG
Scene-Referred Signal
Linear Scene Light
Output [%]
Input [cd/㎡ ]
Display Linear Light
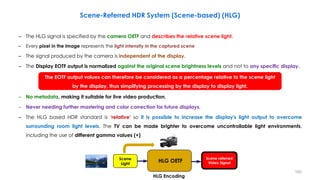
The HLG system specifies a scene-referred HDR signal which means that every pixel value in the image
represents the light intensity in the captured scene.
• Therefore, the transfer characteristics can be implemented directly in the camera and the signal
produced by the camera is independent of the display.
• That means that there is no additional processing and no metadata are required to convert the signal
for a particular screen.
123](https://image.slidesharecdn.com/hdrandwcgprinciplespart2-210615182338/85/HDR-and-WCG-Principles-Part-2-123-320.jpg)
![HLG End to End Chain
𝑬
𝑭𝑫
Non linear color value, encoded
in HLG space in the range [0,1].
The signal determined
by scene linear light, scaled by
camera exposure in the range [0:1].
The luminance of a displayed
linear component
Scene
Light
Scene-referred
Image Data
HLG OETF
Display
Light
Encoding
Reference Display
HLG
O𝐄𝐓𝐅 −𝟏
Decoding
OOTF
HLG EOTF
𝑬′
𝑬 = {𝑹𝒔, 𝑮𝒔, 𝑩𝒔}: The signal determined by scene linear light and scaled by camera exposure in the range [0:1].
𝑬’= {𝑹′, 𝑮′, 𝑩′}: A non-linear PQ encoded color value in PQ space in the range [0,1].
𝑭𝑫: The luminance of a displayed linear component in nits.
The luminance of a single colour component (𝑹𝑫, 𝑮𝑫, 𝑩𝑫), means the luminance of an equivalent achromatic signal with
all three colour components having that same value.
124](https://image.slidesharecdn.com/hdrandwcgprinciplespart2-210615182338/85/HDR-and-WCG-Principles-Part-2-124-320.jpg)
![HLG End to End Chain
𝑬
Non linear color value, encoded
in HLG space in the range [0,1].
The signal determined
by scene linear light, scaled by
camera exposure in the range [0:1].
The luminance of a displayed
linear component
Scene
Light
Scene-referred
Image Data
HLG OETF
Display
Light
Encoding
Reference Display
HLG
O𝐄𝐓𝐅 −𝟏
Decoding
OOTF
HLG EOTF
𝑬′
𝑭𝑫
The luminance of a displayed
linear component
Non-reference
Display Light
Non Reference Display and Environment
HLG
O𝐄𝐓𝐅 −𝟏
Decoding
OOTF
HLG EOTF
Reference
No Metadata is needed for
display adjustment
𝑬′
Other Display and Environments
Display Adjustment
OOTF
Adjust
𝑭𝑫
Reference
125](https://image.slidesharecdn.com/hdrandwcgprinciplespart2-210615182338/85/HDR-and-WCG-Principles-Part-2-125-320.jpg)
![Parameter Values
Input signal to HLG OETF
E: Scene linear light signal.
The OETF maps relative scene linear light into the non-linear signal value.
HLG Reference OETF 5a
𝑬 is a signal for each colour component {𝑹𝒔, 𝑮𝒔, 𝑩𝒔} proportional to scene linear light normalized to the range
[0:1]. 5b
𝑬′ is the resulting non-linear signal {𝑹′, 𝑮′, 𝑩′} in the range [0:1].
𝒂 = 𝟎. 𝟏𝟕𝟖𝟖𝟑𝟐𝟕𝟕, 𝒃 = 𝟏 − 𝟒𝒂, 𝒄 = 𝟎. 𝟓 − 𝒂. 𝒍𝒏(𝟒𝒂) 5c
Hybrid Log-Gamma (HLG) System Reference Non-linear Transfer Functions
• Note 5a – The inverse of this non-linearity should be used when it is necessary to convert between the non-linear representation and the linear representation of scene light.
• Note 5b – The mapping of the camera sensor signal output to E may be chosen to achieve the desired brightness of the scene.
• Note 5c – The values of b and c are calculated to b = 0.28466892, c = 0.55991073.
𝑬′ = 𝑶𝑬𝑻𝑭 𝑬 =
𝟑𝑬 𝟎 ≤ 𝑬 ≤
𝟏
𝟏𝟐
𝒂. 𝒍𝒏 𝟏𝟐𝑬 − 𝒃 + 𝒄
𝟏
𝟏𝟐
< 𝑬 ≤ 𝟏
𝑬 𝑬′
𝑭𝑫
Scene
Light
Scene-referred
Image Data
HLG OETF
Display
Light
Encoding
HLG
O𝐄𝐓𝐅 −𝟏
Decoding
OOTF
HLG EOTF
126](https://image.slidesharecdn.com/hdrandwcgprinciplespart2-210615182338/85/HDR-and-WCG-Principles-Part-2-126-320.jpg)
![Parameter Values
HLG Input signal to OOTF
E: Scene linear light signal.
The OOTF maps relative scene linear light to display linear light.
HLG Reference OOTF 5i
𝑭𝑫 is the luminance of a displayed linear component {𝑹𝑫, 𝑮𝑫, 𝑩𝑫}, in 𝒄𝒅/𝒎𝟐. 5d
𝑬 is a signal for each colour component {𝑹𝒔, 𝑮𝒔, 𝑩𝒔} proportional to scene linear light normalized to the range [𝟎: 𝟏].
𝒀𝑺 is the normalized linear scene luminance.
α is the variable for user gain in 𝒄𝒅/𝒎𝟐. It represents 𝑳𝑾, the nominal peak luminance of a display for achromatic pixels.
𝜸 is the system gamma.
𝜸 = 𝟏. 𝟐 at the nominal display peak luminance of 𝟏𝟎𝟎𝟎 𝒄𝒅/𝒎𝟐. 5e, 5f, 5g
Hybrid Log-Gamma (HLG) System Reference Non-linear Transfer Functions
𝑭𝑫 = 𝑶𝑶𝑻𝑭 𝑬 = 𝛂𝒀𝑺
𝜸−𝟏
𝑬
𝑹𝑫 = 𝛂𝒀𝑺
𝜸−𝟏
𝑹𝑺
𝑮𝑫 = 𝛂𝒀𝑺
𝜸−𝟏
𝑮𝑺
𝑩𝑫 = 𝛂𝒀𝑺
𝜸−𝟏
𝑩𝑺
𝒀𝒔 = 𝟎. 𝟐𝟔𝟐𝟕𝑹𝒔 + 𝟎. 𝟔𝟕𝟖𝟎𝑮𝒔 + 𝟎. 𝟎𝟓𝟗𝟑𝑩𝒔
𝑬 𝑬′
𝑭𝑫
Scene
Light
Scene-referred
Image Data
HLG OETF
Display
Light
Encoding
HLG
O𝐄𝐓𝐅 −𝟏
Decoding
OOTF
HLG EOTF
127](https://image.slidesharecdn.com/hdrandwcgprinciplespart2-210615182338/85/HDR-and-WCG-Principles-Part-2-127-320.jpg)
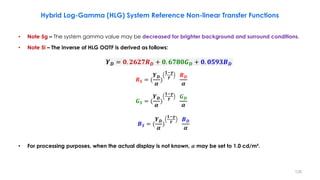
![Parameter Values
Input signal to HLG EOTF
𝑬′: Non-linear HLG encoded signal.
The EOTF maps the non-linear HLG signal into display light.
HLG Reference EOTF
Note 5h:
• During production, signal values are expected to
exceed the range E′ = [0:1]. This provides processing
headroom and avoids signal degradation during
cascaded processing.
• Such values of E′, below 0 or exceeding 1, should not
be clipped during production and exchange.
• Values below 0 should not be clipped in reference
displays (even though they represent “negative”
light) to allow the black level of the signal (LB) to be
properly set using test signals known as “PLUGE”.
𝑭𝑫 is the luminance of a displayed linear component signal {RD, GD, BD}, in 𝒄𝒅/𝒎𝟐.
𝑬′ is the non-linear signal {𝑹′, 𝑮′, 𝑩′} as defined for the HLG Reference OETF. 5h
OOTF[ ] is as defined for the HLG Reference OOTF.
𝐎𝐄𝐓𝐅−𝟏[] is:
The values of parameters 𝒂, 𝒃, and 𝒄 are as defined for the HLG Reference OETF.
β is the variable for user black level lift and:
𝑳𝑾 is nominal peak luminance of the display in 𝒄𝒅/𝒎𝟐 for achromatic pixels.
𝑳𝑩 is the display luminance for black in 𝒄𝒅/𝒎𝟐.
Hybrid Log-Gamma (HLG) System Reference Non-linear Transfer Functions
𝑭𝑫 = 𝑬𝑶𝑻𝑭 𝐦𝐚𝐱 𝟎, 𝟏 − 𝜷 𝑬′
+ 𝜷
𝑭𝑫 = 𝑶𝑶𝑻𝑭[𝑶𝑬𝑻𝑭−𝟏
𝒎𝒂𝒙 𝟎, 𝟏 − 𝜷 𝑬′
+ 𝜷 ]
𝑬 𝑬′
𝑭𝑫
Scene
Light
Scene-referred
Image Data
HLG OETF
Display
Light
Encoding
HLG
O𝐄𝐓𝐅 −𝟏
Decoding
OOTF
HLG EOTF
𝑬 = 𝑶𝑬𝑻𝑭−𝟏 𝑬′ =
𝑬′𝟐
𝟑
𝟎 ≤ 𝑬′
≤
𝟏
𝟏𝟐
𝒆(
𝑬′−𝒄
𝒂
)
+ 𝒃
𝟏𝟐
𝟏
𝟏𝟐
< 𝑬′
≤ 𝟏
𝜷 = 𝟑
𝑳𝑩
𝑳𝑾
ൗ
𝟏
𝜸
130](https://image.slidesharecdn.com/hdrandwcgprinciplespart2-210615182338/85/HDR-and-WCG-Principles-Part-2-130-320.jpg)
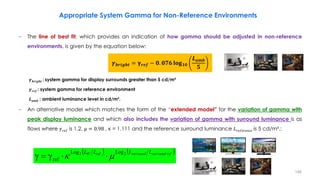
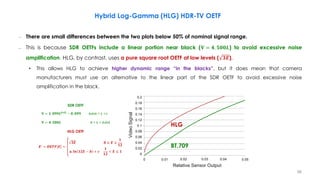
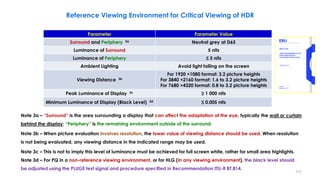
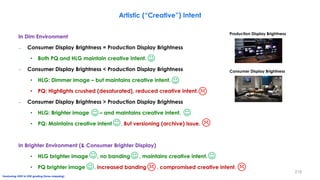
![Display of HLG Signals
The contrast, brightness and display system gamma (𝜶, 𝜷 and 𝜸 in OOTF and EOTF) are adjusted according
to the viewing environment and nominal peak luminance of the display, as appropriate.
𝑹𝑫 = 𝛂𝒀𝑺
𝜸−𝟏
𝑹𝑺
𝑮𝑫 = 𝛂𝒀𝑺
𝜸−𝟏
𝑮𝑺
𝑩𝑫 = 𝛂𝒀𝑺
𝜸−𝟏
𝑩𝑺
𝒀𝒔 = 𝟎. 𝟐𝟔𝟐𝟕𝑹𝒔 + 𝟎. 𝟔𝟕𝟖𝟎𝑮𝒔 + 𝟎. 𝟎𝟓𝟗𝟑𝑩𝒔
𝑭𝑫 = 𝑬𝑶𝑻𝑭 𝐦𝐚𝐱 𝟎, 𝟏 − 𝜷 𝑬′
+ 𝜷
𝑭𝑫 = 𝑶𝑶𝑻𝑭[𝑶𝑬𝑻𝑭−𝟏
𝒎𝒂𝒙 𝟎, 𝟏 − 𝜷 𝑬′
+ 𝜷 ]
𝑬 = 𝑶𝑬𝑻𝑭−𝟏
𝑬′
=
𝑬′𝟐
𝟑
𝟎 ≤ 𝑬′
≤
𝟏
𝟏𝟐
𝒆(
𝑬′−𝒄
𝒂
)
+ 𝒃
𝟏𝟐
𝟏
𝟏𝟐
< 𝑬′
≤ 𝟏
𝜷 = 𝟑
𝑳𝑩
𝑳𝑾
ൗ
𝟏
𝜸
𝑭𝑫 = 𝑶𝑶𝑻𝑭 𝑬 = 𝛂𝒀𝑺
𝜸−𝟏
𝑬
152](https://image.slidesharecdn.com/hdrandwcgprinciplespart2-210615182338/85/HDR-and-WCG-Principles-Part-2-152-320.jpg)
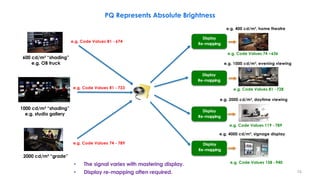
![Scene
Light
SDR
Signal
Camera
HLG
Signal
PQ
Signal
Sensor
Relative Linear Scene Light
(Volts)
Lens
Set Exposure (Iris)
Relative
Non-linear Signal
[0,1]
Absolute
Non-linear Signal
[0,1]
A Closer Look at the Camera
SDR OETF
(“Gamma”)
HLG OETF
PQ OETF
Relative
Non-linear Signal
[0,1]
184](https://image.slidesharecdn.com/hdrandwcgprinciplespart2-210615182338/85/HDR-and-WCG-Principles-Part-2-184-320.jpg)

![Reference OOTF = OETF + EOTF
– Opto-Electronic Transfer Function (OETF): Scene light to electrical signal
– Electro-Optical Transfer Function (EOTF): Electrical signal to scene light
OOTF (Opto-Optical Transfer Function)
OETF
HLG/PQ
EOTF
HLG/PQ
𝑬: [𝟎, 𝟏] 𝑬′
: [𝟎, 𝟏]
𝑭𝑫
Linear Scene-light
Signals 𝑹𝒔, 𝑮𝒔, 𝑩𝒔
Linear Display-light
Signals 𝑹𝑫, 𝑮𝑫, 𝑩𝑫
Non-linear
Signals 𝑹𝒔, 𝑮𝒔, 𝑩𝒔
191](https://image.slidesharecdn.com/hdrandwcgprinciplespart2-210615182338/85/HDR-and-WCG-Principles-Part-2-191-320.jpg)
![To display HDR accurately, same settings between OETF of camera and EOTF of display are needed!!
--> Different settings make HDR signal and display to look wrong
Cancel
OOTF=Artistic Intent
(seasoning)
EOTF-1
OOTF
Input [%]
Output
[cd/㎡ ]
Camera Monitor
Display Light
OETF
Optical Signal
Scene Light
Electronic Signal
EOTF
OOTF Position in PQ
Display-Referred Signal
Output [%]
Input [cd/㎡ ]
Display Linear Light
Linear Scene Light
202](https://image.slidesharecdn.com/hdrandwcgprinciplespart2-210615182338/85/HDR-and-WCG-Principles-Part-2-202-320.jpg)
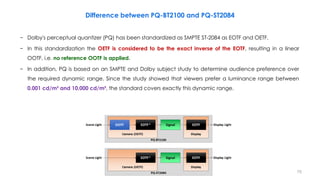
![To display HDR accurately, same settings between OETF of camera and EOTF of display are needed!!
--> Different settings make HDR signal and display to look wrong
Cancel
OOTF=Artistic Intent
(seasoning)
EOTF-1
OOTF
Input [%]
Output
[cd/㎡ ]
Camera Monitor
Display Light
OETF
Optical Signal
Scene Light
Electronic Signal
EOTF
OOTF Position in PQ
Display-Referred Signal
Output [%]
Input [cd/㎡ ]
Display Linear Light
The PQ system specifies a display-referred HDR signal which means that the PQ signal describes the
absolute output light from the mastering display.
• Therefore, the mastering display EOTF transfer characteristics is implemented in the display and the
signal produced by the camera is dependent to the mastering display.
• That means that there is additional processing and metadata are required to convert the signal for a
particular screen.
Linear Scene Light
203](https://image.slidesharecdn.com/hdrandwcgprinciplespart2-210615182338/85/HDR-and-WCG-Principles-Part-2-203-320.jpg)
![To display HDR accurately, same settings between OETF of camera and EOTF of display are needed!!
--> Different settings make HDR signal and display to look wrong
Cancel
OOTF=Artistic Intent
(seasoning)
OETF-1 OOTF
Input [%]
Output
[cd/㎡ ]
Camera Monitor
Display Light
EOTF
Optical Signal
Scene Light
Electronic Signal
OETF
OOTF Position in HLG
Scene-Referred Signal
Linear Scene Light
Output [%]
Input [cd/㎡ ]
Display Linear Light
204](https://image.slidesharecdn.com/hdrandwcgprinciplespart2-210615182338/85/HDR-and-WCG-Principles-Part-2-204-320.jpg)
![To display HDR accurately, same settings between OETF of camera and EOTF of display are needed!!
--> Different settings make HDR signal and display to look wrong
Cancel
OOTF=Artistic Intent
(seasoning)
OETF-1 OOTF
Input [%]
Output
[cd/㎡ ]
Camera Monitor
Display Light
EOTF
Optical Signal
Scene Light
Electronic Signal
OETF
OOTF Position in HLG
Scene-Referred Signal
Linear Scene Light
Output [%]
Input [cd/㎡ ]
Display Linear Light
The HLG system specifies a scene-referred HDR signal which means that every pixel value in the image
represents the light intensity in the captured scene.
• Therefore, the transfer characteristics can be implemented directly in the camera and the signal
produced by the camera is independent of the display.
• That means that there is no additional processing and no metadata are required to convert the signal
for a particular screen.
205](https://image.slidesharecdn.com/hdrandwcgprinciplespart2-210615182338/85/HDR-and-WCG-Principles-Part-2-205-320.jpg)
![PQ End to End Chain + Metadata
𝑬 𝑬′
Non linear color value, encoded
in PQ space in the range [0,1].
The signal determined
by scene linear light, scaled by
camera exposure in the range [0:1].
Scene
Light
OOTF
Display-referred
Image Data
PQ OETF
PQ
EOTF
Display
Light
Decoding
Camera
Encoding
Mastering Display
Display
Light
Display Adjustment
Other Display and Environments
OOTF
Adjust
PQ
EOTF
Decoding
Optional
Metadata
PQ
𝑬𝑶𝑻𝑭−𝟏
Metadata is needed for
display adjustment
The luminance of a displayed linear
component {𝑹𝑫, 𝑮𝑫, 𝑩𝑫} or 𝒀𝑫 or 𝑰𝑫.
𝑭𝑫
206](https://image.slidesharecdn.com/hdrandwcgprinciplespart2-210615182338/85/HDR-and-WCG-Principles-Part-2-206-320.jpg)
![HLG End to End Chain
𝑬
Non linear color value, encoded
in HLG space in the range [0,1].
The signal determined
by scene linear light, scaled by
camera exposure in the range [0:1].
The luminance of a displayed
linear component
Scene
Light
Scene-referred
Image Data
HLG OETF
Display
Light
Encoding
Reference Display
HLG
O𝐄𝐓𝐅 −𝟏
Decoding
OOTF
HLG EOTF
𝑬′
𝑭𝑫
The luminance of a displayed
linear component
Non-reference
Display Light
Non Reference Display and Environment
HLG
O𝐄𝐓𝐅 −𝟏
Decoding
OOTF
HLG EOTF
Reference
No Metadata is needed for
display adjustment
𝑬′
Other Display and Environments
Display Adjustment
OOTF
Adjust
𝑭𝑫
Reference
207](https://image.slidesharecdn.com/hdrandwcgprinciplespart2-210615182338/85/HDR-and-WCG-Principles-Part-2-207-320.jpg)

The document discusses high dynamic range (HDR) imaging technologies including: - Standards for HDR encoding like SMPTE ST 2084 (PQ) and ARIB/ITU-R BT.2100 (HLG) - Opto-electronic transfer functions (OETFs) and electro-optical transfer functions (EOTFs) used in HDR systems - The human visual system's sensitivity to luminance levels and how this relates to quantization in HDR images


