Downloaded 27 times
![What does Modeling Mean?
A Class is a Model Model of a Building Data Model
class Employee {
FirstName : String
LastName : String
DOB : java.calendar.Date
Grades : Seq[Grade]
}](https://image.slidesharecdn.com/connectdsdatabricksfordatascientists-180706201741/75/Azure-Databricks-for-Data-Scientists-27-2048.jpg)

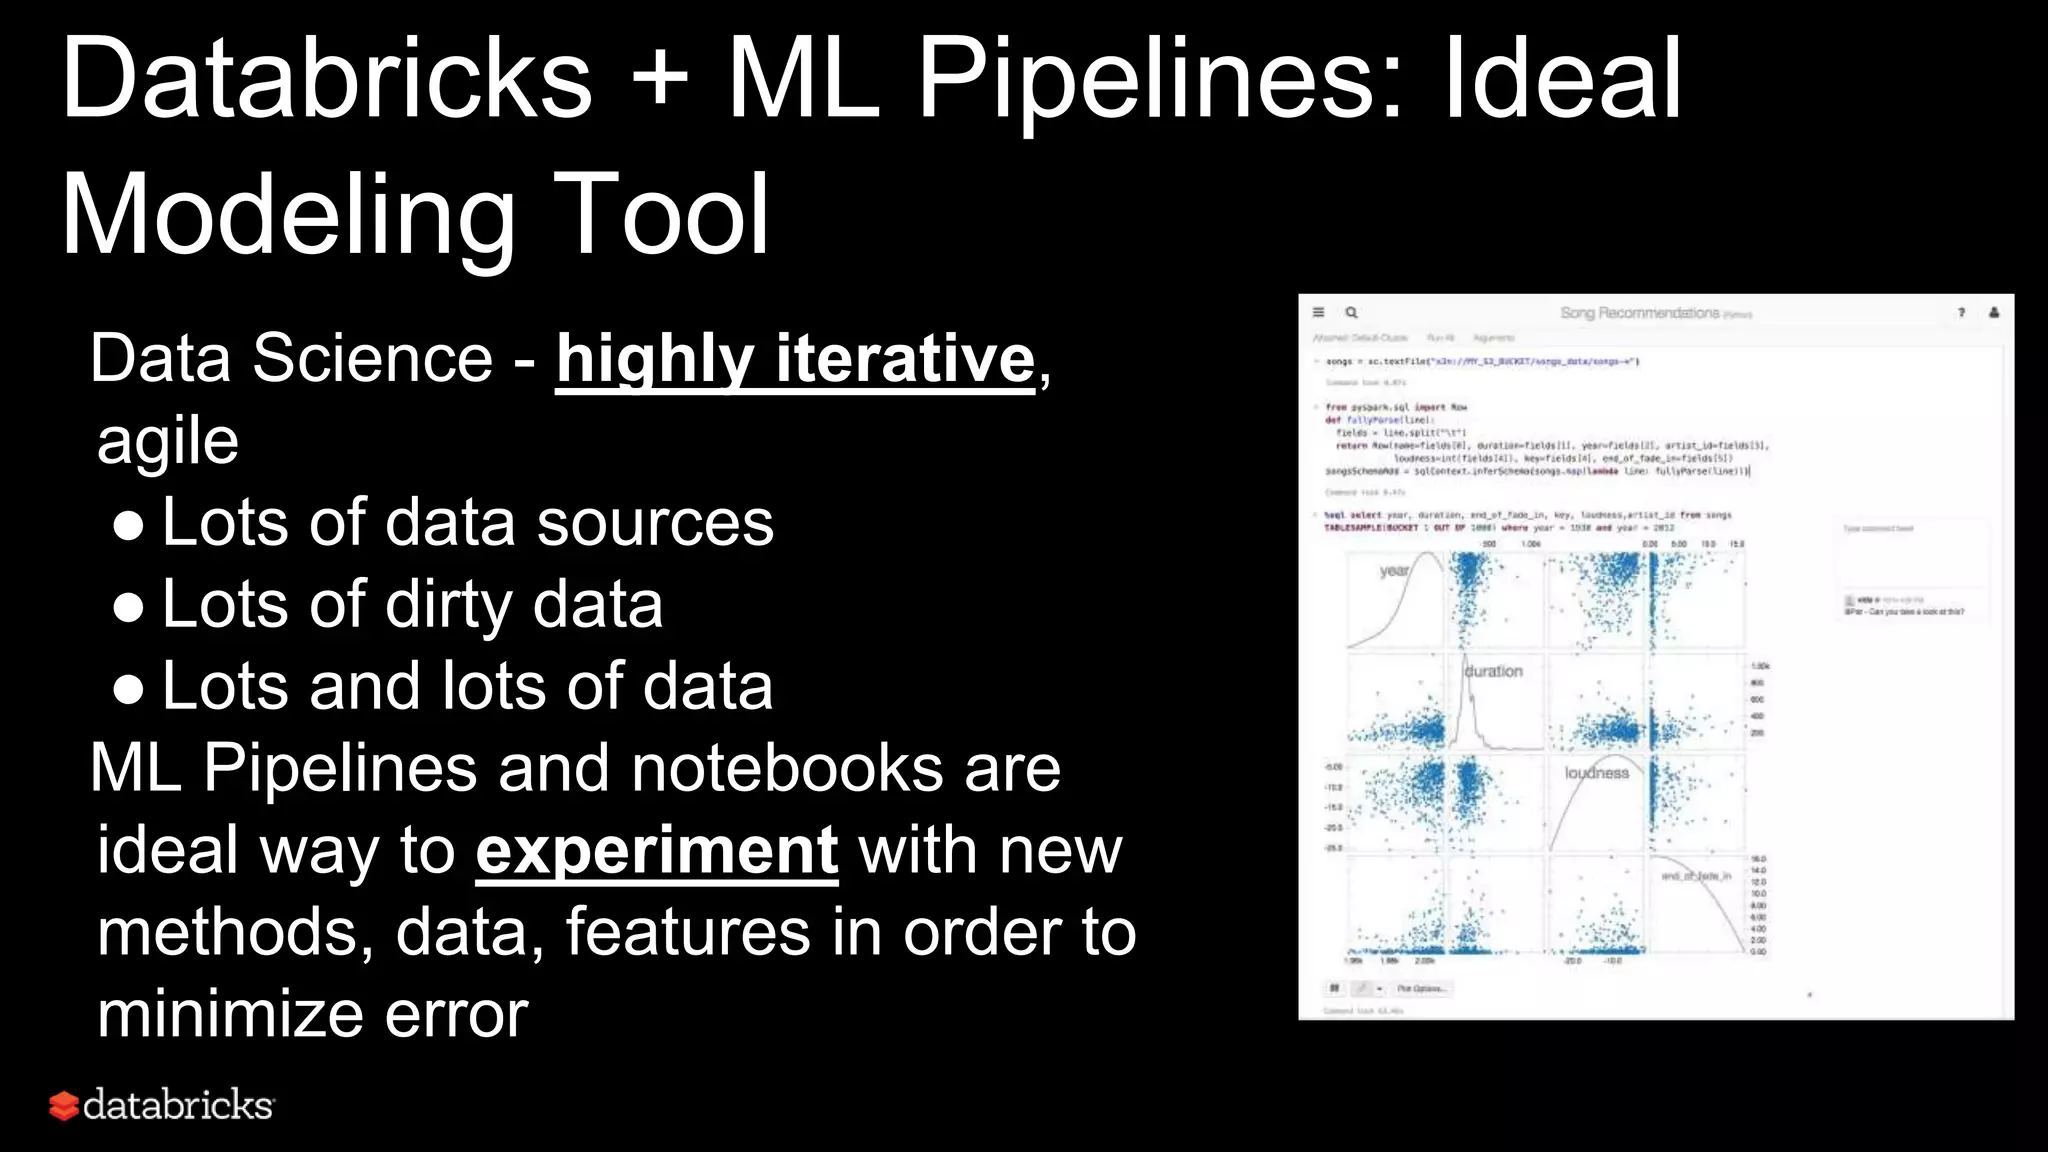
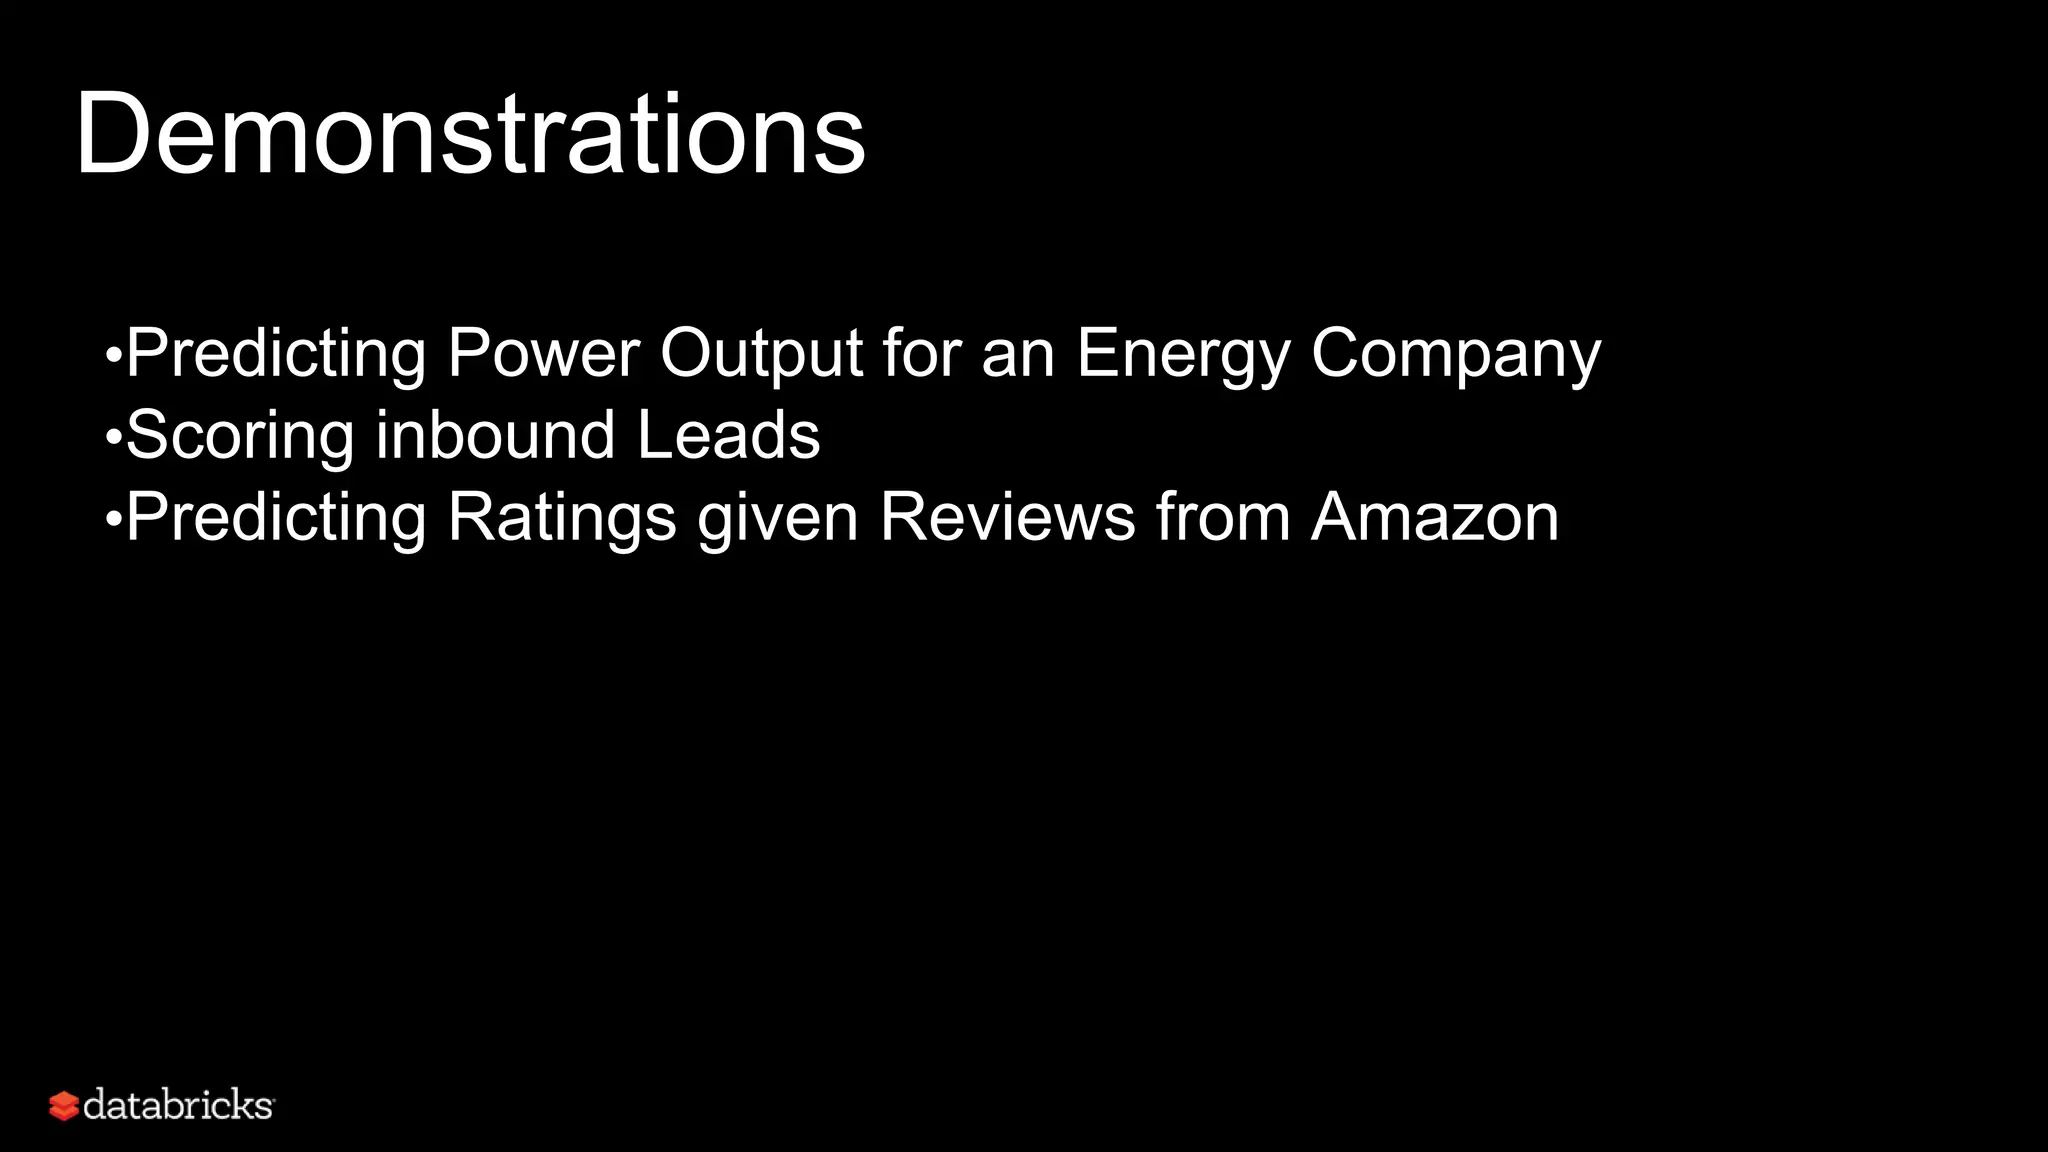

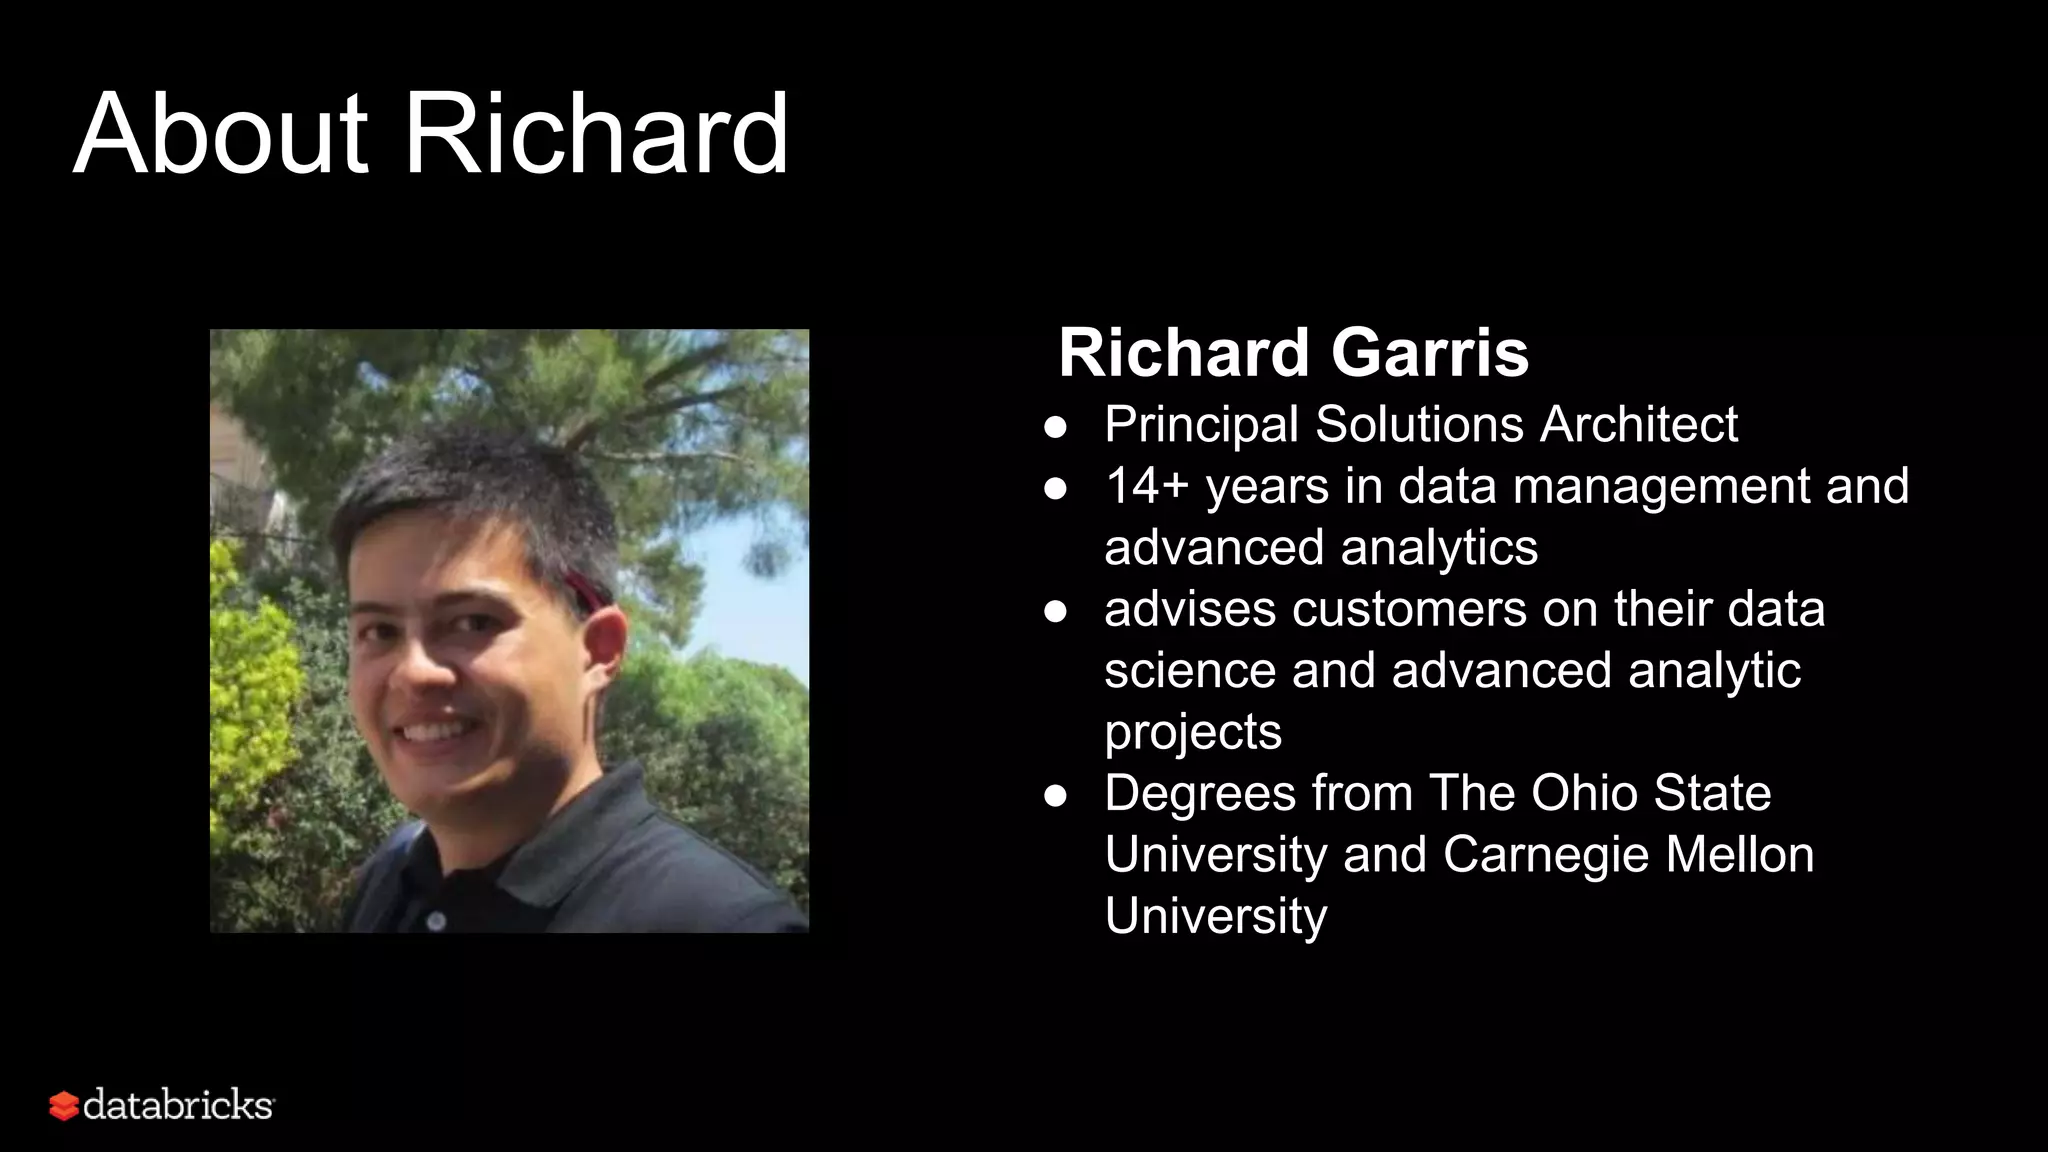
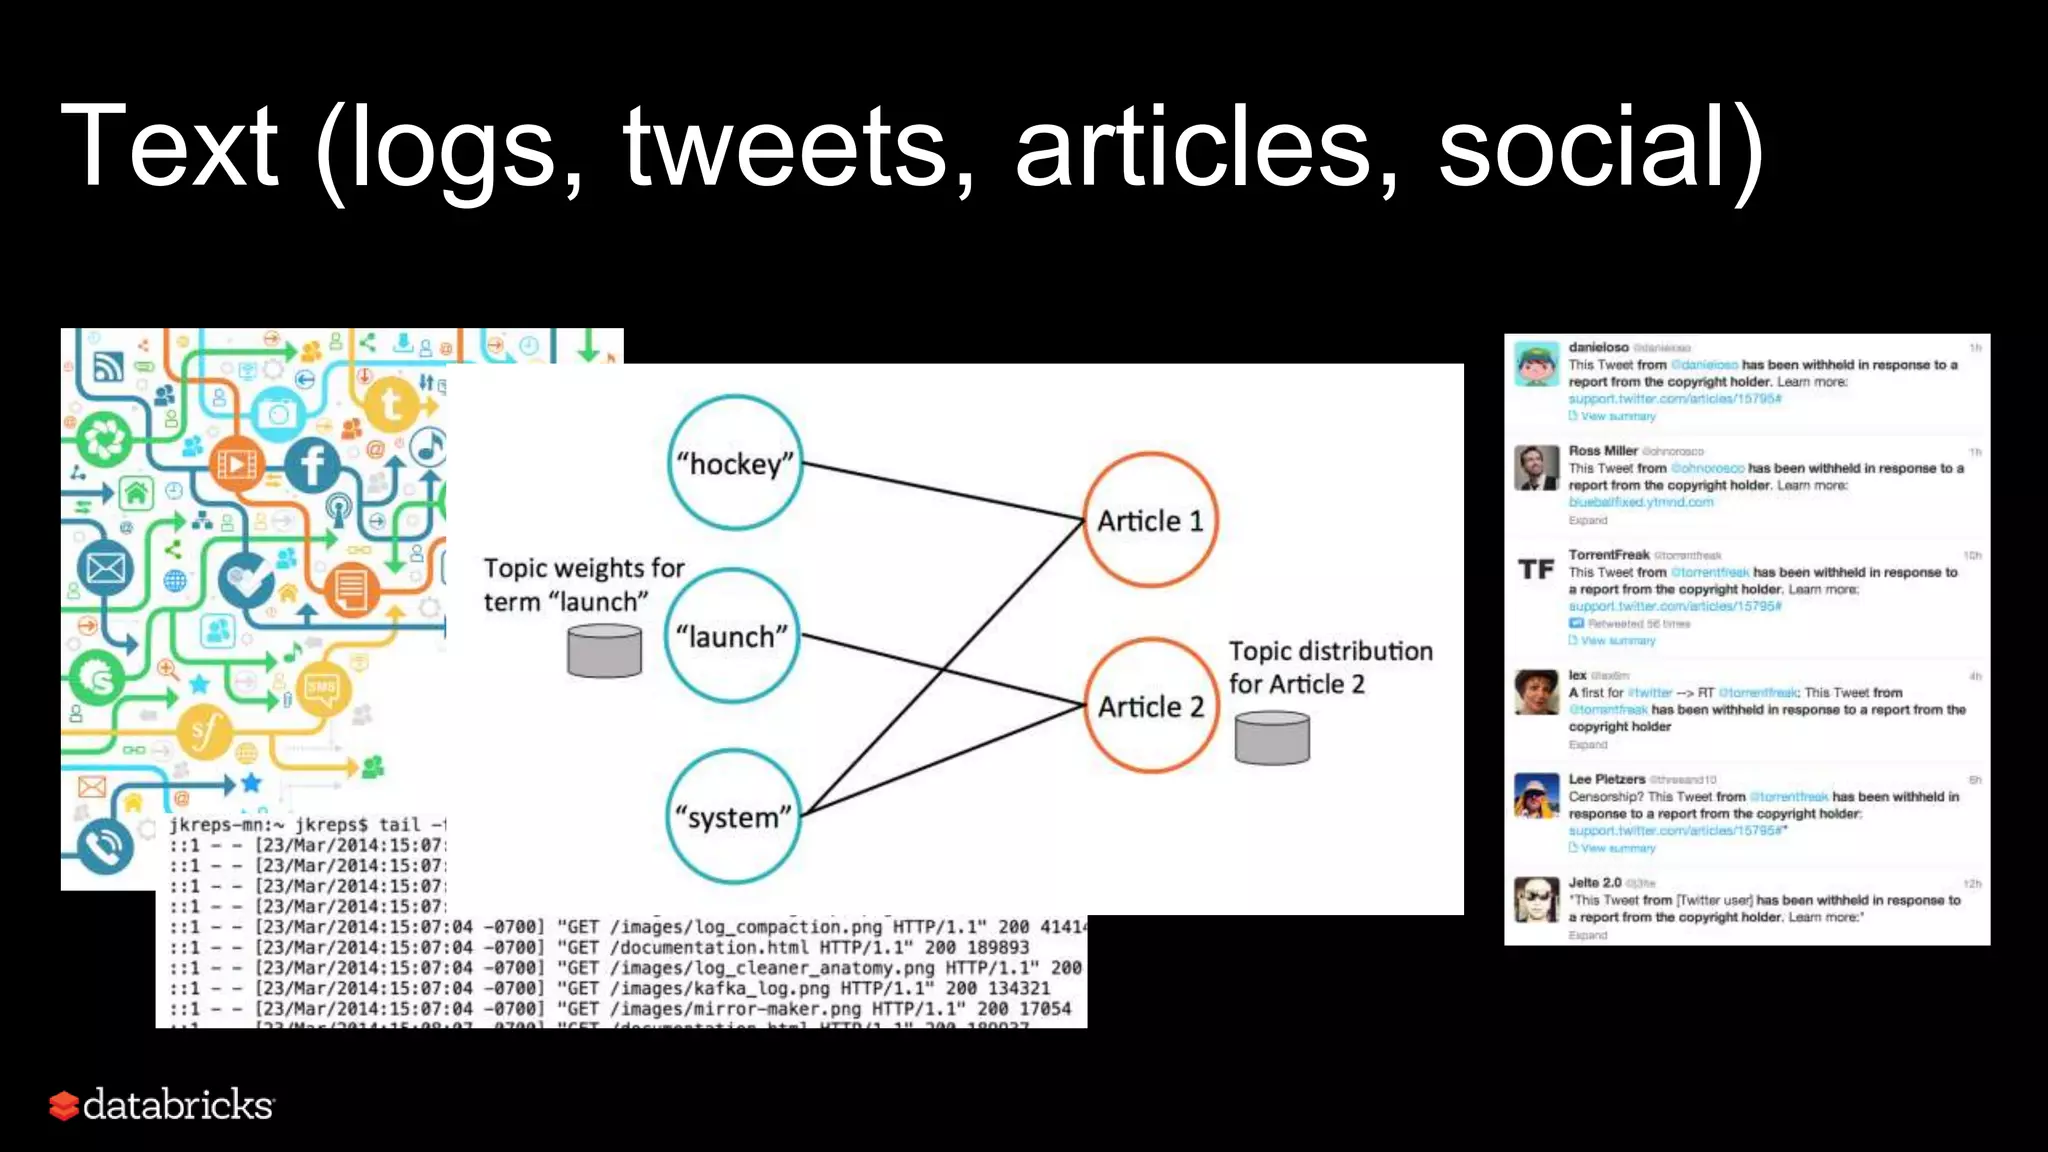
This document discusses developing analytics applications using machine learning on Azure Databricks and Apache Spark. It begins with an introduction to Richard Garris and the agenda. It then covers the data science lifecycle including data ingestion, understanding, modeling, and integrating models into applications. Finally, it demonstrates end-to-end examples of predicting power output, scoring leads, and predicting ratings from reviews.


![Vibe Coding vs. Spec-Driven Development [Free Meetup]](https://cdn.slidesharecdn.com/ss_thumbnails/vibecodingvsspecdrivendevelopment-251209105622-43f455e7-thumbnail.jpg?width=640&height=640&fit=bounds)


