What is Social Media?Positive Effects/Advantages of Social Media,Negative effects/Disadvantages of Social Media,True research facts,Threats from Social Media,Prevention,Conclusion and Implication
For more information , visit : http://www.computercareer.in/projects-by-cc/
Are Social Networking more persuasive than Traditional Word of MouthKUMAR GAURAV
In the present scenario of 21st century when every thing is changing so fast traditional things are losing its importance. This research is conducted to investigate and compare the reliability of recommendation made through social networking and traditional word of mouth.
Hypothesis-
H1- WOM and social networking influence the customer
purchase decision.
H2- Social networking recommendation are more reliable
than traditional WOM.
Major findings are-
-Consumers awareness towards Social Networking and traditional WOM is high.
-Social Network Marketing is more reliable that traditional WOM.
Suggestions-
-Companies should try to promote positive word about their products through social networking and WOM because traditional advertising id losing its effectiveness and due to increased consumerism.
-Companies should to use social networking efficiently to increase their market share because it is not only cost effective but reliable too.
-Quality should be maintained because consumer believe that spreading positive WOM and social networking is difficult because they are not controlled by the marketers and its possible only when product quality is good.
Christina Zarcadoolas - Leapfrogging: What Social Media Is Doing for Communic...Plain Talk 2015
"Leapfrogging: What Social Media Is Doing for Communicative Competence" was presented at the Center for Health Literacy Conference 2011: Plain Talk in Complex Times by Christina Zarcadoolas, PhD, Professor, CUNY School of Public Health at Hunter College.
Description: This presenter will discuss how social media and mobile technologies are helping minorities leapfrog the digital divide and what implications this has for communicating health information and advancing public health literacy.
Damásio et al, 'Mobile Devices as drivers of Social Capital' at Communities i...Agnes Gulyas
Manuel José Damásio, Patrícia Dias, Sara Henriques and Inês Teixeira-Botelho, CICANT and Universidade Lusófona de Humanidades e Tecnologias, Portugal, ‘Mobile Devices as drivers of Social Capital: How can apps’ change communication dynamics within a community’ presented at 'Communities in the Digital Age' International Symposium, Canterbury Christ Church University, UK, 12 June 2013
Research on Socially Enabled TV Advertisingsarah_cui
How many digital devices do you have? According to the 2014 Nielsen Digital Consumer Report, Americans now own four digital devices on average, and the average U.S. consumer spends 60 hours a week consuming content across devices. The proliferation of digital devices and platforms contributes to the media revolution and blurring traditional media definitions.
As a result, consumers’ media habits are changing. Nowadays, watching TV while simultaneously using a smartphone, laptop or tablet is on the verge of becoming a majority behavior worldwide. A survey of 55,000 people by the research consultancy TNS shows that 56% of Americans engage in another digital activity when they are watching TV. The rapid adoption of a second screen has transformed the traditional TV watching experience. Instead of only watching TV, audiences now are enhancing their viewing experience by actively surfing the Web, engaging with social networks and shopping online while they are watching TV. Especially, this “multitasking” behavior is fostering a surge of real-time social media conversation between friends, fans and online communities.
Facing this new trend of media usage, advertisers want to introduce socially enabled TV advertising to communicate with their target audiences. In this way, audiences could be actively interacting with ads and co-creating advertising content. To get a better understanding of how audiences think about this new form of advertising, we conducted indepth interviews in this research.
The first part of this report closely examines audiences’ TV watching behaviors, social media uses and the ways that they engage with media. Then we give our analysis of primary data in detail and provide three key findings: Bonding Facilitator, Reciprocal Interaction and Hashtag Marketing. Finally, our recommendations will be offered about what could be done to further improve the engagement and the effectiveness of socially enabled TV advertising.
Web 20 (Social Media) Policies in Higher EducationAnne Arendt
This paper summarizes the social media and Web 2.0 field in regard to policies from the perspective of a Web resource director. The paper is 50 pages and was created specifically for the Best Practices in Policy Management Conference sponsored by the UVU Policy Office on November 6, 2009.
View the 'official' report at http://works.bepress.com/anne_arendt/7/
The increasing role of social media has been recognized as an increasingly effective marketing tool for a broad section of enterprises. This paper highlights the first stage of the engagement strategy using social media for an academic laboratory, and provides an insight for others wishing to take advantage of the various social networking tools that are available. The lab engages with different constituencies such as students, faculty, and alumni, industrial and governmental agencies. As these constituents online presence is fragmented over a number of different social websites (Twitter™, LinkedIn™ for example), there is no longer an effective single point of contact to engage them. With that in mind, researchers in the lab created accounts on, and started using Twitter™, LinkedIn™ and SlideShare™. Data about site referrals to the BSPA Laboratory’s homepage was gathered using Google Analytics™, in order to analyze the effects (if any) that social networks might have in promotional activities and increased interaction with the BSPA Laboratory home page (http://www.bspalabs.org/). Although this paper is a preliminary report on a short term progress, the data shows the differences in unique visitors before and after becoming active in social networks and will show data linking specific social network with an effect.
Extent of social media usage by students for improved learning in Tertiary In...iosrjce
This study was carried out to ascertain the perception of students on the use of social media for
educational purposes. It was conducted in three tertiary institutions in Rivers State. The sample comprised 200
respondents randomly selected from three tertiary institutions in Rivers State. Five research objectives and four
null hypotheses were used for the study. Mean scores, ANOVA, multiple comparison test using schaffer model,
and Correlational Analysis were the statistical tools used in the study. The study found that social media is used
in the study. The study found that social is used for educational purposes in terms of communication, sharing
and exchanging ideas with improved engagement with technology. The study also revealed that social media is
frequently used for interactions with friends for classroom assignment, communication in and outside
classroom, promoting interactions during lectures, promoting informal learning, enhance course grades,
facilitating language exchange, video conferencing, creating room for educational and video sharing. In terms
of attitude of students, respondents generally have favourable attitude towards use of social media. The study
revealed significant differences exist in social media usage across the three universities involved in the study
and significant differences exist in usage of social media between male and female respondents; and in attitude
of students towards social media. Based on these findings, the study recommend that the use of social media
should be incorporated into the curriculum for enhanced universities education.
Impact of social branding on purchase intention: An empirical study of social...Sparkles Soft
Impact of social branding on purchase intention: An empirical study of social media websites.
Writer
Jahanzeb Khan
SPARKLES SOFT
www.sparklessoft.com
MobileWhatsApp/Viber: 00923004604250
00923124604250
Skype sparkles.soft
Vonage/Viber 00923004604250
thesis help, uk dissertation help, custom thesis writing in uk, uk mba thesis,
In the comprehensive digital statistics report covering social media and internet by Slideshare in January of 2015, the following are described. Facebook is the number one among popular social media networks according to active user statistics. User numbers determined by up-to-date researches in 2015 are giving statistics of Turkey and World social media and internet use as follows: Internet users among world population (7.095.476.818) are 2.484.915.152 (35%) while active social networking users are 1.856.680.860 (26%). Facebook with the most active users (1.184M) among social platforms is followed by Qzone (632M), Google plus (300M) and Linkedin (259M) respectively. In Turkey, the most used social media platforms are Facebook (93%), Twitter (72%), Google plus (70%) and Linkedin (33%). With a population of 80.694.485, Turkey’s internet users are numbered 35.990.932 while active number of Facebook users are 36.000.000. As Turkish users, an average of 4 hours 37 minutes is spent in internet and 2 hours 56 minutes of this duration is spent in social media.
International Journal of Humanities and Social Science Invention (IJHSSI) is an international journal intended for professionals and researchers in all fields of Humanities and Social Science. IJHSSI publishes research articles and reviews within the whole field Humanities and Social Science, new teaching methods, assessment, validation and the impact of new technologies and it will continue to provide information on the latest trends and developments in this ever-expanding subject. The publications of papers are selected through double peer reviewed to ensure originality, relevance, and readability. The articles published in our journal can be accessed online.
Literature Review of Information Behaviour on Social MediaDavid Thompson
Using your knowledge about information resource and skills in searching and evaluating information achieved in the first half of the semester, now you are required to choose a specific topic in the area of information research, explore the exisiting literature within this domain and write a literature review.
Reader-to-Leader Framework is designed to help researchers, designers, and managers understand what motivates technology-mediated social participation. This will enable them to improve interface design and social support for their companies, government agencies, and non-governmental organizations.
Corporate Communication & Social Media: A study of its usage patterninventionjournals
Social media helps corporate communication professionals to build and maintain relationships with
all the publics. Nowadays a company’s reputation also depends on the image built by the company in social
media. This study aims to examine; on how corporate communication professionals use social media for
corporate communications. The data for the study was collected from 125 corporate communication
professionals across Bengaluru city through a scientific survey method and sampling procedures. The research
study found that Facebook, Twitter and LinkedIn were extensively used for corporate communication. The most
popular uses of social media for corporate communications were employee communication, customer/consumer
relations, relationship with general public and media relations. Majority of the messages shared on social
media were pertaining to events organised by the company, achievements, news, promotional messages and
corporate social responsibility. Social media is the future; hence, corporate communication and PR
professionals should exploit this media for all their corporate communication uses, needs and campaigns
Abstract
Over the last decade, the way people communicate with each other has been changing astonishingly. The
extensive new plethora of media has given to customers more options to gather and provide information
about products and services. This study attempted to identify and measure the degree to which Social
Networking Sites influence people's professional lives, their social skills and work productivity and
ultimately boost effectiveness. Quantitative and qualitative methodologies were used for this research.
The results reveal that Social Networking Sites play an essential role in employees‟ relations with
customers, that Instant Messaging (IM) services offered by Social Networking Sites can be a crucial
element for organizations in disseminating information, enabling knowledge sharing, increasing
productivity and promoting teamwork. It seems that customer engagement and Customer Relationship
Management (CRM) are vital tools for organizational effectiveness, not only to maintain loyal clients but
also to survive and keep maintaining profitability.
Keywords: Social Media, Social Commerce, Social Networking, CRM, Instant Messaging (IM), Web
2.0, Facebook, Instagram, Linked In, Twitter, Marketing, Social Media Marketing, Cyprus.
Usage of YouTube Content among Chennai Urban Women.pdfPugalendhiR
Abstract: The majority of YouTube users are college students, therefore it's critical to understand their usage patterns,
goals, and any potential psychological and behavioural effects. In order to determine the current trends in YouTube usage
among female undergraduate students in Chennai City, this study will examine the devices used, memberships subscribed
to, purposes used, and identity formation time spent networking, negative impacts experienced, and educational usage.
Data from a survey were analysed with SPSS-Statistic 19.0 software, and the findings were compared to the examined
literature. According to the survey, students' YouTube networking habits will eventually win out over parents' and
teachers' attitudes, and although while cell phones are currently prohibited in many college buildings, they will
undoubtedly be utilised in classrooms in the near future. The discoveries provide the current study in this area more depth.
Comprehensive Social Media Security Analysis & XKeyscore Espionage TechnologyCSCJournals
Social networks can offer many services to the users for sharing activities events and their ideas. Many attacks can happened to the social networking websites due to trust that have been given by the users. Cyber threats are discussed in this paper. We study the types of cyber threats, classify them and give some suggestions to protect social networking websites of variety of attacks. Moreover, we gave some antithreats strategies with future trends.
The findings of this research study (purchase on Amazon.com) examines the impact social media has on consumers and decision-makers around the world and characterizes the impact of social influence models. The Social Mind research explores the best practices of using social business as a platform to strengthen sustainable methods for working and living in new, interactive and collaborative business world. It identifies key characteristics and insights into the engagement behaviors of influencers and individuals, and how organizations can maximize reach and influence to execute on what we call the new Principals of Engagement in the Millennium.
Social business is dynamically changing the face of human interaction and communications globally. The emergence of new social behaviors and interrelationships between individuals, organizations, thought leaders and influencers are evolving in new and previously unforeseen ways primarily because of social media networks and peer groups.
A disruption is in the making, but this time, human behavior is the driver, not technology. People want and need to get the information they need at the time they desire it, especially from those they consider to be experts. We are returning to the “apple cart” of yesteryear. However, this time around we are armed with digital devices to extend our global ability to talk with the companies and people who inform our decisions.
This paradigm shift is a major communications innovation in all markets, which is radically changing the way people and organizations engage and behave online. There is also a strong link between social networking and what might be called “a new global anthropology” that is developing because of these new behaviors, interactions and interrelationships between cultures enabled through social business.
Over the past three years Vanessa DiMauro, Peter Auditore and myself, all Society for New Communications Research fellows, have embarked on a series of research studies to understand this new and evolving business platform and its impact on social communications and influence.
Encryption in Microsoft 365 - ExpertsLive Netherlands 2024Albert Hoitingh
In this session I delve into the encryption technology used in Microsoft 365 and Microsoft Purview. Including the concepts of Customer Key and Double Key Encryption.
Connector Corner: Automate dynamic content and events by pushing a buttonDianaGray10
Here is something new! In our next Connector Corner webinar, we will demonstrate how you can use a single workflow to:
Create a campaign using Mailchimp with merge tags/fields
Send an interactive Slack channel message (using buttons)
Have the message received by managers and peers along with a test email for review
But there’s more:
In a second workflow supporting the same use case, you’ll see:
Your campaign sent to target colleagues for approval
If the “Approve” button is clicked, a Jira/Zendesk ticket is created for the marketing design team
But—if the “Reject” button is pushed, colleagues will be alerted via Slack message
Join us to learn more about this new, human-in-the-loop capability, brought to you by Integration Service connectors.
And...
Speakers:
Akshay Agnihotri, Product Manager
Charlie Greenberg, Host
GraphRAG is All You need? LLM & Knowledge GraphGuy Korland
Guy Korland, CEO and Co-founder of FalkorDB, will review two articles on the integration of language models with knowledge graphs.
1. Unifying Large Language Models and Knowledge Graphs: A Roadmap.
https://arxiv.org/abs/2306.08302
2. Microsoft Research's GraphRAG paper and a review paper on various uses of knowledge graphs:
https://www.microsoft.com/en-us/research/blog/graphrag-unlocking-llm-discovery-on-narrative-private-data/
Builder.ai Founder Sachin Dev Duggal's Strategic Approach to Create an Innova...Ramesh Iyer
In today's fast-changing business world, Companies that adapt and embrace new ideas often need help to keep up with the competition. However, fostering a culture of innovation takes much work. It takes vision, leadership and willingness to take risks in the right proportion. Sachin Dev Duggal, co-founder of Builder.ai, has perfected the art of this balance, creating a company culture where creativity and growth are nurtured at each stage.
The Art of the Pitch: WordPress Relationships and SalesLaura Byrne
Clients don’t know what they don’t know. What web solutions are right for them? How does WordPress come into the picture? How do you make sure you understand scope and timeline? What do you do if sometime changes?
All these questions and more will be explored as we talk about matching clients’ needs with what your agency offers without pulling teeth or pulling your hair out. Practical tips, and strategies for successful relationship building that leads to closing the deal.
Smart TV Buyer Insights Survey 2024 by 91mobiles.pdf91mobiles
91mobiles recently conducted a Smart TV Buyer Insights Survey in which we asked over 3,000 respondents about the TV they own, aspects they look at on a new TV, and their TV buying preferences.
Epistemic Interaction - tuning interfaces to provide information for AI supportAlan Dix
Paper presented at SYNERGY workshop at AVI 2024, Genoa, Italy. 3rd June 2024
https://alandix.com/academic/papers/synergy2024-epistemic/
As machine learning integrates deeper into human-computer interactions, the concept of epistemic interaction emerges, aiming to refine these interactions to enhance system adaptability. This approach encourages minor, intentional adjustments in user behaviour to enrich the data available for system learning. This paper introduces epistemic interaction within the context of human-system communication, illustrating how deliberate interaction design can improve system understanding and adaptation. Through concrete examples, we demonstrate the potential of epistemic interaction to significantly advance human-computer interaction by leveraging intuitive human communication strategies to inform system design and functionality, offering a novel pathway for enriching user-system engagements.
UiPath Test Automation using UiPath Test Suite series, part 3DianaGray10
Welcome to UiPath Test Automation using UiPath Test Suite series part 3. In this session, we will cover desktop automation along with UI automation.
Topics covered:
UI automation Introduction,
UI automation Sample
Desktop automation flow
Pradeep Chinnala, Senior Consultant Automation Developer @WonderBotz and UiPath MVP
Deepak Rai, Automation Practice Lead, Boundaryless Group and UiPath MVP
Securing your Kubernetes cluster_ a step-by-step guide to success !KatiaHIMEUR1
Today, after several years of existence, an extremely active community and an ultra-dynamic ecosystem, Kubernetes has established itself as the de facto standard in container orchestration. Thanks to a wide range of managed services, it has never been so easy to set up a ready-to-use Kubernetes cluster.
However, this ease of use means that the subject of security in Kubernetes is often left for later, or even neglected. This exposes companies to significant risks.
In this talk, I'll show you step-by-step how to secure your Kubernetes cluster for greater peace of mind and reliability.
UiPath Test Automation using UiPath Test Suite series, part 4DianaGray10
Welcome to UiPath Test Automation using UiPath Test Suite series part 4. In this session, we will cover Test Manager overview along with SAP heatmap.
The UiPath Test Manager overview with SAP heatmap webinar offers a concise yet comprehensive exploration of the role of a Test Manager within SAP environments, coupled with the utilization of heatmaps for effective testing strategies.
Participants will gain insights into the responsibilities, challenges, and best practices associated with test management in SAP projects. Additionally, the webinar delves into the significance of heatmaps as a visual aid for identifying testing priorities, areas of risk, and resource allocation within SAP landscapes. Through this session, attendees can expect to enhance their understanding of test management principles while learning practical approaches to optimize testing processes in SAP environments using heatmap visualization techniques
What will you get from this session?
1. Insights into SAP testing best practices
2. Heatmap utilization for testing
3. Optimization of testing processes
4. Demo
Topics covered:
Execution from the test manager
Orchestrator execution result
Defect reporting
SAP heatmap example with demo
Speaker:
Deepak Rai, Automation Practice Lead, Boundaryless Group and UiPath MVP
1. IOSR Journal of Computer Engineering (IOSR-JCE)
e-ISSN: 2278-0661,p-ISSN: 2278-8727, Volume 18, Issue 1, Ver. IV (Jan – Feb. 2016), PP 44-50
www.iosrjournals.org
DOI: 10.9790/0661-18144450 www.iosrjournals.org 44 | Page
Utilization of Weight Allocation in Tf-Idf Environment for Noise
Detection Enhancement
Evelyne Chanya Shuma1
, Prof. Waweru Mwangi2
, Dr. Michael Kimwele3
1
( School of Computing and IT, Jomo Kenyatta University of Agriculture and Technology, Kenya)
2
( School of Computing and IT, Jomo Kenyatta University of Agriculture and Technology, Kenya)
3
( School of Computing and IT, Jomo Kenyatta University of Agriculture and Technology, Kenya)
Abstract: Social media data mining has gained significance in the recent past. This owes to the importance of
establishing hidden patterns in the social media data that can be used in digital marketing strategies. It helps
the marketers to segment customers according to their demographics and behavioral characteristics such that it
becomes easier to target these customer segments with advertisement messages suitable for their cluster. As
such, it becomes paramount to discover and eliminate any data that may not influence customer buying trends.
This constitutes noise removal. Weight allocation then becomes crucial in identifying keywords from social
media data that can help in the clustering process. In this paper, weight allocation was applied in a term
frequency-inverse document frequency (TF-IDF) environment to recognize noisy data and remove it before the
social media data can be exposed to further analysis. In this approach, a word that appears more frequently in a
given document but rarely in the whole document collection was given a higher weight than that word that
appears virtually in all documents.
Keywords: Weight allocation, Algorithm, term frequency, document frequency, TF-IDF, mySQL, data mining
I. Introduction
The Internet has changed the world in which we sell. It reaches beyond being a new channel for
marketing and offers a new paradigm for the way consumers connect with brands and with each other. Online
Social Networks which began in the form of generalized online communities that focused on bringing people
together to interact with each other have now become an avenue for marketers to look for customers. The
rapidly expanding social network audiences in the emerging markets will be huge drivers of social user growth.
Changes affecting traditional marketing have been seen where people now spend less time watching TV and
reading print newspapers each day and instead communicate through the use of mobile phones, watch videos on
YouTube, read the newspaper online, look at photos in Flickr and exchange information through social
networks. This transition has forced businesses to find alternative affordable ways to reach customers. The big
question for marketers is how to convert users of Online Social Networks to customers.
The utilization of social networks has grown radically over the recent past. This has been as a result of
users reaching out to friends, new acquaintances and businesses. Curran & Lennon (2011) developed a model
that could help demonstrate how antecedent beliefs influence a user’s attitude toward a social network and how
those feelings influence the user’s intentions to engage in different social networking behaviors. The social
media users range from tech-savvy young adults to baby boomers and older adults seeking ways to reconnect
with family and friends (Anderson, 2009).
According to Ito et al., (2008), modern college students have grown up with video games and social
networking. These students fancy to be connected at all times to their friends and family through texting, instant
messaging, mobile phones and Facebook. Protalinski (2012) noted that popular examples of social networking
sites include Twitter and Facebook. In December, 2011, Facebook surpassed having 845 Million users
worldwide. Therefore, these sites provide a rich marketing platform if only the various users could be targeted
with suitable advertisement messages.
With the rise of social media, the web has become a vibrant and lively Social Media realm in which
billions of individuals all around the globe interact, share, post, and conduct numerous daily activities. Social
media enables us to be connected and interact with each other anywhere and anytime – allowing us to observe
human behavior in an unprecedented scale with a new lens. This social media lens provides us with golden
opportunities to understand individuals at scale and to mine human behavioral patterns otherwise impossible. As
a by-product, by understanding individuals better, we can design better computing systems tailored to
individuals’ needs that will serve them and society better (Zafarani et al, 2014).
Blackwell et. al., (2006) define behavioral variables as those constructs that give descriptions of
individuals, groups, or organizations and the method they utilize to pick, secure, employ, and dispose of
products, services, experiences, or ideas to satisfy desires and the impacts that these methods have on the
2. Utilization Of Weight Allocation In Tf-Idf Environment For Noise Detection Enhancement
DOI: 10.9790/0661-18144450 www.iosrjournals.org 45 | Page
consumer and society. On the other hand, demographics cover the entire general public, or groups defined by
criteria such as education, nationality, religion and ethnicity (Perreau, 2015).
Individual online behaviour can be categorised into three: User-user behaviour. This is the behaviour
individuals exhibit with respect to other individuals for example befriending someone, sending a message,
playing games, following, inviting or chatting. User-Community behaviour. The target of this type of behaviour
is a community for example joining or leaving a community, becoming a fan of a community or participating in
its discussions. User-Entity Behavior. The target of this behaviour is an entity in social media. For instance it
includes writing a blogpost or review or uploading a photo to a social media site (Zafani et al, 2014).
With the rise of social media, information sharing has been democratized. As a result, users are given
opportunities to exhibit different behaviors such as sharing, posting, liking, commenting, and befriending
conveniently and on a daily basis. By analyzing behaviors observed on social media, we can categorize these
behaviors into individual and collective behavior. Individual behavior is exhibited by a single user, whereas
collective behavior is observed when a group of users behave together. For instance, users using the same
hashtag on Twitter or migrating to another social media site are examples of collective behavior. User activities
on social media generate behavioral data, which is massive, expansive, and indicative of user preferences,
interests, opinions, and relationships. This behavioral data provides a new lens through which we can observe
and analyze individual and collective behaviors of users (Zafarani, Liu 2014)
With more than 1.5 billion users worldwide, social media offers a treasure trove of information in the
form of real-time, interactive communications made available through blogs, tweets, updates, images and
videos. Not surprisingly, organizations are growing more and more reliant on social media to understand and
work more responsively with employees, vendors and customers, and better gauge the competition. However,
mining and analyzing the huge volumes of unstructured data generated by social media is no easy task (Kumar
et al, 2013).
Individuals can use mobile devices, desktop computers, and/or notebooks as the access method to reach
the social networking sites, as these information and communication technologies have become necessary tools
to engage in content creation and information sharing. The usage patterns of the various access methods can
potentially have an impact on the usage behavior and information sharing of the various social networking sites.
For example, if users believe that mobile devices are complicated, they will be less likely to use those devices
(Wakefield and Whitten, 2006). Yet, if firms simplify the operations of new applications and ensure that a
significant number of users have that access method, such as Smartphones or iPads, the value and use of that
access method increase substantially (Wang, Lo, and Fang, 2008). It was not within the scope of this study to
determine the devices used to access social media and whether these devices determined the behavior exhibited
by the users on the social media sites.
According to an Experian Marketing Services study, U.S. consumers spend 27% of their total Internet
time on social networking sites and forums. Facebook has more than 1.1 billion active users. Twitter, on
average, records 58 million tweets every day. These statistics, combined with the millions of blog posts on the
Internet and discussions that occur by the minute on forums and social networking sites, for example, can
provide a rich and growing pool of data on market trends and such things as consumer interests and perceptions.
Still, data is one thing; analysing it successfully to gain useful insights is quite another (Kumar et al, 2013).
Social Media Mining is the process of representing, analyzing, and extracting actionable patterns from social
media data. Social media mining is an emerging field where there are more problems than ready solutions. For
effective social media mining, we collect information about individuals and entities, measure their interactions,
and discover patterns to understand human behaviour. Mining social media data is the task of mining user-
generated content with social relations. This data presents novel challenges encountered in social media mining.
New challenge for mining social media data has been identified as noise removal fallacy (Zafarani et al, 2014).
Noise removal fallacy is that by its nature, social media data can contain a large portion of noisy data and the
definition of noise becomes complicated and relative because it is dependent on our task at hand. In classic data
mining literature, a successful data Noise Removal Fallacy mining exercise entails extensive data pre-processing
and noise removal as “garbage in and garbage out (Zafarani et al, 2014).
A recent study conducted by Razorfish and Adobe reveals that the majority of marketers lack the
ability to tackle behavioral data. Although more and more companies have realized the importance of using data
to target consumers and deliver real-time experiences today, 76 percent of marketers have failed to use
behavioral data in segmentation analysis and targeting execution, according to The State of Always-On
Marketing Study. "There's no doubt that digital marketers have access to behavioral data, and there's been
considerable talk and investment these last few years on 'big data,' and an executive focus on data and analytics.
But many businesses are struggling to translate this data with the right technology and skills into better data-led
customer-facing experiences," says Mark Taylor, vice president of analytics at Razorfish, and author of the
study.” (Yuyu Chen, 2014).
3. Utilization Of Weight Allocation In Tf-Idf Environment For Noise Detection Enhancement
DOI: 10.9790/0661-18144450 www.iosrjournals.org 46 | Page
The challenge of unstructured data. According to Gartner, 80% of enterprise data documents, e-mails,
call logs, corporate blogs and the like – is unstructured (i.e., it does not fit into any traditional database). The
proliferating use of social media data (including tweets and comments in colloquial style, images, videos, blog
posts, etc.) is exponentially increasing the amount of unstructured data to be sorted, analysed and used to gain
meaningful insights. Yet most organizations do not have the resources or tools needed to sift through and
interpret the vast quantities of social media data they have at their disposal without making considerable
changes to their IT infrastructure, operational processes and organizational structure (Kumar et al, 2013).
Due to its increasing significance and quickly evolving nature, social networking research provides
both scholars and practitioners with the prospect of better appreciating and leveraging the merits of online
behavior. As such, it has become the most vital constituent of the marketer's toolkit in the foreseeable future.
This research paper sought to collect data from social media networks, remove noisy data from these
data through the application of weight allocation in a term frequency-inverse document frequency (TF-IDF)
environment. The ultimate goal was to eliminate those demographics constructs that do not directly influence
users’ online behaviors. The remaining variables were then proposed to be vital for the design of a digital
marketing framework in social media networks. The target population was the facebook’s Soko Kuu and Soko
Nyeusi users. The data was collected using tally sheets and fed into mySQL database. The algorithm was
designed that could establish the words’ term frequency and document frequency and output the TF-IDF values
for each word. The words that had comparatively low TF-IDF values were regarded as noise and this formed the
basis for their elimination. This paper delimited itself to user demographics data that may influence customer
buying trends. A target population of 155 was employed and TF-IDF values were employed as a basis for noise
elimination.
Social Media Demographics Oriented Behavior
Curran and Lennon (2011) investigated the direct effects of beliefs to the users' attitudes toward social
networks. They also tested whether beliefs indirectly or directly affected users' intentions to continue using
social networks, recommend social networks, join other social networks, and stop using social networks.
Although demographic data were collected for all participants in the study, the tested models did not
put into consideration the possible differences in behaviors among demographic groups. In their study, Lennon
et. al.,(2015) added to the understanding of the Curran & Lennon model by examining whether demographic
variables are associated with differences in antecedent beliefs, attitudes toward social networks, and reasons for
choosing and using specific social networks. Their findings demonstrated that peoples' antecedent beliefs and
attitudes towards social networks differ based on gender, age, marital status and parenthood. In addition, they
found the differences in the reasons for choosing and using specific networks among demographic groups.
Specifically, they noted that females are more prone than males to believe that social networking is
enjoyable. Also, males are more likely than females to engage in social networking due to social influences.
Secondly, participants under 30 are more likely to use social media networks than those over 30 since they view
them as being easy to use. For the same reasons, participants without children are more likely to utilize social
media than those with children.
This study adds to the existing body of knowledge by identifying those demographics constructs that
are noisy to the extent that if allowed in further market strategical targeting, they would interfere with this
analysis. Therefore, they should be eliminated in order to provide a clear behavioral picture of the online users.
This would enable the various groups of online users to be targeted with appropriate advertisement messages.
Social Media Behavioral Data
Tally sheets were employed to collect data from social media sites, namely Soko Kuu and Soko
Nyeusi . The users’ demographics were collected from their respective facebook profiles. It was then stratified
as shown in Table 1 that follows.
Table 1: Demographical Stratification
Latent-Demographics Measures LatentDemographics Measures
Physical Address City Religion Christian
Town Muslim
Market Other
Gender Male Politics Active
Female Inactive
Age Youth Marital Status Single
Adult Married
Interests Academics Leisure/Hobbies Entertainment
Business Events
Socializing
Work Employed Education Level Student
4. Utilization Of Weight Allocation In Tf-Idf Environment For Noise Detection Enhancement
DOI: 10.9790/0661-18144450 www.iosrjournals.org 47 | Page
Unemployed High School
Groups Yes College
No University
Groups Yes Nationality Kenyan
No Foreign
Table 1 demonstrates the fact that various demographics were collected using different measures.
However, it is important to note that not all demographics affect all the customers in all buying circumstances.
Therefore, there was need to group customers according to their buying trends based on their motivating factors.
Nine (9) goods/services listed in Table 2 were employed for this purpose due to their frequency of adverts in the
target social media sites.
Table 2: Goods/Services Stratification
S/No Goods/Service
1 Automobile
2 Clothing
3 Furniture
4 Flowers
5 Beauty services
6 Mobile phones
7 Computers
8 Entertainment electronics
9 Kitchenware
Procedure
a) The nine goods/services that were identified above were treated as categories in this study. The measures for
the various demographics and behavioral variables were treated as key words.
b) The data related to various Soko Kuu and Soko Nyeusi members who liked, inquired or bought the advertized
goods/services were treated as documents.
c) The keywords were chosen such that each of them contained a unique combination of characters that were
distinct from the rest of the keywords. This was important because the developed algorithm used pattern
matching and wildcards to compute the term frequency (TF), the inverse document frequency (IDF) and
finally the term frequency–inverse document frequency (TF-IDF).
As an illustration, we consider the keywords: employed and unemployed. We note that ‘Unemployed’ contain
the pattern ‘employed’ in it. Therefore pattern matching and wildcards in the TF-IDF algorithm will give
wrong values for these two keywords. This is because the TF for the pattern ‘employed’ will include the TF
in the keyword ‘Unemployed’.
To address this challenge, a synonym for the word ‘Unemployed’ was utilized. This was the keyword
‘jobless’. This was done for the all the other keywords.
d) The documents in (C ) above were fed to a Mysql database from which data mining could be done via TF-
IDF algorithms designed using the PhP programming language.
e) The PhP interfaces were designed to cater for each latent variable and its measures. The text boxes were
used to fetch Mysql data, compute the TF, IDF and TF-IDF and display them. Fig. 1 that follows gives an
example of these interfaces.
The keywords (measures in this case) were assigned a weight that expressed their importance for a
particular document. This involved assigning a high weight to a term that occurred frequently in the document
but rarely in the whole document collection. This meant that keywords that appeared in nearly all documents
were given a low weight.
In this study, any unwanted data was regarded as noise. To identify this noise, term frequency-inverse
document frequency (TF-IDF) was employed. The relationship that was used to calculate TF-IDF for specific
terms in documents is given by equation 1.
IDF=Log 10 [N/df]………………………………………………………. (1)
Where IDF=Inverse document frequency
N= the total number of documents
df= document frequency
To find the TF-IDF of a given word in a document, equation (1) above is multiplied by the term
frequency (TF) of that word as illustrated in equation 2.
TF-IDF=TF*IDF……………………………………………..…………. (2)
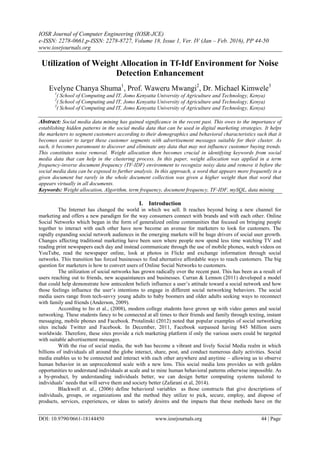
II. Results And Discussions
The study findings that were obtained constituted of the term frequency (TF) values, the inverse
document frequency (IDF) and the term frequency-inverse document frequency (TF-IDF) as shown in Fig. 1.
5. Utilization Of Weight Allocation In Tf-Idf Environment For Noise Detection Enhancement
DOI: 10.9790/0661-18144450 www.iosrjournals.org 48 | Page
Fig. 1 presents data on the calculated IDF depending on the TF of specific words in the entire documents. As
shown, the document of interest in this case is auto-mobile, although other documents could still be used and
yield similar results. We are concerned with the calculation of IDF and TF-IDF of the physical address, City.
Fig. 1 demonstrate that the term City appears 16 times in document automobile (TF=16). Note that the total
number of document, N in this case is equal to the total population, which was 155(that is, N=155). With this
information, our first task is to prove the value of the computed IDF. This is done as follows.
IDF=Log 10[N/df]
Where N=155
df=16
IDF=Log 10[155/16]
= Log 10[9.6875]
=0.9862
figure 1: tf-idf computations
The calculation of IDF for the rest of the words followed a similar format. To illustrate how noise
removal was accomplished, we consider measurable variables, physical address, age, nationality, work and
group membership. The choice of these measures is based on the relatively large range between the highest and
lowest TF-IDF values.
It was observed that the inter-range difference between ‘employed’ and ‘Unemployed’ was fairly small
(16.83-11.90, truncated to 5). The conclusion is then that both employed and unemployed were significant in the
provision of the research information. On the ‘Groups’ variable, the inter-range difference was fairly large
(20.80-1.62, truncated to 19). Similarly, for the case of ‘Nationality’, the inter-range difference was fairly large
(21.11-2.19, truncated to 19). In case of latent construct physical address, city had a TF-IDF value of 15.7, town
had 13.9 and market had a TF-IDF of 2.1. Therefore, market becomes noisy in this scenario. Moreover, if we
consider latent construct age, adult had a TF-IDF value of 20.1 while youth had 2.1. Once again, youth become
noisy in this circumstance. The deduction that follows is that ‘Groups’, ‘youth’, ‘market’ and ‘Nationality’ were
‘noisy’ and therefore should not be considered in the design of an appropriate framework for social network
marketing. In other words, it was obvious that respondents were members of various online groups. Moreover, it
was obvious that the population constituted of Kenyans. The youths showed little interest in automobile, majorly
because they could not afford them. The customers who resided in locations apart from county headquarters and
places such as Kisumu, Nairobi and Mombasa (city) also exhibited little attention in automobile. This could be
attributed to high cost of internet access, unavailable internet infrastructure and high cost of smart phones that
could access the internet in these areas. Lack of skills on how to accomplish online surfing and searching for
goods and services online could also be another contributing factor to poor attention exhibited by people from
the markets.
Fig.2, Fig.3 and Fig.4 below give results and relationships for goods/services stratified against latent
demographics physical address (without market which has been eliminated as noise), marital status and work.
6. Utilization Of Weight Allocation In Tf-Idf Environment For Noise Detection Enhancement
DOI: 10.9790/0661-18144450 www.iosrjournals.org 49 | Page
figure 2: relationship for goods/services against latent demographics city and town (physical address)
In Fig. 2 above tf-idf weighting values for automobile, flowers, entertainment electronics and mobile
phones for city dwellers was high compared to that of town dwellers. The result is adverts for automobile,
flowers, entertainment electronics and mobile phones will be skewed to fit city dwellers. Computers on the other
hand has equal tf-idf weighting values for both city and town dwellers. The result therefore, is computer adverts
will be skewed to fit both city and town dwellers.
figure 3: relationship for goods/services against latent demographics single and married (marital status)
In Fig. 3 above tf-idf values for single users was high on flowers, clothing, entertainment electronics,
computers, beauty services and mobile phones compared to that of married users. The result is adverts for
flowers, clothing, entertainment electronics, computers, beauty services and mobile phones will be skewed to fit
single users. Tf-idf value for married people was high on furniture and kitchenware compare to that of single
users. The result is adverts for furniture and kitchenware will be skewed to fit married users.
7. Utilization Of Weight Allocation In Tf-Idf Environment For Noise Detection Enhancement
DOI: 10.9790/0661-18144450 www.iosrjournals.org 50 | Page
figure 4: relationship of goods/services against latent demographics (work) employed and unemployed
In fig. 4 above tf-idf values for employed users was high for automobile, mobile phones and
kitchenware compared to that of single users. The result is adverts for automobile, mobile phones and
kitchenware will be skewed to fit employed users. Tf-idf values for flowers and entertainment electronics was
the same for both employed and unemployed users. Result is adverts for flowers and entertainment electronics
will be skewed to fit both employed and unemployed users. Tf-idf values for clothing, furniture, computers and
beauty services was high for unemployed users compared to that of employed users. The result is adverts for
clothing, furniture, computers and beauty services will be skewed to fit unemployed users.
III. Conclusions And Recommendations
It is arguably true that social media data can contain a large portion of noisy data. This leads to a
situation where the definition of noise is intricate and relative. This is so because the removal of this noise is
dependent on the task at hand. Therefore, this study sought to address the challenges of noise removal from
social media data networks for improved digital marketing strategies. To achieve this, weight allocation in TF-
IDF environment was employed in order to enhance detection of noise in data. It was noted that the TF-IDF
value dependent on the frequency that a particular word of phrase appears in one document as well as in the
entire document collection.
The measurable variables that exhibited low values of the TF-IDF were safely regarded as noise and
hence eliminated from future analysis such as non-parametric analysis, path analysis and cluster analysis. This
led to the elimination of ‘Groups’ ,‘Nationality’, ‘Market’, and ‘Youth’ from the framework.
For automobiles, the findings indicated that, more positive attitudes toward social networks were
expressed by: males compared to females; those over 18 years than those that were under 18 years, married
compared to single, city and town residents than market residents, those interested in politics than those not
interested, socialites than business people and academicians, those whose leisure is entertainment than those
whose leisure is events, college and university students than high school students, employed than unemployed,
group members than those who do not belong to any group, and Kenyans than foreigners.
For future work in this area, it is important to note that TF-IDF algorithm was employed. Therefore,
there is need to explore how other algorithms such as Learning Explicit Noise Systems (LENS), an approach
for identifying corrupted fields and using the remaining non-corrupted fields for subsequent modeling and
analysis, can be employed in this perspective.
References
[1]. Curran, J, & Lennon, R. (2011). Participating in the Conversation: Exploring adoption of Online Social Media Networks. Academy
of Marketing Studies Journal 15(1), 21-38.
[2]. Reza Zafarani and Huan Liu, Arizona State University (2014). Behavior Analysis in Social Media
[3]. Anderson, T. H.C. (December 6, 2009). College Students say Facebook is the only Social Networking site that really matters.
[4]. Ito, M., Horst, H., Bittanti, M., Boyd, D., Herr-Stephenson, B., Lange, G., Pascoe, D.J., & Robinson, L. (2008). Living and learning
with new media; Summary of the findings from the digital youth project. Chicago.
[5]. Protalinski, E. (2012). Facebook has over 845 million users.
[6]. Perreau F. (2015). The Consumer FactorConsumer Insights, Market Research, Consumer Behavior & Neuromarketing.
[7]. Lennon R., Rentfro W. & Curran J.(2015). Exploring relationships between demographic variables and social networking use.
Journal of Management and Marketing Research.
[8]. John H. Heinrichs1, Jeen-Su Lim And Kee-Sook Lim (2011), Influence of social networking site and user access method on social
media evaluation
[9]. Yuyu Chen , Over 70 Percent of Marketers Fail to Target Consumers With Behavioral Data [Study], March 27, 2014
[10]. Reza Zafarani, Mohammad Ali Abbasi, Huan Liu, Social Media Mining – An Introduction [Cabridge University Press, 2014]