Download to read offline
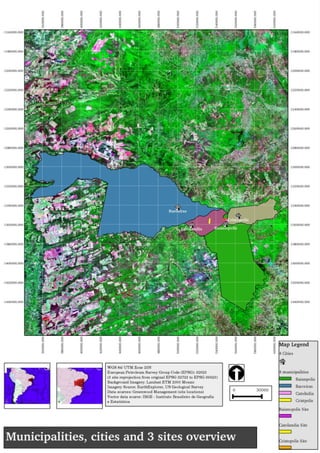
![Site conditions
Soils
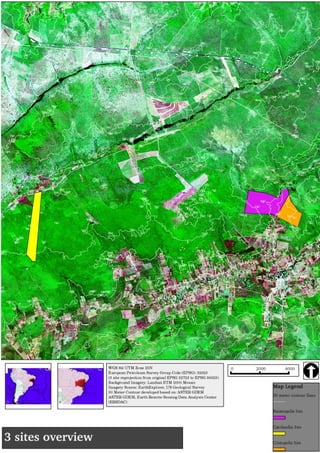
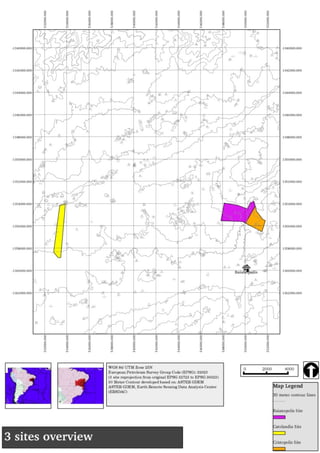
According to the soil maps reviewed (Ref: Embrapa Solos & IBGE), the soils at the areas of north
Baianopolis Municipality, south west Cristopolis Municipality and west Catolandia Municipality - were the
sites are located - have medium/prominent clay texture and belong at the class of “LVd4: Latosolo
Vermelho Amarelo Distrofico”.
Soil fertility in literature (ZANE) as also presented on relevant maps is considered low, but suitable for
agroforestry use.
The sites soil fertility for the projection modelling is classified as in similar Eucalypt plantantion sites in
Minas Gerais with the same soil class (Latosolo Vermelho Amarelo Distrofico) [Filho et al. 2006; Couto et
al. 2004]. The 1:100.000 soil maps of IBGE (See References) were the highest resolution source of
information, and thus these were used for the site projections.
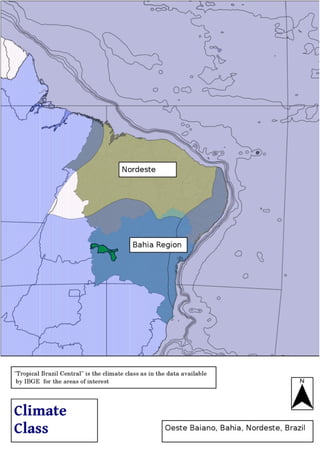
Agro-ecological Zoning
The Zoneamento Agroecologico de Nordestre (ZANE), reports that the Municipalities of interest are
classified as “Chapadas Altas” suitable also for agroforestry land use (agroflorestas). Chapadas altas are
reported having an alitutde of more than 800 m above sea level, while from local analysis the areas are
at somewhat lower location, 750 meters approximately. The sites have a dry period during which a
precipitation deficit occurs. The climate is considered semi-humid with a dry period from April to October.
The Growing Season Length for the area of Barreiras is approximately 200 days, starting on the
beginings of October and ending at the first days of May.
Precipitation deficit during the dry period is the limiting factor for plant growth based on the Miami Model
Climatic Net Primary Productivity [Lieth, 1972] simulated for these sites. This is something already taken
into management consideration, since, as mentioned before (Data Provided by GW
Group) the plantantion sites are irrigated.
4](https://image.slidesharecdn.com/barreirasv4-140205092330-phpapp02/85/GW-Group-Eucalyptus-4-320.jpg)
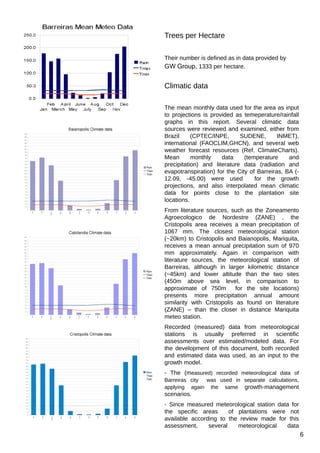
![interpolations methods were tested, and the Thin Plate Spline interpolation method was selected for
providing the best predictions of the literature (ex. ZANE) precipitation data.
Assessment results vary depending on the climatic data used in the simulations, but since the climatic
data variation is low between the stations (Barreiras) and the interpolated points the MAI results are
very slightly influenced (See Growth Projections Chapter). That said, the projection tables and graphs
developed based on Barreiras climatic data can be considered representative of all others.
Growth projection notes - Conclusions
The objective of this assessment was to customize theoretical projections as much as possible to local
conditions. The results rely also on data, parameters and methodological growth projections from the
neighboring region of Minas Gerais (methods which are also widely applied and to other regions of
Brazil) for several the Eucalyptus species such as E. camaldulensis x E. urophylla (which is the clonal
variety of interest to GW Group ), E. urophylla and others.
The widely applied 3-PG Model software [Landsberg et al, 1997], as also specifically referenced in the
References and Acknowledgments Chapters, was used for the growth projection analysis, since it is
deployed in numerous scientific and commercial projects for Eucalyptus plantations in Brazil, and globally
for other species and biomes. The local parametrization of the modelfor the climate and soil variables
used are outlined below and in the other relevant chapters of this report.
Since, as reported by GW Group, detailed local data on plantation growth is not always available for
Bahia for the specific Eucalyptus species, the projections were locally adjusted based also on
parameters of sites in Minas Gerais with similar climatic, soil and clonal Eucalyptus plantation
characteristics [Embrapa Solos, 1973; IBGE; Filho et al. 2006; Couto et al. 2004]. The soil at these sites
is also a Latosolo Vermelho Amarelo Distrofico [Filho et al. 2006; Couto et al. 2004] and with mean
min/max temperature of 17 to 29 Degrees Celsius, but with higher precipitation annual sum. These
growth projections were customized for the plantation sites in Bahia using local and interpolated climatic
data. Soil fertility and available soil water were also adjusted according to the site and soil characteristics,
based on literature parametrization for the similar ecological conditions reported above.
After adapting parameters, several simulations were run with the 3-PG model, and 2 representative
scenarios are described and tabulated results are provided:
- The first scenario (Scenario No1) assumes site treatments to bring soil fertility to the medium level
(0.5) which is gradually decreasing after the third year (0.4), reaching a lower level (0.3) at year 5
and afterwards, to simulate nutrient loss. Available soil water -calibrated as in literature for similar soil
types in the area- is assumed to be at its highest level at the time of planting.
- The second scenario (Scenario No 2) represents a different management regime and soil fertility
class, assuming that additional actions are taken to further increase site characteristics and available
water to plants. Irrigation is assumed to be 8ml/Ha/year for the first 6 years. Site fertility rating for the
3-PG model is assumed to be at a higher level (0.8) for the first 5 years, slightly reducing to a lower
level (0.7) for the next 2 years, and gradually reducing (0.3) after year 7. This is a rather optimal
theoretical growth scenario.
The rotation used in many commercial plantations and experiments in Brazil is between year 6 and 9 for
biomass production in agroforestry systems, and also in scientific reports for plantations for energy
biomass production the 7nth year is the recommended one for harvest in certain cases. Model
simulations present similar results such as the graph intersection of Mean Annual Increment (MAI) and
Periodic Annual Increment (PAI). Mean and Periodic Annual Increment (MAI and PAI) in this case are,
the mean annual volume growth per stand hectare, and the periodic (annual) change on volume per
plantation hectare, respectively.
As mentioned before, assuming a certain site quality scenario, but substituting the Barreiras meteo data
with the point interpolated climatic one, has no significant difference to growth projections. However, this
simulation was made to further customize the projections and examine any hypothetical variability of
such influence.
9](https://image.slidesharecdn.com/barreirasv4-140205092330-phpapp02/85/GW-Group-Eucalyptus-9-320.jpg)
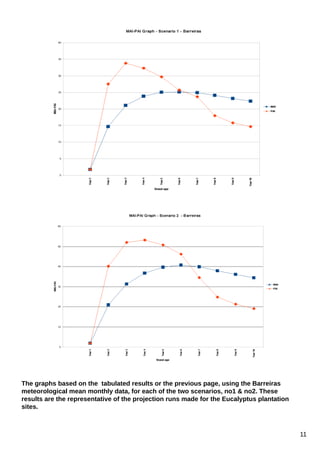
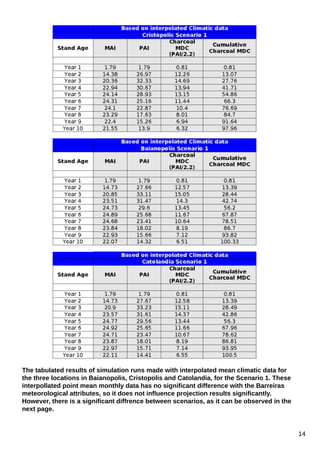
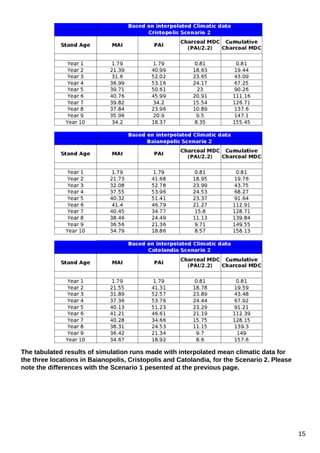
![The tabulated results, using the Barreiras meteorological mean monthly data, for each of
the two scenarios, no1 & no2.
However, significant differences are obtained when simulating different site fertility and management
scenarios (Scenario no1 or no2). The first scenario, is based on assumptions discussed above and its
results are similar with studies made for neighboring regions in Brazil [Filho et al. 2006; Couto et al.
2004], where fertilization and nitrogen fixing crops are part of the agroforestry system management
practices. Significant variation is observed between the response of the growth projections to the 2nd
management scenario discussed, with simulated growth to increase substantially given that field
conditions and applications (ex. nitrogen fixing plants, fertilization, irrigation, clonal species
characteristics, silviculture) can decrease significantly growth limitations to plantation trees.
Local management practices and site conditions, such as increased irrigation, mixed cultivation of
10](https://image.slidesharecdn.com/barreirasv4-140205092330-phpapp02/85/GW-Group-Eucalyptus-10-320.jpg)
![nitrogen fixing plants and/or higher levels of fertilizer input and selected clonal Eucalyptus varieties
(similar to Scenario No2), up to a level where tree growth limiting factors are significantly reduced, can
increase the volume production.
Yields higher than 40 cubic meters per ha per year are widely reported in Brazil Eucalyptus plantation
literature [BEPP and citations within; Rossi et al, 2003]. On a recent published scientific study in Bahia,
Brazil, an Eucalyptus plantation was established on “Typic Hapludox” soils, and treated for increased
fertility and irrigated experimental plot reached an MAI of 90 m3/ha/year, “which is one of the highest
ever reported on forests”, not just in Eucalyptus plantations [Reference: Stape et al, 2007].
Conversion Factor - Wood volume to charcoal MDC
The conversion factor of solid wood volume to charcoal which was used for the projection results is
defined by literature of Brazilian eucalyptus forestry, and is provided below:
Solid wood cubic meter/MDC of charcoal = 2,2
Please note that this conversion factor applies not to stacked wood volume, but to solid wood volume dry wood- (Stacked wood volume to MDC has a conversion factor of 1,47. This conversion factor (2.2)
above is for solid wood volume, and the mean annual increment is used to calculate charcoal MDC).
The MDC factors and calculations derived from literature [Álvaro Nogueira de Souza,2007] were
developed in Brazil for Eucalyptus species, and in the referenced article the clonal variety in question for
this assessment, Eucalyptus urophylla x Eucalyptus camaldulensis is mentioned.
In the pages of the “Growth Projection results” paragraph one can observe that the Periodic Annual
Increment (solid wood volume) is divided by the MDC factor of 2.2 to calculate Charcoal MDC. The
cumulative increment of charcoal MDC provides the amount of charcoal produced until that period, for
example “Year 7 of Cumulative Charcoal MDC” provides the amount of charcoal potentially produced
until that date.
13](https://image.slidesharecdn.com/barreirasv4-140205092330-phpapp02/85/GW-Group-Eucalyptus-13-320.jpg)
![References - Resources
Several literature, web and other resources were reviewed for this assessment, which are mentioned in
detail below:
- Avery, T.E., B.E. Harold, 2002. Forest Measurements, fifth edition, New York; McGrow-Hill
426 p.
- J.J. Landsberg, R.H. Waring, A generalised model of forest productivity using simplified
concepts of radiation-use efficiency, carbon balance and partitioning, Forest Ecology and
Management, Volume 95, Issue 3, 1 August 1997, Pages 209-228, ISSN 0378-1127
- R.H. Waring, N.C. Coops, J.J. Landsberg, Improving predictions of forest growth using the
3-PGS model with observations made by remote sensing, Forest Ecology and Management,
Volume 259, Issue 9, Productivity in Tropical Plantations, 15 April 2010, Pages 1722-1729,
ISSN 0378-1127
- J. J. Landsberg, R. H. Waring, N. C. Coops, Performance of the forest productivity model 3PG applied to a wide range of forest types, Forest Ecology and Management, Volume 172,
Issues 2-3, 20 January 2003, Pages 199-214, ISSN 0378-1127
- N. C. Coops, R. H. Waring, J. J. Landsberg, Assessing forest productivity in Australia and
New Zealand using a physiologically-based model driven with averaged monthly weather
data and satellite-derived estimates of canopy photosynthetic capacity, Forest Ecology and
Management, Volume 104, Issues 1-3, 12 May 1998, Pages 113-127, ISSN 0378-1127
- P. J. Sands, J. J. Landsberg, Parameterisation of 3-PG for plantation grown Eucalyptus
globulus, Forest Ecology and Management, Volume 163, Issues 1-3, 28 June 2002, Pages
273-292, ISSN 0378-1127
- ALMEIDA, A.C.; LANDSBERG, J.J.; SANDS, P.J. Parameterisation of 3-PG model for fastgrowing Eucalyptus grandis plantations. Forest Ecology and Management, v.193, p.179-195.
2004.
- SILVA, G.G.C. Nutrição, crescimento e sua modelagem em povoamentos de eucalipto em
resposta à disponibilidade de água e nutrientes. Viçosa, MG: UFV, 2006. 102f. Tese
(Doutorado em Solos e Nutrição de Plantas) – Universidade Federal de Viçosa, Viçosa.
- SANDS, P.J. 3PGpjs - A User – Friendly interface to 3-PG, the landsberg and waring model
of forest productivity. Cooperative research centre for sustainable production forestry and
CSIRO forestry and forestry products. Technical Report n. 29, Edition 2.3, february, 2003.
- Silva, Welliam Chaves Monteiro da, 1973- Modelagem dos balanços de radiação e de água
e simulação do crescimento do eucalipto na Bacia do Rio Doce-MG / Welliam Chaves
Monteiro da Silva. – Viçosa, MG , 2007. Tese (doutorado) - Universidade Federal de Viçosa
- BEPP Brazilian Eucalyptus Productivity Model online resources at
http://lamar.colostate.edu/~mryan/Research/BEPP.htm, and also
http://lamar.colostate.edu/~binkley/Brazileucalyptus.htm and http://www.ipef.br/bepp/. Websites and
citations within.
- FAOCLIM 2: World-wide Agroclimatic Database, Version 2.01. January 2001. Environment
and Natural Resources Working Paper Number 5. Available on CD-ROM from the
Agrometeorology Group, Environment and Natural Resources Service (SDRN), Sustainable
Development Department (SD), Food and Agriculture Organization of the United Nations
(FAO), Rome, Italy. FAOCLIM 2 CD-ROM is described at
[http://www.fao.org/sd/2001/EN1102_en.htm].
- CLIMPAG: Climate Impact on Agriculture, Environment, CLimate Chaneg and Bioenergy Divistion
18](https://image.slidesharecdn.com/barreirasv4-140205092330-phpapp02/85/GW-Group-Eucalyptus-18-320.jpg)


This document provides growth projections for eucalyptus plantations in Bahia, Brazil over a period of years based on climate and soil data. It describes two scenarios - one with average soil fertility and management, and another with increased irrigation, fertility, and optimized practices. The first scenario projects average growth rates similar to other studies in Brazil. The second scenario with improved practices projects significantly higher growth, with potential yields exceeding reports from other regions. Projections are based on a forest growth model run with climate data from a nearby weather station and soil properties.


