1. GISMAP Associazione Professionale – Borgo degli Albizi, 14, 50122 Firenze. P. Iva:06136440481
Tel/Fax: (+39)0553840975 - E-mail: gismap@gismap.it - Sito Web: www.gismap.it
The GISMAP approach to Global Agro-Ecological Zoning (GAEZ)
Introduction
In developing countries, the characteristics of natural resources (soil, water, vegetation, and climate) and
socio-economic conditions are frequently limiting factors for food production and food security. These limiting
factors are amplified by the effects of climate change, so their correct use is crucial.
Future challenges for food security require actions based on new, high impact technologies. It will be crucial
to sustainably raise agricultural yields as well as the increase the resilience capacity and the adaptation of
farming systems to environmental changes.
In order to ensure the long-term sustainability, proposed solution packages will have to take into account
physical, social and economic conditions of each particular food production system.
To achieve sustainable productions and soil and water resources conservation, GISMAP has implemented a
set of original tools in order to apply, as strictly as possible, the general methodological framework of Land
Evaluation, as defined by FAO1
, to the specific ecological and socio-economic conditions of a given study
area.
Such tools have been successfully implemented by Gismap in Iraq, in the framework of a study at national
level.
Most elements have been retained from two main FAO application domains:
The Global Agro Ecological Zones2,3
project;
The Guidelines for Land Evaluation, mostly for Rain-fed4
and Irrigated5
agriculture, usually known as
“Land Suitability analysis”.
The approach adopted by GISMAP is driven by the observation that Agro Ecological Zoning (AEZ) and Land
Suitability (LS) are seen as alternative solutions to the problem of Land Evaluation for Land Use planning;
instead, they have been created and developed for the same purposes under the same institutional and
cultural umbrella, i.e. FAO. The two approaches share a common vision and similar goals and have many
elements in common.
This difference in the application of the two frameworks is due to a basic difference in their respective
scientific approach:
AEZ has been proposed by crop physiologists and agro-climatology scientists, and rely largely on
climatic data to identify the crop potentialities.
LS has been developed by soil scientists, and focuses on soil, landforms and agricultural practices
as the main sources of agricultural limitations.
These different scientific visions are also linked to different working scales: for small areas, like a district, a
watershed, or an irrigation scheme, that usually need to be mapped at large scale6
(e.g. 1:50.000 or larger),
1
A framework for Land Evaluation, FAO Soils bulletin 32, Soil resources development and conservation service land and water
development division, FAO, Rome, 1976
2
Global Agro-Ecological Zones (Global AEZ), IIASA and FAO, 2000.
3
GAEZ v3.0 Global Agro-Ecological Zones, IIASA and FAO, 2012, http://www.iiasa.ac.at/Research/LUC/GAEZv3.0
4
Guidelines: Land Evaluation for Rainfed Agriculture, FAO Soils bulletin 52, Soil resources development and conservation
service land and water development division, FAO, Rome, 1983
5
Guidelines: Land Evaluation for Irrigated Agriculture, FAO Soils bulletin 55, Soil resources development and conservation
service land and water development division, FAO, Rome, 1985
6
We use the terms “large” and “small” scale by referring to their rational value, not to the denominator.
2. GISMAP Associazione Professionale – Borgo degli Albizi, 14, 50122 Firenze. P. Iva:06136440481
Tel/Fax: (+39)0553840975 - E-mail: gismap@gismap.it - Sito Web: www.gismap.it
the soil and topographic information is much more relevant for land use planning than climatic variations.
Instead, for large areas such as a whole region or a continent, usually mapped at small scales (e.g.
1:5.000.000), climate plays a much more fundamental role.
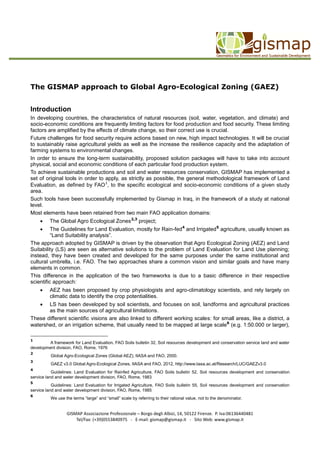
However, in the operational practice, LS has been widely adopted for detailed and semi-detailed studies,
while AEZ find applications in regional or global projects.
Figure 1: Conceptual relationship between AEZ and Land Suitability proposed. The
relevance of soil information decreases with scale, while climatic factors gain importance.
GISMAP approach
In the Land Evaluation study carried out by GISMAP, we sought to integrate both methodologies, merging
the crop-oriented quantitative approach of AEZ with the high resolution of Land Suitability, in order to output
the most detailed possible information7
over the entire country.
In our approach the AEZ models have been re-engineered and used to estimate the potential agro-climatic
yield, i.e. the yield that could be expected if no soil, management, fertility, topographic, water quality and
climatic constraints apply; then, Land Suitability Analysis is carried out to approximate the real agricultural
conditions.
7
The final spatial resolution of our case study corresponds to a square cell with a size of 250m, against a current FAO GAEZ
resolution of ~1km.
3. GISMAP Associazione Professionale – Borgo degli Albizi, 14, 50122 Firenze. P. Iva:06136440481
Tel/Fax: (+39)0553840975 - E-mail: gismap@gismap.it - Sito Web: www.gismap.it
Overview of the methodology
A schematic of the workflow, in which AEZ and Land Suitability are combined and chained, is shown in
Figure 2.
Five modules were considered: Climate, Topography, Soil, Land Utilization types (LUT) and Water Quality.
Each module is connected to the corresponding Data Source (one or more GIS layers and/or Databases),
and performs the module-specific data pre-processing and the application of the crop-specific ratings.
The Climate module performs also the estimation of the agro-climatic potential crop yield, using the Kassam
model, as in GAEZ8
.
The LUT module has a special characteristic: it can interact with the Topography, Soil and Water Quality
modules, and trigger the use of different sets of criteria and thresholds according to the current or expected
socio-economic conditions.
The five modules are combined into the “n-Crop Module”, which controls the iteration of the five modules
through the crops list, providing the required crop-specific parameters and performing the final data
aggregation.
The application of the Land Suitability framework has been implemented in strict accordance with Sys et al.9
,
by defining a set of Matching Tables for each crop. The Matching Table is the core of the procedure, as it
contains the crop-specific set of instructions that are needed in order to carry out an accurate Land Suitability
evaluation. In the Matching Tables, several environmental and socio-economic parameters have been rated
to estimate their overall impact on the crop under assessment. These calculations output six crop-specific
Yield Reduction Factors (YRF)10
, according to parameters’ grouping:
Climate11
Water quality
Land Utilization Type (LUT)
Soil
Fertility
Topography
The application of these YRFs to the potential agro-climatic yield is then used to estimate the expectable
yield under the current field conditions.
The final output is a set of raster files for each crop:
Climatic Potential Yield, in q/ha of commercial yield;
Crop Suitability (the aggregation of the six YRFs listed above), in % of reduction of the optimum
yield;
Agro-climatic Suitability (the combination of the Potential Yield with the Crop Suitability), in q/ha of
commercial yield.
8
At this stage of methodological development, crop yield is estimated using the Kassam model, as in GAEZ. See: Kassam,
A.H. Net biomass production and yield of crops. Present and potential land use by agro-ecological zones project. Rome, FAO, 1977
9
Sys C., Van Ranst E., and Debaeye J., Land Evaluation. Methods in land evaluation. General Administration for Development
Cooperation. Agric. Publ. No. 7. Brussels , Belgium, 1991
10
The Soil Module performs the computations for two YRF layers, i.e. Soil and Fertility.
11
The Climate as an YRF is intended as the climatic constraints that negatively affect the specific crop cycle, e.g. humidity at
ripening of date palm, low temperature at fruit tree flowering, etc.
4. GISMAP Associazione Professionale – Borgo degli Albizi, 14, 50122 Firenze. P. Iva:06136440481
Tel/Fax: (+39)0553840975 - E-mail: gismap@gismap.it - Sito Web: www.gismap.it
Figure 2 – The workflow.
5. GISMAP Associazione Professionale – Borgo degli Albizi, 14, 50122 Firenze. P. Iva:06136440481
Tel/Fax: (+39)0553840975 - E-mail: gismap@gismap.it - Sito Web: www.gismap.it
Application details
General structure
Following Sys et al., the current value of a land characteristic (e.g. slope, pH, soil texture etc.) for a given
portion of land (e.g. a cell of a raster grid or a map polygon) is rated according to a set of thresholds to define
the percent of yield reduction that is expected, on a scale from 0 (no production) to 100 (no reduction).
The evaluation process is based on a set of procedures developed in Visual Basic. The entire model can be
run only in non-interactive mode, i.e. no user interface has been developed yet. Each module can be
controlled by command line inputs, so it has been possible to integrate them into automated batch
procedures By the way, most of the options and the parameters for the various modules and procedures can
be simply changed by editing the configuration files or the Matching Tables.
The procedure has been applied to all major crops of Iraq, including cereals, pulses, fodder, vegetables and
fruits.
The core of the procedure is the so-called Matching Table; for each crop under investigation a set of
Matching Tables has been prepared, where scores are set for each parameter involved in the evaluation, as
in the example below.
Topography
SLOPE ALTITUDE ASPECT
Weight 1 Weight 3 Weight 1
Threshold Score Threshold Score Threshold Score
0 100 0 100 N 40
5 85 700 85 NE 60
10 60 900 60 E 60
20 40 1000 40 SE 100
35 25 1500 0 S 100
SW 85
W 40
NW 40
Table 1 – example of a Matching Table, details. The data are only intended as sample
figures and don’t have any real relevance.
This example refers to the main layer “Topography”, and three land characteristics are taken into
consideration: “Slope”, “Altitude” and “Aspect”. There is virtually no limit to the number of land characteristics
that can be setup for evaluation.
It is a specific responsibility of the user to create and configure the Matching Tables, and to verify that the
range of values or the array of codes in use is coherent with the current content of the corresponding data
source.
To improve the accuracy of the classification, the user can assign a weight to each land characteristic. The
use of different weights is intended to take into account the comparative higher or lesser impact of a land
6. GISMAP Associazione Professionale – Borgo degli Albizi, 14, 50122 Firenze. P. Iva:06136440481
Tel/Fax: (+39)0553840975 - E-mail: gismap@gismap.it - Sito Web: www.gismap.it
characteristic on the crop under evaluation. In our example of Table 1, “Elevation” is considered three times
more important than “Slope” and “Aspect”.
Furthermore, for each land characteristic, different sets of scores can be set for different scenarios. For
example, different scores can be used in scenarios with, low, intermediate or high levels of inputs.
Relationships between layers can be taken into account whenever needed, e.g. in the case of “Aspect”,
which could always be considered irrelevant when the slope is flat or almost flat.
Data sources
Input data for each module can come from various user-defined data sources. There can be three basic
types of data sources:
For a raster GIS layer, each grid cell undergoes the evaluation. When the raster layers are more than
one, like in the example of Topography (three land characteristics), the computation is simplified by
combining all the layers and running the evaluation on each different combination of grid values. The
procedure has been tested with ArcINFO grid files and Grass raster category files.
For a vector GIS layer, the evaluation is carried out on the attribute table for each geographic object
(typically a polygon). The expected input is a shapefile, but any dBase III-compliant file is suitable,
provided that there is a join field with the geographic file.
For the Soil main layer, the procedure is directly interfaced with the Soil DB, and peculiar procedures
are applied to the Soil data (see paragraph below). The results are linked back to the GIS through the
Soil map. Relevant procedure can accept any SQL-compliant DB.
Special procedures for soil evaluation
Soil data can be related to the soil profile (pedon) as a whole, or to the different horizons into which the soil
has been divided by the surveying specialist. Typically, for one soil profile there are two or more horizons in
the database (typically, a one-to-many relationship). So for example the rock outcrops and the soil crust are
defined at the pedon level, while most analytical data such as pH, texture or salinity refer to the different
horizons. So for this second category of data normally more than one figure is expected for each soil profile.
When calculating a single averaged value of a characteristic for each pedon, the depth to be taken into
account for averaging must vary from crop to crop (we cannot adopt the same depth e.g. for barley and
olives).
This operation is carried out using a crop-specific depth value, and applying a weighted average to the
horizons data up to that value, using the thickness of the single horizons as weighting factor.
In addition, again according to Sys et al., a decreasing importance is given to soil parameters as the depth
increases. A linear formula has been implemented to efficiently replace the original Sys approach of equal
sections and weighting factors.
Output
At any run of the application, the results of the Land Suitability classification consist of a set of tables, one for
each main environmental layer. The tables are then spatially combined; the user can specify the aggregation
algorithm. Thus, the final output is a set of raster GIS layers.
In the current application, the result is automatically recalculated and saved for each crop, and a sequence
of GDAL-based Python scripts is triggered in order to produce the desired GIS output layers as GeoTiff files.
Potential applications of the methodology
The set of tools implemented offers a great flexibility in the selection of evaluation parameters and relevant
thresholds. Such flexibility make it suitable for use in a very wide variety of environmental and socio-
economic conditions, allowing a reliable evaluation of natural resources and the optimization of farming
7. GISMAP Associazione Professionale – Borgo degli Albizi, 14, 50122 Firenze. P. Iva:06136440481
Tel/Fax: (+39)0553840975 - E-mail: gismap@gismap.it - Sito Web: www.gismap.it
systems.
Furthermore, the possibility to work with scenarios gives the opportunity to quantitatively evaluate the impact
of climate change on agricultural productions.as a matter of fact, future trends in climatic parameters for a
given area can be taken into account in climate module. At the same time, other factors that are linked to
climatic variations (i.e. level of inputs or agricultural practices) can be considered in the socio-economic
module.
This approach offers a powerful tool in environmental studies as well as in agricultural development projects,
where the adaptation of farming systems to cope with changing conditions is essential for sustainable food
production.