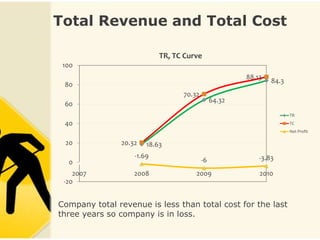
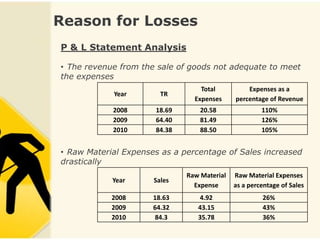
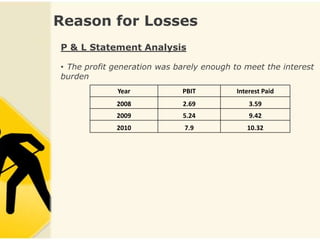
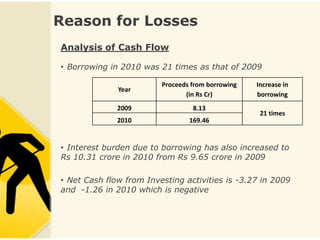
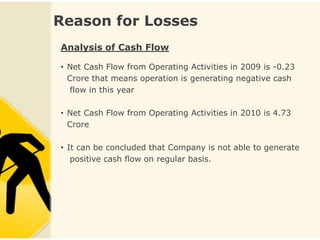
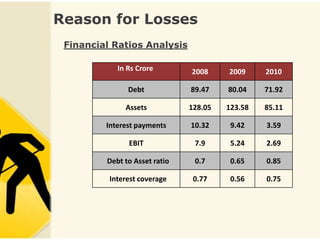
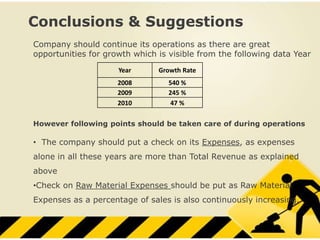
Gactel Turnkey Projects
        Limited
Brief Profile

Gactel Turnkey Projects Limited is a Gammon
Group Company founded in 2006. It was constituted
to cater specifically to National and International
requirements of Cooling Towers and cooling systems.
The Company has the technical expertise and financial
back-up by Gammon India Limited.

Products of GTPL

Air Cooled Condensers and Heat Exchangers
FRP Package Cooling Towers
Industrial Construction and Customer Services
Pultruded FRP Cooling Towers
Market Structure
Market Structure is Oligopolistic since there are few major
players in the market providing homogenous services.

 Concentration ratio –
     4 firm concentration ratio is more than 60%.

                          Concentration Ratio
           4       8           12        16      20     31
          71.01   82.94      90.27     95.41    98.46   100

 Herfindahl Index –

   Herfindahl Index is 0.305 Out of the 31 companies
   Gactel Turnkeys Limited ranks 27 in terms of sales
   turnover.
Total Revenue and Total Cost

                           TR, TC Curve
 100
                                                      88.13
                                                              84.3
 80
                                 70.32
                                              64.32
 60
                                                                     TR
 40                                                                  TC
                                                                     Net Profit

 20            20.32   18.63
                   -1.69                                  -3.83
  0                                      -6
    2007           2008              2009                 2010
 -20


Company total revenue is less than total cost for the last
three years so company is in loss.
Reason for Losses
P & L Statement Analysis

• The revenue from the sale of goods not adequate to meet
the expenses
                                  Total          Expenses as a
            Year        TR
                                Expenses     percentage of Revenue
            2008      18.69       20.58               110%
            2009      64.40       81.49               126%
            2010      84.38       88.50               105%


• Raw Material Expenses as a percentage of Sales increased
drastically
                              Raw Material   Raw Material Expenses
            Year      Sales
                                Expense      as a percentage of Sales
            2008      18.63      4.92                 26%
            2009      64.32      43.15                43%
            2010      84.3       35.78                36%
Reason for Losses
P & L Statement Analysis

• The profit generation was barely enough to meet the interest
burden
             Year            PBIT          Interest Paid
             2008            2.69              3.59
             2009            5.24              9.42
             2010             7.9             10.32
Reason for Losses
Analysis of Cash Flow

• Borrowing in 2010 was 21 times as that of 2009

                         Proceeds from borrowing   Increase in
              Year
                                (in Rs Cr)         borrowing
              2009                8.13
                                                    21 times
              2010               169.46


• Interest burden due to borrowing has also increased to
Rs 10.31 crore in 2010 from Rs 9.65 crore in 2009

• Net Cash flow from Investing activities is -3.27 in 2009
and -1.26 in 2010 which is negative
Reason for Losses
Analysis of Cash Flow

• Net Cash Flow from Operating Activities in 2009 is -0.23
  Crore that means operation is generating negative cash
  flow in this year

• Net Cash Flow from Operating Activities in 2010 is 4.73
  Crore

• It can be concluded that Company is not able to generate
   positive cash flow on regular basis.
Reason for Losses
 Financial Ratios Analysis

            In Rs Crore        2008     2009     2010

               Debt            89.47    80.04    71.92

              Assets           128.05   123.58   85.11

         Interest payments     10.32     9.42    3.59

               EBIT             7.9      5.24    2.69

         Debt to Asset ratio    0.7      0.65    0.85

          Interest coverage     0.77     0.56    0.75
Reason for Losses
 Financial Ratios Analysis

 Debt to Asset ratio:
  This ratio measures the % of total assets financed with
  debt. For example, debt assets ratio of 0.85 indicates that
  85% of the company's assets are financed with debt.
  Generally, higher debt means higher financial risk.

 Interest coverage ratio:
  This ratio measures the no. of times a company's EBIT
  could cover its interest payments. Higher ratio offers
  greater assurance that the company can service its debt
  from operating earnings.
Conclusions & Suggestions
Company should continue its operations as there are great
opportunities for growth which is visible from the following data Year
                     Year      Growth Rate
                     2008         540 %
                     2009         245 %
                     2010          47 %

However following points should be taken care of during operations

• The company should put a check on its Expenses, as expenses
alone in all these years are more than Total Revenue as explained
above
•Check on Raw Material Expenses should be put as Raw Material
Expenses as a percentage of sales is also continuously increasing.
Conclusions & Suggestions
• With control of expenses Net Cash Flow from operating activities

will also improve

• Aggressive sales promotions

• Borrowing should be controlled in order to reduce the tax burden
Thank You !!!

GTPL - Loss Analysis

  • 1.
  • 2.
    Brief Profile Gactel TurnkeyProjects Limited is a Gammon Group Company founded in 2006. It was constituted to cater specifically to National and International requirements of Cooling Towers and cooling systems. The Company has the technical expertise and financial back-up by Gammon India Limited. Products of GTPL Air Cooled Condensers and Heat Exchangers FRP Package Cooling Towers Industrial Construction and Customer Services Pultruded FRP Cooling Towers
  • 3.
    Market Structure Market Structureis Oligopolistic since there are few major players in the market providing homogenous services.  Concentration ratio – 4 firm concentration ratio is more than 60%. Concentration Ratio 4 8 12 16 20 31 71.01 82.94 90.27 95.41 98.46 100  Herfindahl Index – Herfindahl Index is 0.305 Out of the 31 companies Gactel Turnkeys Limited ranks 27 in terms of sales turnover.
  • 4.
    Total Revenue andTotal Cost TR, TC Curve 100 88.13 84.3 80 70.32 64.32 60 TR 40 TC Net Profit 20 20.32 18.63 -1.69 -3.83 0 -6 2007 2008 2009 2010 -20 Company total revenue is less than total cost for the last three years so company is in loss.
  • 5.
    Reason for Losses P& L Statement Analysis • The revenue from the sale of goods not adequate to meet the expenses Total Expenses as a Year TR Expenses percentage of Revenue 2008 18.69 20.58 110% 2009 64.40 81.49 126% 2010 84.38 88.50 105% • Raw Material Expenses as a percentage of Sales increased drastically Raw Material Raw Material Expenses Year Sales Expense as a percentage of Sales 2008 18.63 4.92 26% 2009 64.32 43.15 43% 2010 84.3 35.78 36%
  • 6.
    Reason for Losses P& L Statement Analysis • The profit generation was barely enough to meet the interest burden Year PBIT Interest Paid 2008 2.69 3.59 2009 5.24 9.42 2010 7.9 10.32
  • 7.
    Reason for Losses Analysisof Cash Flow • Borrowing in 2010 was 21 times as that of 2009 Proceeds from borrowing Increase in Year (in Rs Cr) borrowing 2009 8.13 21 times 2010 169.46 • Interest burden due to borrowing has also increased to Rs 10.31 crore in 2010 from Rs 9.65 crore in 2009 • Net Cash flow from Investing activities is -3.27 in 2009 and -1.26 in 2010 which is negative
  • 8.
    Reason for Losses Analysisof Cash Flow • Net Cash Flow from Operating Activities in 2009 is -0.23 Crore that means operation is generating negative cash flow in this year • Net Cash Flow from Operating Activities in 2010 is 4.73 Crore • It can be concluded that Company is not able to generate positive cash flow on regular basis.
  • 9.
    Reason for Losses Financial Ratios Analysis In Rs Crore 2008 2009 2010 Debt 89.47 80.04 71.92 Assets 128.05 123.58 85.11 Interest payments 10.32 9.42 3.59 EBIT 7.9 5.24 2.69 Debt to Asset ratio 0.7 0.65 0.85 Interest coverage 0.77 0.56 0.75
  • 10.
    Reason for Losses Financial Ratios Analysis  Debt to Asset ratio: This ratio measures the % of total assets financed with debt. For example, debt assets ratio of 0.85 indicates that 85% of the company's assets are financed with debt. Generally, higher debt means higher financial risk.  Interest coverage ratio: This ratio measures the no. of times a company's EBIT could cover its interest payments. Higher ratio offers greater assurance that the company can service its debt from operating earnings.
  • 11.
    Conclusions & Suggestions Companyshould continue its operations as there are great opportunities for growth which is visible from the following data Year Year Growth Rate 2008 540 % 2009 245 % 2010 47 % However following points should be taken care of during operations • The company should put a check on its Expenses, as expenses alone in all these years are more than Total Revenue as explained above •Check on Raw Material Expenses should be put as Raw Material Expenses as a percentage of sales is also continuously increasing.
  • 12.
    Conclusions & Suggestions •With control of expenses Net Cash Flow from operating activities will also improve • Aggressive sales promotions • Borrowing should be controlled in order to reduce the tax burden
  • 13.