Downloaded 62 times


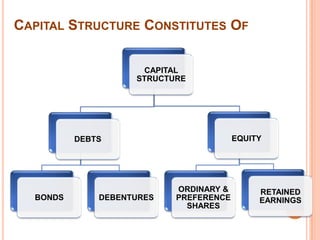

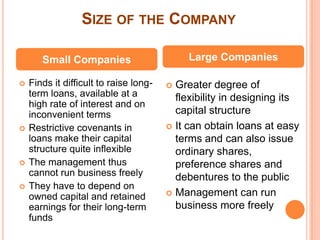
![EBIT-EPS ANALYSIS
How sensitive is EPS to changes in EBIT under
different financing alternatives
EPS = [(EBIT – I)(1 - t)] / n
I = interest burden
t = tax rate
n = number of equity shares](https://image.slidesharecdn.com/group81-120414225508-phpapp01/85/Group8-1-10-320.jpg)

r = cost of debt
D/E = debt – equity ratio
t = tax rate](https://image.slidesharecdn.com/group81-120414225508-phpapp01/85/Group8-1-15-320.jpg)
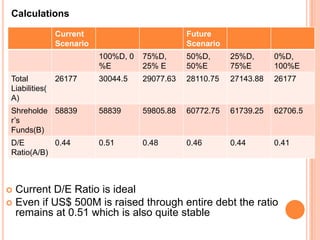
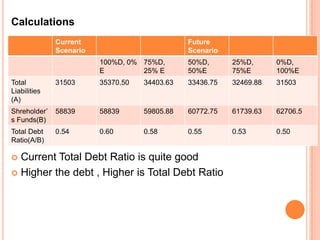
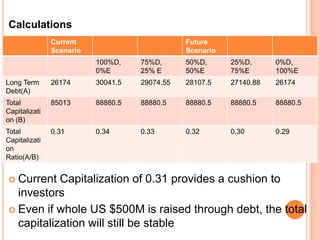
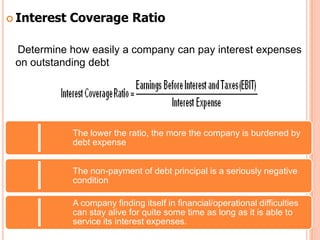
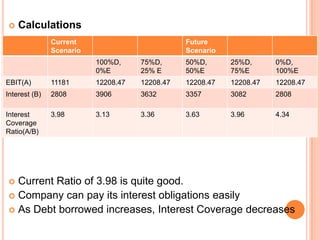

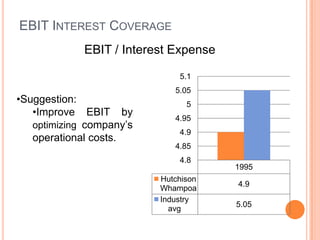
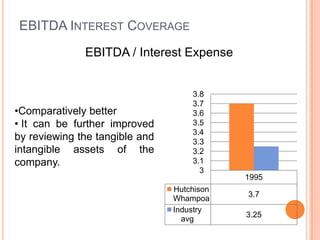
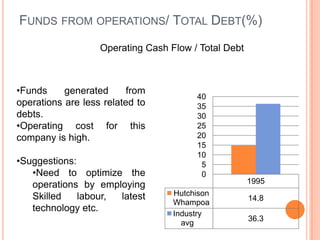
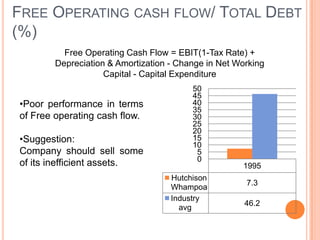
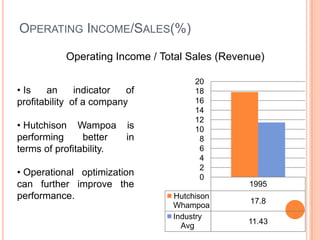
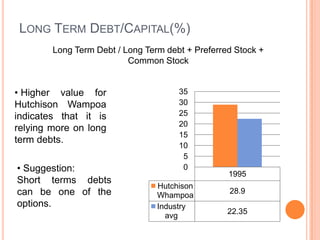
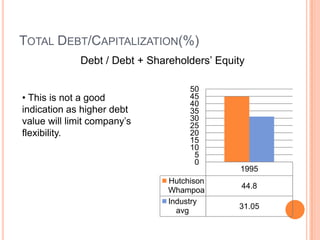
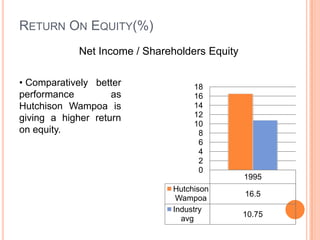
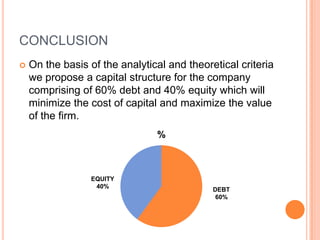


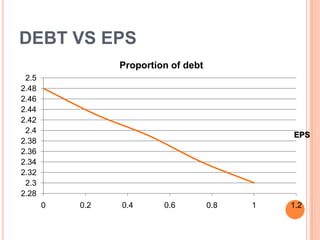
This document assesses the capital structure of Hutchison Whampoa based on its future financing needs. It analyzes Hutchison Whampoa's current capital structure ratios and compares them to industry averages. It also models how different ratios would be impacted by raising $500 million through various combinations of debt and equity. Overall, the analysis finds that Hutchison Whampoa's current capital structure ratios are healthy but could be optimized further to improve profitability and cash flow while maintaining financial stability.