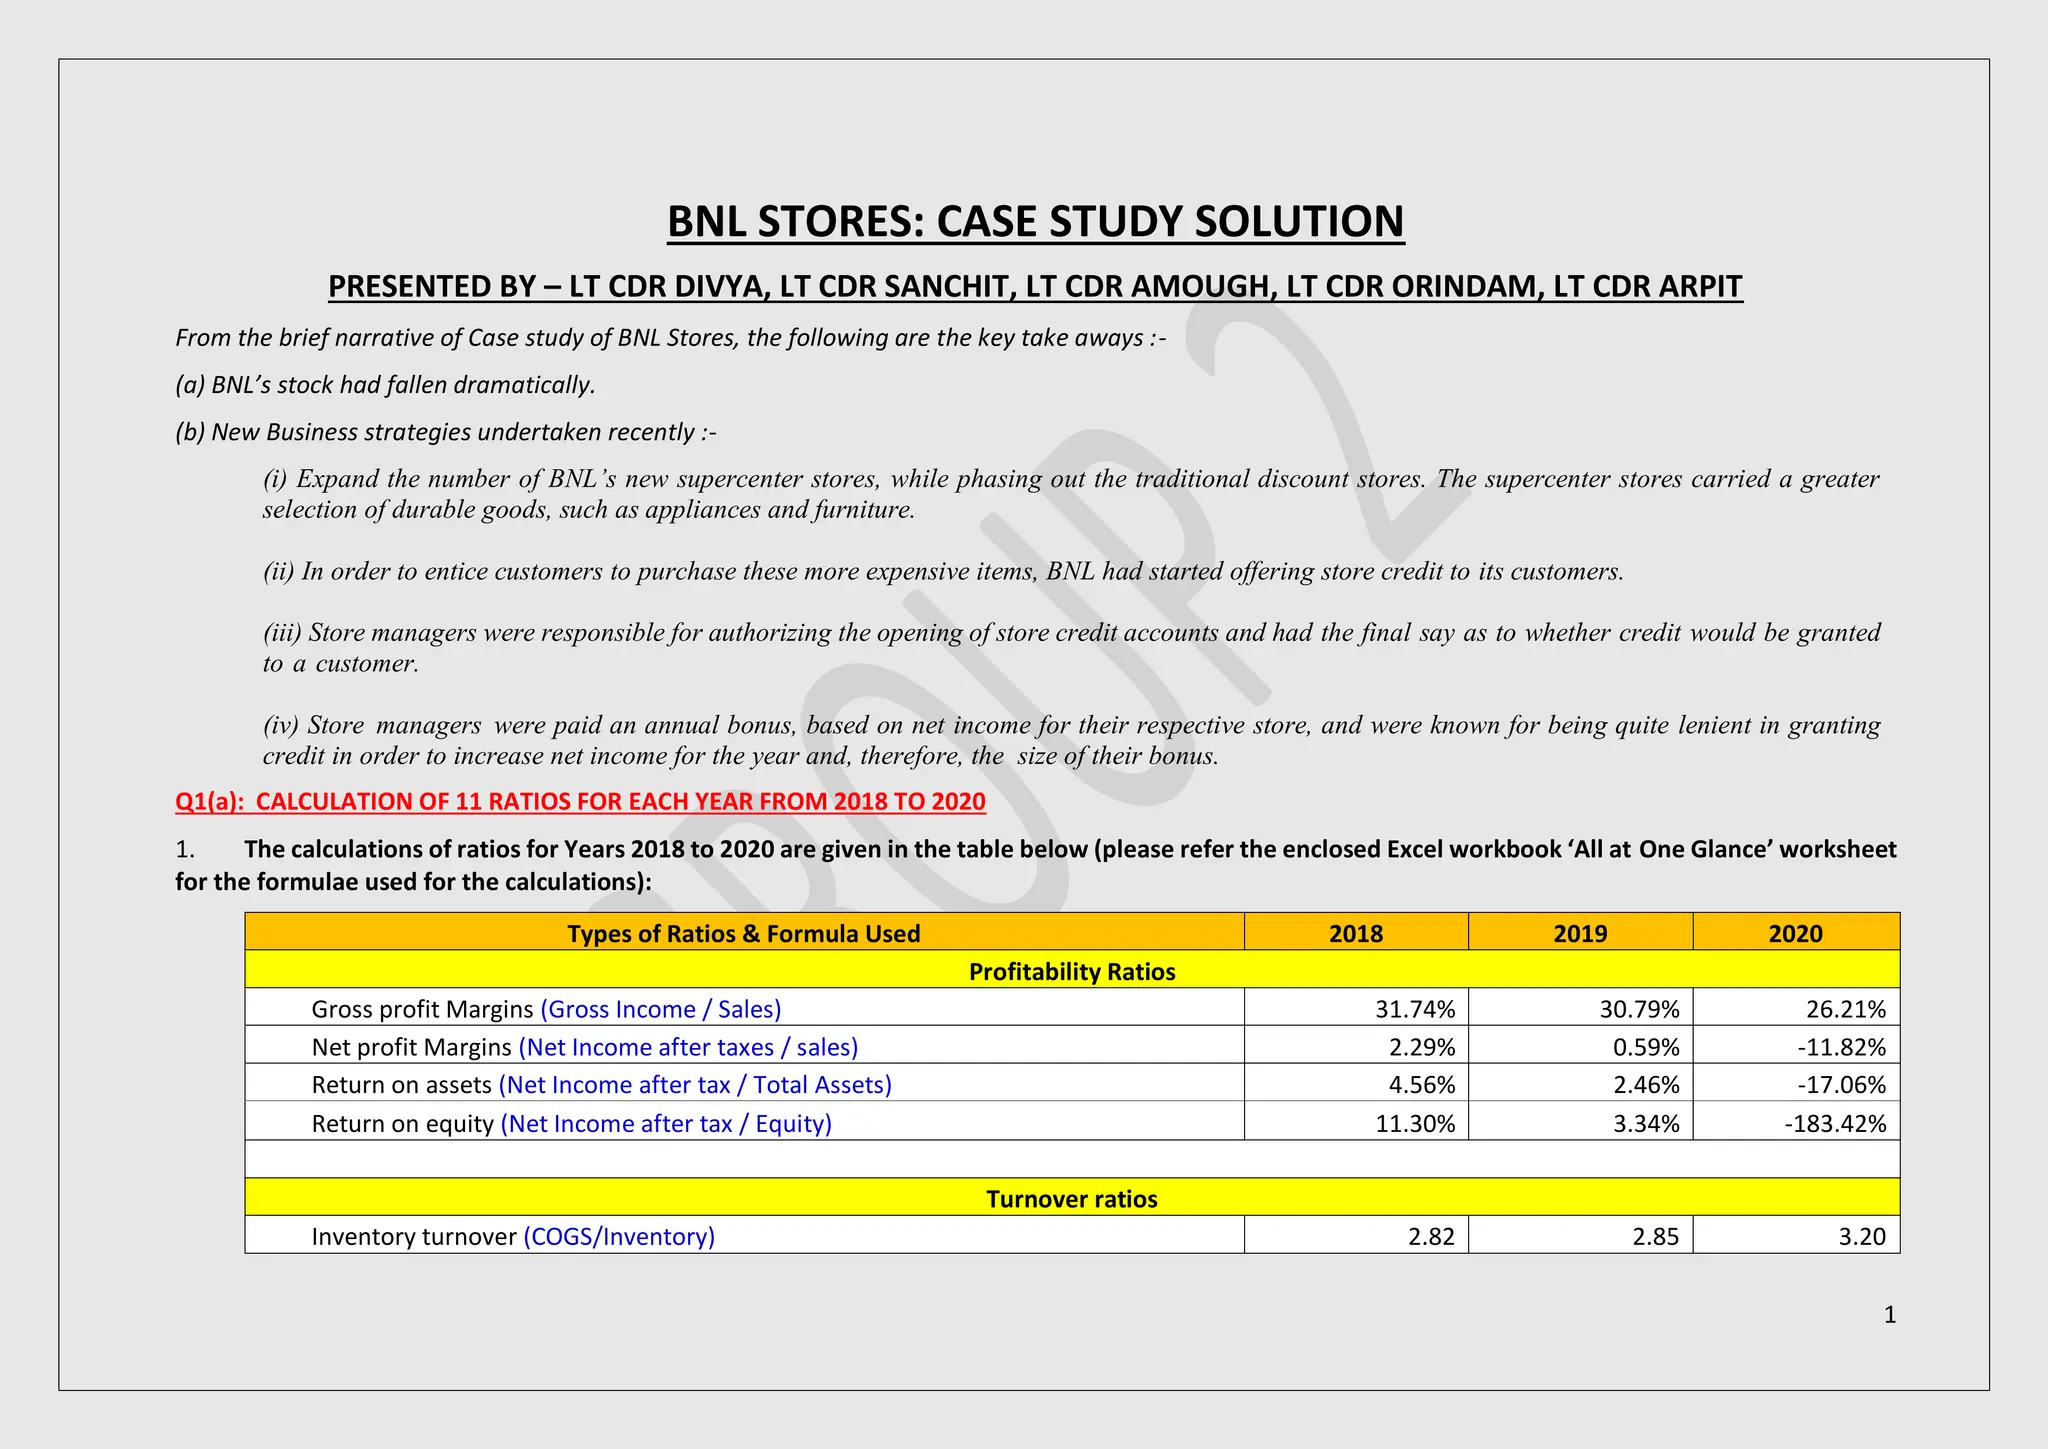
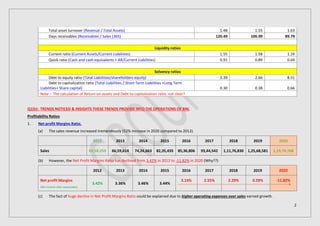
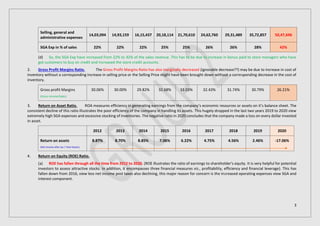
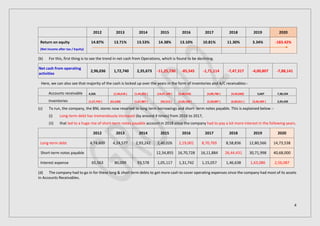
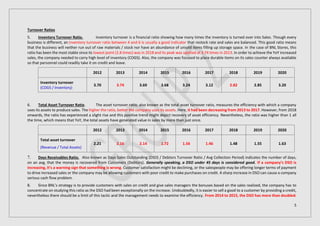
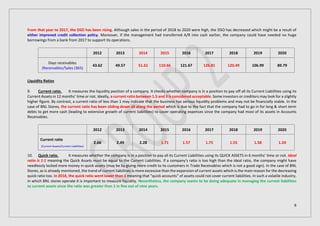
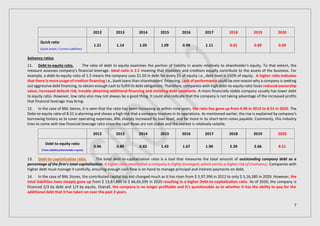
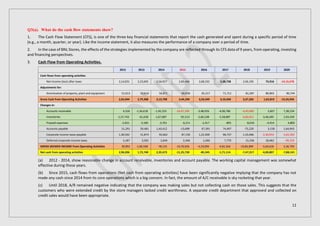
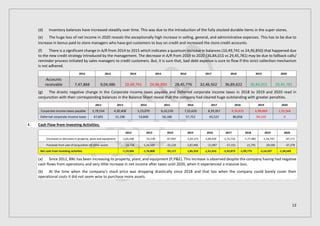
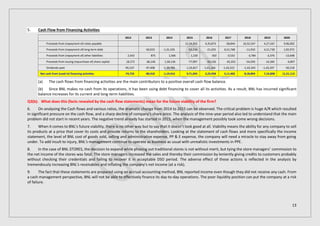
1
BNL STORES: CASE STUDY SOLUTION
PRESENTED BY – LT CDR DIVYA, LT CDR SANCHIT, LT CDR AMOUGH, LT CDR ORINDAM, LT CDR ARPIT
From the brief narrative of Case study of BNL Stores, the following are the key take aways :-
(a) BNL’s stock had fallen dramatically.
(b) New Business strategies undertaken recently :-
(i) Expand the number of BNL’s new supercenter stores, while phasing out the traditional discount stores. The supercenter stores carried a greater
selection of durable goods, such as appliances and furniture.
(ii) In order to entice customers to purchase these more expensive items, BNL had started offering store credit to its customers.
(iii) Store managers were responsible for authorizing the opening of store credit accounts and had the final say as to whether credit would be granted
to a customer.
(iv) Store managers were paid an annual bonus, based on net income for their respective store, and were known for being quite lenient in granting
credit in order to increase net income for the year and, therefore, the size of their bonus.
Q1(a): CALCULATION OF 11 RATIOS FOR EACH YEAR FROM 2018 TO 2020
1. The calculations of ratios for Years 2018 to 2020 are given in the table below (please refer the enclosed Excel workbook ‘All at One Glance’ worksheet
for the formulae used for the calculations):
Types of Ratios & Formula Used 2018 2019 2020
Profitability Ratios
Gross profit Margins (Gross Income / Sales) 31.74% 30.79% 26.21%
Net profit Margins (Net Income after taxes / sales) 2.29% 0.59% -11.82%
Return on assets (Net Income after tax / Total Assets) 4.56% 2.46% -17.06%
Return on equity (Net Income after tax / Equity) 11.30% 3.34% -183.42%
Turnover ratios
Inventory turnover (COGS/Inventory) 2.82 2.85 3.20
2
Total asset turnover (Revenue / Total Assets) 1.48 1.55 1.63
Days receivables (Receivables / Sales (365) 120.49 106.99 89.79
Liquidity ratios
Current ratio (Current Assets/Current Liabilities) 1.55 1.58 1.24
Quick ratio (Cash and cash equivalents + AR/Current Liabilities) 0.91 0.89 0.69
Solvency ratios
Debt to equity ratio (Total Liabilities/shareholders equity) 2.39 2.66 8.51
Debt to capitalization ratio (Total Liabilities / Short Term Liabilities +Long Term
Liabilities+ Share capital) 0.30 0.38 0.66
Note :- The calculation of Return on assets and Debt to capitalization ratio, not clear?
Q1(b): TRENDS NOTICED & INSIGHTS THESE TRENDS PROVIDE INTO THE OPERATIONS OF BNL
Profitability Ratios
1. Net profit Margins Ratio.
(a) The sales revenue increased tremendously (52% increase in 2020 compared to 2012).
2012 2013 2014 2015 2016 2017 2018 2019 2020
Sales 62,58,259 66,59,614 74,24,663 82,35,435 85,36,806 93,44,542 1,11,76,830 1,25,68,581 1,19,74,768
(b) However, the Net Profit Margins Ratio has declined from 3.42% in 2012 to -11.82% in 2020 (Why??).
2012 2013 2014 2015 2016 2017 2018 2019 2020
Net profit Margins
(Net Income after taxes/sales)
3.42% 3.36% 3.46% 3.44%
3.14% 2.55% 2.29% 0.59% -11.82%
(c) The fact of huge decline in Net Profit Margins Ratio could be explained due to higher operating expenses over sales earned growth.
3
Selling, general and
administrative expenses
14,03,094 14,93,159 16,15,437 20,18,114 21,70,610 24,62,760 29,31,489 35,72,857 50,47,696
SGA Exp in % of sales 22% 22% 22% 25% 25% 26% 26% 28% 42%
(d) So, the SGA Exp have increased from 22% to 42% of the sales revenue. This has to be due to increase in bonus paid to store managers who have
got customers to buy on credit and increased the store credit accounts.
2. Gross Profit Margins Ratio. The Gross Profit Margins Ratio has also marginally decreased (ignorable decrease??) may be due to increase in cost of
inventory without a corresponding increase in selling price or the Selling Price might have been brought down without a corresponding decrease in the cost of
inventory.
Gross profit Margins
(Gross Income/Sales)
30.06% 30.00% 29.82% 32.68% 33.03% 32.43% 31.74% 30.79% 26.21%
3. Return on Asset Ratio. ROA measures efficiency in generating earnings from the company’s economic resources or assets on it’s balance sheet. The
consistent decline of this ratio illustrates the poor efficiency of the company in handling its assets. This hugely dropped in the last two years 2019 to 2020 view
extremely high SGA expenses and excessive stocking of inventories. The negative ratio in 2020 concludes that the company made a loss on every dollar invested
in asset.
2012 2013 2014 2015 2016 2017 2018 2019 2020
Return on assets
(Net Income after tax / Total Assets)
8.87% 8.70% 8.85% 7.06% 6.22% 4.75% 4.56% 2.46% -17.06%
4. Return on Equity (ROE) Ratio.
(a) ROE has fallen through all the time from 2012 to 2020. (ROE illustrates the ratio of earnings to shareholder's equity. It is very helpful for potential
investors to assess attractive stocks. In addition, it encompasses three financial measures viz., profitability, efficiency and financial leverage). This has
fallen down from 2016, view less net income post taxes also declining, this major reason for concern is the increased operating expenses view SGA and
interest component.
4
2012 2013 2014 2015 2016 2017 2018 2019 2020
Return on equity
(Net Income after tax / Equity)
14.87% 13.71% 13.53% 14.38% 13.10% 10.81% 11.30% 3.34% -183.42%
(b) For this, first thing is to see the trend in net cash from Operations, which is found to be declining.
Net cash from operating
activities
2,96,036 1,72,740 2,35,673 -11,25,730 -85,545 -1,71,114 -7,47,317 -4,00,807 -7,88,141
Here, we can also see that majority of the cash is locked up over the years in the form of inventories and A/C receivables:-
Accounts receivable 4,326 (1,56,618 ) (1,45,255 ) (14,47,109 ) (3,48,926) (4,00,786 ) (4,43,060) 5,607 7,38,234
Inventories (1,57,743 ) (61,630)
-
(1,67,887 ) (92,513 ) (2,60,108 ) (2,58,887 ) (6,83,811 ) (3,46,485 ) 2,93,439
(c) To run, the company, the BNL stores now resorted to long term borrowings and short- term notes payable. This is explained below :-
(i) Long-term debt has tremendously increased (by around 4 times) from 2016 to 2017,
(ii) that led to a huge rise of short-term notes payable account in 2018 since the company had to pay a lot more interest in the following years.
2012 2013 2014 2015 2016 2017 2018 2019 2020
Long-term debt 4,74,600 4,24,577 2,93,242 2,40,026 2,19,001 8,70,769 8,58,836 12,80,566 14,73,538
Short-term notes payable 12,34,855 16,70,728 16,11,884 26,44,431 30,71,998 40,68,000
Interest expense 65,563 80,099 93,578 1,05,117 1,31,742 1,15,057 1,46,638 1,63,086 2,56,087
(d) The company had to go in for these long & short term debts to get more cash to cover operating expenses since the company had most of its assets
in Accounts Receivables.
5
Turnover Ratios
5. Inventory Turnover Ratio. Inventory turnover is a financial ratio showing how many times the inventory is turned over into Sales. Though every
business is different, an inventory turnover ratio between 4 and 6 is usually a good indicator that restock rate and sales are balanced. This good ratio means
that the business will neither run out of raw materials / stock nor have an abundance of unsold items filling up storage space. In the case of BNL Stores, this
ratio has been the most stable since its lowest point (2.8 times) was in 2018 and its peak was spotted at 3.74 times in 2013. In order to achieve the YoY increased
sales, the company needed to carry high level of inventory (COGS). Also, the company was focused to place durable items on its sales counter always available
so that personnel could readily take it on credit and leave.
2012 2013 2014 2015 2016 2017 2018 2019 2020
Inventory turnover
(COGS / Inventory)
3.70 3.74 3.69 3.68 3.24 3.12 2.82 2.85 3.20
6. Total Asset Turnover Ratio. The asset turnover ratio, also known as the total asset turnover ratio, measures the efficiency with which a company
uses its assets to produce sales. The higher the ratio, better the company uses its assets. Here, it had been decreasing from 2013 to 2017. However, from 2018
onwards, the ratio has experienced a slight rise and this positive trend might depict recovery of asset efficiency. Nevertheless, the ratio was higher than 1 all
the time, which means that YoY, the total assets have generated value in sales by more than just once.
2012 2013 2014 2015 2016 2017 2018 2019 2020
Total asset turnover
(Revenue / Total Assets)
2.21 2.16 2.14 1.72 1.56 1.46 1.48 1.55 1.63
7. Days Receivables Ratio. Also known as Days Sales Outstanding (DSO) / Debtors Turnover Ratio / Avg Collection Period) indicates the number of days,
on an avg, that the money is recovered from Customers (Debtors). Generally speaking, a DSO under 45 days is considered good. If a company’s DSO is
increasing, it's a warning sign that something is wrong. Customer satisfaction might be declining, or the salespeople may be offering longer terms of payment
to drive increased sales or the company may be allowing customers with poor credit to make purchases on credit. A sharp increase in DSO can cause a company
serious cash flow problem.
8. Since BNL's strategy is to provide customers with sales on credit and give sales managers the bonuses based on the sales realized, the company has to
concentrate on studying this ratio as the DSO had been exceptionally on the increase. Undoubtedly, it is easier to sell a good to a customer by providing a credit,
nevertheless there should be a limit of this tactic and the management needs to examine the efficiency. From 2014 to 2015, the DSO has more than doubled.
6
From that year to 2017, the DSO has been rising. Although sales in the period of 2018 to 2020 were high, the DSO has decreased which might be a result of
either improved credit collection policy. Moreover, if the management had transferred A/R into cash earlier, the company could have needed no huge
borrowings from a bank from 2017 to support its operations.
2012 2013 2014 2015 2016 2017 2018 2019 2020
Days receivables
(Receivables/Sales (365)
43.62 49.57 51.61 110.66 121.67 126.81 120.49 106.99 89.79
Liquidity Ratios
9. Current ratio. It measures the liquidity position of a company. It checks whether company is in a position to pay off all its Current Liabilities using its
Current Assets in 12 months’ time or not. Ideally, a current ratio between 1.5 and 3 is considered acceptable. Some investors or creditors may look for a slightly
higher figure. By contrast, a current ratio of less than 1 may indicate that the business has serious liquidity problems and may not be financially stable. In the
case of BNL Stores, the current ratio has been sliding down all along the period which is due to the fact that the company had to go in for long & short term
debts to get more cash (leading to extensive growth of current liabilities) to cover operating expenses since the company had most of its assets in Accounts
Receivables.
2012 2013 2014 2015 2016 2017 2018 2019 2020
Current ratio
(Current Assets/Current Liabilities)
2.66 2.49 2.28 1.71 1.57 1.75 1.55 1.58 1.24
10. Quick ratio. It measures whether the company is in a position to pay all its Current Liabilities using its QUICK ASSETS in 6 months’ time or not. Ideal
ratio is 1:1 meaning the Quick Assets must be equal to the Current Liabilities. If a company's ratio is too high than the ideal ratio, the company might have
needlessly locked more money in quick assets (may be by giving more credit to its customers in Trade Receivables which is not a good sign). In the case of BNL
Stores, as is already mentioned, the trend of current liabilities is more excessive than the expansion of current assets which is the main reason for the decreasing
quick ratio too. In 2018, the quick ratio went Iower than 1 meaning that "quick accounts" of assets could not cover current liabilities. In such a volatile industry,
in which BNL stores operate it is important to measure liquidity. Nevertheless, the company seems to be doing adequate in managing the current liabilities
to current assets since the ratio was greater than 1 in five out of nine years.
7
2012 2013 2014 2015 2016 2017 2018 2019 2020
Quick ratio
(Quick Assets / Current Liabilities)
1.21 1.14 1.05 1.09 0.99 1.11 0.91 0.89 0.69
Solvency ratios
11. Debt to equity ratio. The ratio of debt to equity examines the portion of liability in assets relatively to shareholder's equity. To that extent, the
measure assesses company's financial leverage. Ideal ratio is 1:1 meaning that investors and creditors equally contribute to the assets of the business. For
example, a debt-to-equity ratio of 1.5 means the company uses $1.50 in debt for every $1 of equity i.e., debt level is 150% of equity. A higher ratio indicates
that there is more usage of creditor financing i.e., bank loans than shareholders’ financing. Lack of performance could be one reason why a company is seeking
out aggressive debt financing, to obtain enough cash to fulfill its debt obligations. Therefore, companies with high debt-to-equity ratio faces reduced ownership
value, increased default risk, trouble obtaining additional financing and violating debt covenants. A more financially stable company usually has lower debt
to equity ratio. However, low ratio also may not always be a good thing. It could also indicate that the company is not taking advantage of the increased profits
that financial leverage may bring.
12. In the case of BNL Stores, it is seen that the ratio has been increasing as within nine years, the ratio has gone up from 0.96 in 2012 to 8.51 in 2020. The
Debt-to-equity ratio of 8.51 is alarming and shows a high risk that a company involves in its operations. As mentioned earlier, the rise is explained by company's
borrowing history as to cover operating expenses, BNL sharply increased its loan level, and far more in its short-term notes payable. Commonly, this industry
tries to come with low financial leverage ratio since the cash flows are not stable and the market is relatively volatile.
2012 2013 2014 2015 2016 2017 2018 2019 2020
Debt to equity ratio
(Total Liabilities/shareholders equity)
0.96 0.89 0.82 1.43 1.67 1.90 2.39 2.66 8.51
13. Debt-to-capitalization ratio. The total debt-to-capitalization ratio is a tool that measures the total amount of outstanding company debt as a
percentage of the firm’s total capitalization. A higher ratio means that a company is highly leveraged, which carries a higher risk of insolvency. Companies with
higher debt must manage it carefully, ensuring enough cash flow is on hand to manage principal and interest payments on debt.
14. In the case of BNL Stores, the contributed capital has not changed much as it has risen from $ 3,97,396 in 2012 to only $ 5,16,385 in 2020. However, the
total liabilities have steeply gone up from $ 13,87,880 to $ 66,65,595 in 2020 resulting in a higher Debt-to-capitalization ratio. As of 2020, the company is
financed 2/3 by debt and 1/3 by equity. Overall, the company is no longer profitable and it’s questionable as to whether it has the ability to pay for the
additional debt that it has taken on over the past 2 years.
8
2012 2013 2014 2015 2016 2017 2018 2019 2020
Debt to capitalization
ratio
(Total Liabilities/ Total
liabilities
+ Share capital)
0.58 0.52 0.39 0.38 0.39 0.64 0.30 0.38 0.66
Total Liability 13,87,880 14,53,592 15,62,541 28,21,207 34,27,914 41,96,310 52,63,722 58,90,309 65,65,955
Share Capital 3,97,396 4,63,542 6,13,678 5,35,681 4,85,455 5,50,787 4,96,194 5,10,378 5,16,385
15. Imponderables.
(a) BNL had strategized to focus on increasing its sales by offering huge credits without caring to maintain favorable cash flow.
(b) 2019 & 2020 showed an extremely Iow profitability ratios, though the sales amount in both these years were the highest within nine years.
(c) In 2020, the operating loss was more than 2 billion US dollars ($ -22,55,909).
(d) Furthermore, more than 40% of sales was accounted for selling costs.
(e) Although the operating income was negative in 2020, the company still paid out dividends. It could be because the company wanted to keep its
investors. Conversely, a company that pays dividends from no income but debt, should create a concern of any investor.
16. Conclusion. The analysis of financial performance reveals that the nine-year period from 2012 to 2020, may be divided into three phases:
(a) Phase 1 (Period of Stability): 2012 to 2013. There was a slight decline in several ratios, but the financial output did not significantly fluctuate.
(b) Phase 2 (Turn-down Period): 2014 to 2018. This period's failure was mainly due to management's decision to increase sales by selling on credit
and by making Accounts Receivable to climb up high and not creating an essential balance.
(c) Phase 3 (Breakdown Period): 2019 to 2020. Point from where it would be difficult for the company to recover unless the right and well analyzed
decisions are made.
Q 2. Following the format given in Exhibit 3, prepare statements of cash flows for BNL for each year from 2018 to 2020. Please use the following
9
figures for the additions to property, plant and equipment:
2018 2019 2020
(Increase) or decrease in property, plant and equipment (177,982) (154,747) (97,171)
1. The statements of cash flows for Years 2018 to 2020 are given in the table below (please refer the enclosed Excel workbook ‘All at One Glance’
worksheet for the formulae used for the calculations):
2018 2019 2020
Cash flows from operating activities
Net Income (loss) after taxes 2,56,195 73,916 -14,15,678
Adjustments for:
Amortization of property, plant and equipment 81,387 89,903 90,744
Gross Cash from Operating Activities 3,37,582 1,63,819 -13,24,934
Changes in:
Accounts receivable -4,43,060 5,607 7,38,234
Inventories -6,83,811 -3,46,485 2,93,439
Prepaid expenses -8,610 -4,414 4,800
Accounts payable -75,220 3,158 1,64,943
Corporate income taxes payable 1,10,466 -2,40,954 -5,65,303
Deferred corporate income taxes 15,336 18,462 -99,320
GROSS DEEMED INCOME FROM Opg Acitivities -10,84,899 -5,64,626 5,36,793
Net cash from operating activities -7,47,317 -4,00,807 -7,88,141
Cash flows from investing activities
(Increase) or decrease in property, plant and equipment -1,77,982 -1,54,747 -97,171
Proceeds from sale of (acquisition of) other assets -21,791 -59,590 -37,378
Net cash from investing activities -1,99,773 -2,14,337 -1,34,549
Cash flows from financing activities
10
2018 2019 2020
Proceeds from (repayment of) notes payable 10,32,547 4,27,567 9,96,002
Proceeds from (repayment of) long-term debt -11,933 4,21,730 1,92,972
Proceeds from (repayment of) other liabilities -3,784 -3,376 -13,648
Proceeds from issuing (repurchase of) share capital -54,593 14,184 6,007
Dividends paid -1,43,343 1,43,207 -30,218
Net cash from (used in) financing activities 8,18,894 10,03,312 11,51,115
Net increase (decrease) in cash and cash equivalents -1,28,196 1,01,754 2,28,425
Opening balance, cash and cash equivalents 3,37,990 2,09,794 3,11,548
Closing balance, cash and cash equivalents 2,09,794 3,11,548 5,39,973
11
Q3(a). What do the cash flow statements show?
1. The Cash Flow Statement (CFS), is one of the three key financial statements that report the cash generated and spent during a specific period of time
(e.g., a month, quarter, or year). Like the income statement, it also measures the performance of a company over a period of time.
2. In the case of BNL Stores, the effects of the strategies implemented by the company are reflected through its CFS data of 9 years, from operating, investing
and financing perspectives.
3. Cash Flow from Operating Activities.
2012 2013 2014 2015 2016 2017 2018 2019 2020
Cash flows from operating activities
Net Income (loss) after taxes 2,14,031 2,23,692 2,56,927 2,83,466 2,68,332 2,38,738 2,56,195 73,916 -14,15,678
Adjustments for:
Amortization of property, plant and equipment 51,013 55,616 56,871 60,830 65,217 71,712 81,387 89,903 90,744
Gross Cash from Operating Activities 2,65,044 2,79,308 3,13,798 3,44,296 3,33,549 3,10,450 3,37,582 1,63,819 -13,24,934
Changes in:
Accounts receivable 4,326 -1,56,618 -1,45,255 -14,47,109 -3,48,926 -4,00,786 -4,43,060 5,607 7,38,234
Inventories -1,57,743 -61,630 -1,67,887 -92,513 -2,60,108 -2,58,887 -6,83,811 -3,46,485 2,93,439
Prepaid expenses -2,631 -3,180 -3,701 -6,211 -1,417 -895 -8,610 -4,414 4,800
Accounts payable 51,291 59,481 1,43,412 -13,689 67,391 74,497 -75,220 3,158 1,64,943
Corporate income taxes payable 1,30,562 51,874 92,662 87,150 1,22,400 96,737 1,10,466 -2,40,954 -5,65,303
Deferred corporate income taxes 5,187 3,505 2,644 2,346 1,566 7,770 15,336 18,462 -99,320
GROSS DEEMED INCOME From Operating Activities 30,992 -1,06,568 -78,125 -14,70,026 -4,19,094 -4,81,564 -10,84,899 -5,64,626 5,36,793
Net cash from operating activities 2,96,036 1,72,740 2,35,673 -11,25,730 -85,545 -1,71,114 -7,47,317 -4,00,807 -7,88,141
(a) 2012 - 2014, show reasonable change in account receivable, inventories and account payable. The working capital management was somewhat
effective during those years.
(b) Since 2015, cash flows from operations (Net cash from operating activities) have been significantly negative implying that the company has not
made any cash since 2014 from its core operations which is a big concern. In fact, the amount of A/C receivable is sky rocketing that year.
(c) Until 2018, A/R remained negative indicating that the company was making sales but not collecting cash on those sales. This suggests that the
customers who were extended credit by the store managers lacked credit worthiness. A separate credit department that approved and collected on
credit sales would have been appropriate.
12
(d) Inventory balances have increased steadily over time. This was due to the introduction of the fully stocked durable items in the super stores.
(e) The huge loss of net income in 2020 reveals the exceptionally high increase in selling, general, and administrative expenses. This has to be due to
increase in bonus paid to store managers who have got customers to buy on credit and increased the store credit accounts.
(f) There is a significant change in A/R from 2014 to 2015 which indicates a quantum increase in balances (10,49,741 vs 24,96,850) that happened due
to the new credit strategy introduced by the management. The decrease in A/R from 2019 to 2020 (36,84,015 vs 29,45,781) may be due to fallback calls/
reminder process initiated by sales managers to credit customers. But, it is sure that, bad debt expense is sure to flow if this strict collection mechanism
is not adhered.
2012 2013 2014 2015 2016 2017 2018 2019 2020
Accounts
receivable 7,47,868 9,04,486 10,49,741 24,96,850 28,45,776 32,46,562 36,89,622 36,84,015 29,45,781
(g) The drastic negative change in the Corporate income taxes payable and Deferred corporate income taxes in 2018 to 2019 and 2020 read in
conjunction with their corresponding balances in the Balance Sheet reveal that the company had cleared huge outstanding with greater penalties.
2012 2013 2014 2015 2016 2017 2018 2019 2020
Corporate income taxes payable 3,78,534 4,30,408 5,23,070 6,10,220 7,32,620 8,29,357 9,39,823 6,98,869 1,33,566
Deferred corporate income taxes 47,691 51,196 53,840 56,186 57,752 65,522 80,858 99,320 0
4. Cash Flow from Investing Activities.
2012 2013 2014 2015 2016 2017 2018 2019 2020
(Increase) or decrease in property, plant and equipment -1,03,240 -52,239 -67,997 -1,02,175 -1,09,429 -1,75,724 -1,77,982 -1,54,747 -97,171
Proceeds from sale of (acquisition of) other assets -16,726 -1,24,569 -25,120 2,87,485 -21,987 -57,155 -21,791 -59,590 -37,378
Net cash from investing activities -1,19,966 -1,76,808 -93,117 1,85,310 -1,31,416 -2,32,879 -1,99,773 -2,14,337 -1,34,549
(a) Since 2012, BNL has been increasing its property, plant, and equipment (P,P&E). This increase is observed despite the company having had negative
cash flows from operations and very little increase in net income after taxes until 2020, when it experienced a massive loss.
(b) At the time when the company's stock price was dropping drastically since 2018 and that too when the company could barely cover their
operational costs it did not seem wise to purchase more assets.
13
5. Cash Flow from Financing Activities.
2012 2013 2014 2015 2016 2017 2018 2019 2020
Proceeds from (repayment of) notes payable 12,34,855 4,35,873 -58,844 10,32,547 4,27,567 9,96,002
Proceeds from (repayment of) long-term debt -50,023 -1,31,335 -53,216 -21,025 6,51,768 -11,933 4,21,730 1,92,972
Proceeds from (repayment of) other liabilities 2,542 875 1,566 1,220 502 -3,532 -3,784 -3,376 -13,648
Proceeds from issuing (repurchase of) share capital 18,272 66,146 1,50,136 -77,997 -50,226 65,332 -54,593 14,184 6,007
Dividends paid -95,537 -97,408 -1,39,783 -1,33,817 -1,41,166 -1,43,322 -1,43,343 -1,43,207 -30,218
Net cash from (used in) financing activities -74,723 -80,410 -1,19,416 9,71,045 2,23,958 5,11,402 8,18,894 7,16,898 11,51,115
(a) The cash flows from financing activities are the main contributors to a positive overall cash flow balance.
(b) Since BNL makes no cash from its operations, it has been using debt financing to cover all its activities. As a result, BNL has incurred significant
balance increases for its current and long-term liabilities.
Q3(b). What does this (facts revealed by the cash flow statements) mean for the future viability of the firm?
6. On analysing the Cash flows and various ratios, the dramatic change from 2014 to 2015 can be observed. The critical problem is huge A/R which resulted
in significant pressure on the cash flow, and a sharp decline of company's share price. The analysis of the nine-year period also led to understand that the main
problem did not start in recent years. The negative trend already has started in 2015, when the management possibly took some wrong decisions.
7. When it comes to BNL's future viability, there is no other way but to say that it doesn’t look good at all. Viability means the ability for any company to sell
its products at a price that cover its costs and provide returns to the shareholders. Looking at the statement of cash flows and more specifically the income
statement, the level of BNL cost of goods sold, selling and administrative expense, PP & E expense, the company will need a miracle to stay away from going
under. To add insult to injury, BNL's management continue to operate as business as usual with unrealistic investments in PPE.
8. In the case of BNL STORES, the decision to expand while phasing out traditional stores is not without merit, but tying the store managers’ commission to
the net income of the stores was fatal. The store managers increased the sales and thereby their commission by leniently giving credits to customers probably
without checking their credentials and failing to recover it in acceptable DSO period. The adverse effect of these actions is reflected in the analysis by
tremendously increasing BNL's receivables and inflating the company's net income (at a risk).
9. The fact that these statements are prepared using an accrual accounting method, BNL reported income even though they did not receive any cash. From
a cash management perspective, BNL will not be able to effectively finance its day-to-day operations. The poor liquidity position can put the company at a risk
of failure.
14
Q3(c). How helpful is this analysis (the cash flow analysis) in understanding the company’s stock price performance?
10. Given their cash flow problems, it is surprising that BNL has continued to pay out a substantial dividend. The company might have done this to prevent a
loss of investor confidence. However, their operational issues are reflected in the significant drop in their stock price. Investors have already lost confidence.
11. Conclusion. BNL Stores is in dire need of a budding financial analyst graduating from the ‘Business Management’ course from NITIE, Mumbai to
bail out the company, else the sound of death bell ringing from the Wall Street recommending a ‘sell out’ option could be hard very loud and clear.
********************

Group 2- BNL Stores Case Study Analaysis.pdf

  • 1.
    1 BNL STORES: CASESTUDY SOLUTION PRESENTED BY – LT CDR DIVYA, LT CDR SANCHIT, LT CDR AMOUGH, LT CDR ORINDAM, LT CDR ARPIT From the brief narrative of Case study of BNL Stores, the following are the key take aways :- (a) BNL’s stock had fallen dramatically. (b) New Business strategies undertaken recently :- (i) Expand the number of BNL’s new supercenter stores, while phasing out the traditional discount stores. The supercenter stores carried a greater selection of durable goods, such as appliances and furniture. (ii) In order to entice customers to purchase these more expensive items, BNL had started offering store credit to its customers. (iii) Store managers were responsible for authorizing the opening of store credit accounts and had the final say as to whether credit would be granted to a customer. (iv) Store managers were paid an annual bonus, based on net income for their respective store, and were known for being quite lenient in granting credit in order to increase net income for the year and, therefore, the size of their bonus. Q1(a): CALCULATION OF 11 RATIOS FOR EACH YEAR FROM 2018 TO 2020 1. The calculations of ratios for Years 2018 to 2020 are given in the table below (please refer the enclosed Excel workbook ‘All at One Glance’ worksheet for the formulae used for the calculations): Types of Ratios & Formula Used 2018 2019 2020 Profitability Ratios Gross profit Margins (Gross Income / Sales) 31.74% 30.79% 26.21% Net profit Margins (Net Income after taxes / sales) 2.29% 0.59% -11.82% Return on assets (Net Income after tax / Total Assets) 4.56% 2.46% -17.06% Return on equity (Net Income after tax / Equity) 11.30% 3.34% -183.42% Turnover ratios Inventory turnover (COGS/Inventory) 2.82 2.85 3.20
  • 2.
    2 Total asset turnover(Revenue / Total Assets) 1.48 1.55 1.63 Days receivables (Receivables / Sales (365) 120.49 106.99 89.79 Liquidity ratios Current ratio (Current Assets/Current Liabilities) 1.55 1.58 1.24 Quick ratio (Cash and cash equivalents + AR/Current Liabilities) 0.91 0.89 0.69 Solvency ratios Debt to equity ratio (Total Liabilities/shareholders equity) 2.39 2.66 8.51 Debt to capitalization ratio (Total Liabilities / Short Term Liabilities +Long Term Liabilities+ Share capital) 0.30 0.38 0.66 Note :- The calculation of Return on assets and Debt to capitalization ratio, not clear? Q1(b): TRENDS NOTICED & INSIGHTS THESE TRENDS PROVIDE INTO THE OPERATIONS OF BNL Profitability Ratios 1. Net profit Margins Ratio. (a) The sales revenue increased tremendously (52% increase in 2020 compared to 2012). 2012 2013 2014 2015 2016 2017 2018 2019 2020 Sales 62,58,259 66,59,614 74,24,663 82,35,435 85,36,806 93,44,542 1,11,76,830 1,25,68,581 1,19,74,768 (b) However, the Net Profit Margins Ratio has declined from 3.42% in 2012 to -11.82% in 2020 (Why??). 2012 2013 2014 2015 2016 2017 2018 2019 2020 Net profit Margins (Net Income after taxes/sales) 3.42% 3.36% 3.46% 3.44% 3.14% 2.55% 2.29% 0.59% -11.82% (c) The fact of huge decline in Net Profit Margins Ratio could be explained due to higher operating expenses over sales earned growth.
  • 3.
    3 Selling, general and administrativeexpenses 14,03,094 14,93,159 16,15,437 20,18,114 21,70,610 24,62,760 29,31,489 35,72,857 50,47,696 SGA Exp in % of sales 22% 22% 22% 25% 25% 26% 26% 28% 42% (d) So, the SGA Exp have increased from 22% to 42% of the sales revenue. This has to be due to increase in bonus paid to store managers who have got customers to buy on credit and increased the store credit accounts. 2. Gross Profit Margins Ratio. The Gross Profit Margins Ratio has also marginally decreased (ignorable decrease??) may be due to increase in cost of inventory without a corresponding increase in selling price or the Selling Price might have been brought down without a corresponding decrease in the cost of inventory. Gross profit Margins (Gross Income/Sales) 30.06% 30.00% 29.82% 32.68% 33.03% 32.43% 31.74% 30.79% 26.21% 3. Return on Asset Ratio. ROA measures efficiency in generating earnings from the company’s economic resources or assets on it’s balance sheet. The consistent decline of this ratio illustrates the poor efficiency of the company in handling its assets. This hugely dropped in the last two years 2019 to 2020 view extremely high SGA expenses and excessive stocking of inventories. The negative ratio in 2020 concludes that the company made a loss on every dollar invested in asset. 2012 2013 2014 2015 2016 2017 2018 2019 2020 Return on assets (Net Income after tax / Total Assets) 8.87% 8.70% 8.85% 7.06% 6.22% 4.75% 4.56% 2.46% -17.06% 4. Return on Equity (ROE) Ratio. (a) ROE has fallen through all the time from 2012 to 2020. (ROE illustrates the ratio of earnings to shareholder's equity. It is very helpful for potential investors to assess attractive stocks. In addition, it encompasses three financial measures viz., profitability, efficiency and financial leverage). This has fallen down from 2016, view less net income post taxes also declining, this major reason for concern is the increased operating expenses view SGA and interest component.
  • 4.
    4 2012 2013 20142015 2016 2017 2018 2019 2020 Return on equity (Net Income after tax / Equity) 14.87% 13.71% 13.53% 14.38% 13.10% 10.81% 11.30% 3.34% -183.42% (b) For this, first thing is to see the trend in net cash from Operations, which is found to be declining. Net cash from operating activities 2,96,036 1,72,740 2,35,673 -11,25,730 -85,545 -1,71,114 -7,47,317 -4,00,807 -7,88,141 Here, we can also see that majority of the cash is locked up over the years in the form of inventories and A/C receivables:- Accounts receivable 4,326 (1,56,618 ) (1,45,255 ) (14,47,109 ) (3,48,926) (4,00,786 ) (4,43,060) 5,607 7,38,234 Inventories (1,57,743 ) (61,630) - (1,67,887 ) (92,513 ) (2,60,108 ) (2,58,887 ) (6,83,811 ) (3,46,485 ) 2,93,439 (c) To run, the company, the BNL stores now resorted to long term borrowings and short- term notes payable. This is explained below :- (i) Long-term debt has tremendously increased (by around 4 times) from 2016 to 2017, (ii) that led to a huge rise of short-term notes payable account in 2018 since the company had to pay a lot more interest in the following years. 2012 2013 2014 2015 2016 2017 2018 2019 2020 Long-term debt 4,74,600 4,24,577 2,93,242 2,40,026 2,19,001 8,70,769 8,58,836 12,80,566 14,73,538 Short-term notes payable 12,34,855 16,70,728 16,11,884 26,44,431 30,71,998 40,68,000 Interest expense 65,563 80,099 93,578 1,05,117 1,31,742 1,15,057 1,46,638 1,63,086 2,56,087 (d) The company had to go in for these long & short term debts to get more cash to cover operating expenses since the company had most of its assets in Accounts Receivables.
  • 5.
    5 Turnover Ratios 5. InventoryTurnover Ratio. Inventory turnover is a financial ratio showing how many times the inventory is turned over into Sales. Though every business is different, an inventory turnover ratio between 4 and 6 is usually a good indicator that restock rate and sales are balanced. This good ratio means that the business will neither run out of raw materials / stock nor have an abundance of unsold items filling up storage space. In the case of BNL Stores, this ratio has been the most stable since its lowest point (2.8 times) was in 2018 and its peak was spotted at 3.74 times in 2013. In order to achieve the YoY increased sales, the company needed to carry high level of inventory (COGS). Also, the company was focused to place durable items on its sales counter always available so that personnel could readily take it on credit and leave. 2012 2013 2014 2015 2016 2017 2018 2019 2020 Inventory turnover (COGS / Inventory) 3.70 3.74 3.69 3.68 3.24 3.12 2.82 2.85 3.20 6. Total Asset Turnover Ratio. The asset turnover ratio, also known as the total asset turnover ratio, measures the efficiency with which a company uses its assets to produce sales. The higher the ratio, better the company uses its assets. Here, it had been decreasing from 2013 to 2017. However, from 2018 onwards, the ratio has experienced a slight rise and this positive trend might depict recovery of asset efficiency. Nevertheless, the ratio was higher than 1 all the time, which means that YoY, the total assets have generated value in sales by more than just once. 2012 2013 2014 2015 2016 2017 2018 2019 2020 Total asset turnover (Revenue / Total Assets) 2.21 2.16 2.14 1.72 1.56 1.46 1.48 1.55 1.63 7. Days Receivables Ratio. Also known as Days Sales Outstanding (DSO) / Debtors Turnover Ratio / Avg Collection Period) indicates the number of days, on an avg, that the money is recovered from Customers (Debtors). Generally speaking, a DSO under 45 days is considered good. If a company’s DSO is increasing, it's a warning sign that something is wrong. Customer satisfaction might be declining, or the salespeople may be offering longer terms of payment to drive increased sales or the company may be allowing customers with poor credit to make purchases on credit. A sharp increase in DSO can cause a company serious cash flow problem. 8. Since BNL's strategy is to provide customers with sales on credit and give sales managers the bonuses based on the sales realized, the company has to concentrate on studying this ratio as the DSO had been exceptionally on the increase. Undoubtedly, it is easier to sell a good to a customer by providing a credit, nevertheless there should be a limit of this tactic and the management needs to examine the efficiency. From 2014 to 2015, the DSO has more than doubled.
  • 6.
    6 From that yearto 2017, the DSO has been rising. Although sales in the period of 2018 to 2020 were high, the DSO has decreased which might be a result of either improved credit collection policy. Moreover, if the management had transferred A/R into cash earlier, the company could have needed no huge borrowings from a bank from 2017 to support its operations. 2012 2013 2014 2015 2016 2017 2018 2019 2020 Days receivables (Receivables/Sales (365) 43.62 49.57 51.61 110.66 121.67 126.81 120.49 106.99 89.79 Liquidity Ratios 9. Current ratio. It measures the liquidity position of a company. It checks whether company is in a position to pay off all its Current Liabilities using its Current Assets in 12 months’ time or not. Ideally, a current ratio between 1.5 and 3 is considered acceptable. Some investors or creditors may look for a slightly higher figure. By contrast, a current ratio of less than 1 may indicate that the business has serious liquidity problems and may not be financially stable. In the case of BNL Stores, the current ratio has been sliding down all along the period which is due to the fact that the company had to go in for long & short term debts to get more cash (leading to extensive growth of current liabilities) to cover operating expenses since the company had most of its assets in Accounts Receivables. 2012 2013 2014 2015 2016 2017 2018 2019 2020 Current ratio (Current Assets/Current Liabilities) 2.66 2.49 2.28 1.71 1.57 1.75 1.55 1.58 1.24 10. Quick ratio. It measures whether the company is in a position to pay all its Current Liabilities using its QUICK ASSETS in 6 months’ time or not. Ideal ratio is 1:1 meaning the Quick Assets must be equal to the Current Liabilities. If a company's ratio is too high than the ideal ratio, the company might have needlessly locked more money in quick assets (may be by giving more credit to its customers in Trade Receivables which is not a good sign). In the case of BNL Stores, as is already mentioned, the trend of current liabilities is more excessive than the expansion of current assets which is the main reason for the decreasing quick ratio too. In 2018, the quick ratio went Iower than 1 meaning that "quick accounts" of assets could not cover current liabilities. In such a volatile industry, in which BNL stores operate it is important to measure liquidity. Nevertheless, the company seems to be doing adequate in managing the current liabilities to current assets since the ratio was greater than 1 in five out of nine years.
  • 7.
    7 2012 2013 20142015 2016 2017 2018 2019 2020 Quick ratio (Quick Assets / Current Liabilities) 1.21 1.14 1.05 1.09 0.99 1.11 0.91 0.89 0.69 Solvency ratios 11. Debt to equity ratio. The ratio of debt to equity examines the portion of liability in assets relatively to shareholder's equity. To that extent, the measure assesses company's financial leverage. Ideal ratio is 1:1 meaning that investors and creditors equally contribute to the assets of the business. For example, a debt-to-equity ratio of 1.5 means the company uses $1.50 in debt for every $1 of equity i.e., debt level is 150% of equity. A higher ratio indicates that there is more usage of creditor financing i.e., bank loans than shareholders’ financing. Lack of performance could be one reason why a company is seeking out aggressive debt financing, to obtain enough cash to fulfill its debt obligations. Therefore, companies with high debt-to-equity ratio faces reduced ownership value, increased default risk, trouble obtaining additional financing and violating debt covenants. A more financially stable company usually has lower debt to equity ratio. However, low ratio also may not always be a good thing. It could also indicate that the company is not taking advantage of the increased profits that financial leverage may bring. 12. In the case of BNL Stores, it is seen that the ratio has been increasing as within nine years, the ratio has gone up from 0.96 in 2012 to 8.51 in 2020. The Debt-to-equity ratio of 8.51 is alarming and shows a high risk that a company involves in its operations. As mentioned earlier, the rise is explained by company's borrowing history as to cover operating expenses, BNL sharply increased its loan level, and far more in its short-term notes payable. Commonly, this industry tries to come with low financial leverage ratio since the cash flows are not stable and the market is relatively volatile. 2012 2013 2014 2015 2016 2017 2018 2019 2020 Debt to equity ratio (Total Liabilities/shareholders equity) 0.96 0.89 0.82 1.43 1.67 1.90 2.39 2.66 8.51 13. Debt-to-capitalization ratio. The total debt-to-capitalization ratio is a tool that measures the total amount of outstanding company debt as a percentage of the firm’s total capitalization. A higher ratio means that a company is highly leveraged, which carries a higher risk of insolvency. Companies with higher debt must manage it carefully, ensuring enough cash flow is on hand to manage principal and interest payments on debt. 14. In the case of BNL Stores, the contributed capital has not changed much as it has risen from $ 3,97,396 in 2012 to only $ 5,16,385 in 2020. However, the total liabilities have steeply gone up from $ 13,87,880 to $ 66,65,595 in 2020 resulting in a higher Debt-to-capitalization ratio. As of 2020, the company is financed 2/3 by debt and 1/3 by equity. Overall, the company is no longer profitable and it’s questionable as to whether it has the ability to pay for the additional debt that it has taken on over the past 2 years.
  • 8.
    8 2012 2013 20142015 2016 2017 2018 2019 2020 Debt to capitalization ratio (Total Liabilities/ Total liabilities + Share capital) 0.58 0.52 0.39 0.38 0.39 0.64 0.30 0.38 0.66 Total Liability 13,87,880 14,53,592 15,62,541 28,21,207 34,27,914 41,96,310 52,63,722 58,90,309 65,65,955 Share Capital 3,97,396 4,63,542 6,13,678 5,35,681 4,85,455 5,50,787 4,96,194 5,10,378 5,16,385 15. Imponderables. (a) BNL had strategized to focus on increasing its sales by offering huge credits without caring to maintain favorable cash flow. (b) 2019 & 2020 showed an extremely Iow profitability ratios, though the sales amount in both these years were the highest within nine years. (c) In 2020, the operating loss was more than 2 billion US dollars ($ -22,55,909). (d) Furthermore, more than 40% of sales was accounted for selling costs. (e) Although the operating income was negative in 2020, the company still paid out dividends. It could be because the company wanted to keep its investors. Conversely, a company that pays dividends from no income but debt, should create a concern of any investor. 16. Conclusion. The analysis of financial performance reveals that the nine-year period from 2012 to 2020, may be divided into three phases: (a) Phase 1 (Period of Stability): 2012 to 2013. There was a slight decline in several ratios, but the financial output did not significantly fluctuate. (b) Phase 2 (Turn-down Period): 2014 to 2018. This period's failure was mainly due to management's decision to increase sales by selling on credit and by making Accounts Receivable to climb up high and not creating an essential balance. (c) Phase 3 (Breakdown Period): 2019 to 2020. Point from where it would be difficult for the company to recover unless the right and well analyzed decisions are made. Q 2. Following the format given in Exhibit 3, prepare statements of cash flows for BNL for each year from 2018 to 2020. Please use the following
  • 9.
    9 figures for theadditions to property, plant and equipment: 2018 2019 2020 (Increase) or decrease in property, plant and equipment (177,982) (154,747) (97,171) 1. The statements of cash flows for Years 2018 to 2020 are given in the table below (please refer the enclosed Excel workbook ‘All at One Glance’ worksheet for the formulae used for the calculations): 2018 2019 2020 Cash flows from operating activities Net Income (loss) after taxes 2,56,195 73,916 -14,15,678 Adjustments for: Amortization of property, plant and equipment 81,387 89,903 90,744 Gross Cash from Operating Activities 3,37,582 1,63,819 -13,24,934 Changes in: Accounts receivable -4,43,060 5,607 7,38,234 Inventories -6,83,811 -3,46,485 2,93,439 Prepaid expenses -8,610 -4,414 4,800 Accounts payable -75,220 3,158 1,64,943 Corporate income taxes payable 1,10,466 -2,40,954 -5,65,303 Deferred corporate income taxes 15,336 18,462 -99,320 GROSS DEEMED INCOME FROM Opg Acitivities -10,84,899 -5,64,626 5,36,793 Net cash from operating activities -7,47,317 -4,00,807 -7,88,141 Cash flows from investing activities (Increase) or decrease in property, plant and equipment -1,77,982 -1,54,747 -97,171 Proceeds from sale of (acquisition of) other assets -21,791 -59,590 -37,378 Net cash from investing activities -1,99,773 -2,14,337 -1,34,549 Cash flows from financing activities
  • 10.
    10 2018 2019 2020 Proceedsfrom (repayment of) notes payable 10,32,547 4,27,567 9,96,002 Proceeds from (repayment of) long-term debt -11,933 4,21,730 1,92,972 Proceeds from (repayment of) other liabilities -3,784 -3,376 -13,648 Proceeds from issuing (repurchase of) share capital -54,593 14,184 6,007 Dividends paid -1,43,343 1,43,207 -30,218 Net cash from (used in) financing activities 8,18,894 10,03,312 11,51,115 Net increase (decrease) in cash and cash equivalents -1,28,196 1,01,754 2,28,425 Opening balance, cash and cash equivalents 3,37,990 2,09,794 3,11,548 Closing balance, cash and cash equivalents 2,09,794 3,11,548 5,39,973
  • 11.
    11 Q3(a). What dothe cash flow statements show? 1. The Cash Flow Statement (CFS), is one of the three key financial statements that report the cash generated and spent during a specific period of time (e.g., a month, quarter, or year). Like the income statement, it also measures the performance of a company over a period of time. 2. In the case of BNL Stores, the effects of the strategies implemented by the company are reflected through its CFS data of 9 years, from operating, investing and financing perspectives. 3. Cash Flow from Operating Activities. 2012 2013 2014 2015 2016 2017 2018 2019 2020 Cash flows from operating activities Net Income (loss) after taxes 2,14,031 2,23,692 2,56,927 2,83,466 2,68,332 2,38,738 2,56,195 73,916 -14,15,678 Adjustments for: Amortization of property, plant and equipment 51,013 55,616 56,871 60,830 65,217 71,712 81,387 89,903 90,744 Gross Cash from Operating Activities 2,65,044 2,79,308 3,13,798 3,44,296 3,33,549 3,10,450 3,37,582 1,63,819 -13,24,934 Changes in: Accounts receivable 4,326 -1,56,618 -1,45,255 -14,47,109 -3,48,926 -4,00,786 -4,43,060 5,607 7,38,234 Inventories -1,57,743 -61,630 -1,67,887 -92,513 -2,60,108 -2,58,887 -6,83,811 -3,46,485 2,93,439 Prepaid expenses -2,631 -3,180 -3,701 -6,211 -1,417 -895 -8,610 -4,414 4,800 Accounts payable 51,291 59,481 1,43,412 -13,689 67,391 74,497 -75,220 3,158 1,64,943 Corporate income taxes payable 1,30,562 51,874 92,662 87,150 1,22,400 96,737 1,10,466 -2,40,954 -5,65,303 Deferred corporate income taxes 5,187 3,505 2,644 2,346 1,566 7,770 15,336 18,462 -99,320 GROSS DEEMED INCOME From Operating Activities 30,992 -1,06,568 -78,125 -14,70,026 -4,19,094 -4,81,564 -10,84,899 -5,64,626 5,36,793 Net cash from operating activities 2,96,036 1,72,740 2,35,673 -11,25,730 -85,545 -1,71,114 -7,47,317 -4,00,807 -7,88,141 (a) 2012 - 2014, show reasonable change in account receivable, inventories and account payable. The working capital management was somewhat effective during those years. (b) Since 2015, cash flows from operations (Net cash from operating activities) have been significantly negative implying that the company has not made any cash since 2014 from its core operations which is a big concern. In fact, the amount of A/C receivable is sky rocketing that year. (c) Until 2018, A/R remained negative indicating that the company was making sales but not collecting cash on those sales. This suggests that the customers who were extended credit by the store managers lacked credit worthiness. A separate credit department that approved and collected on credit sales would have been appropriate.
  • 12.
    12 (d) Inventory balanceshave increased steadily over time. This was due to the introduction of the fully stocked durable items in the super stores. (e) The huge loss of net income in 2020 reveals the exceptionally high increase in selling, general, and administrative expenses. This has to be due to increase in bonus paid to store managers who have got customers to buy on credit and increased the store credit accounts. (f) There is a significant change in A/R from 2014 to 2015 which indicates a quantum increase in balances (10,49,741 vs 24,96,850) that happened due to the new credit strategy introduced by the management. The decrease in A/R from 2019 to 2020 (36,84,015 vs 29,45,781) may be due to fallback calls/ reminder process initiated by sales managers to credit customers. But, it is sure that, bad debt expense is sure to flow if this strict collection mechanism is not adhered. 2012 2013 2014 2015 2016 2017 2018 2019 2020 Accounts receivable 7,47,868 9,04,486 10,49,741 24,96,850 28,45,776 32,46,562 36,89,622 36,84,015 29,45,781 (g) The drastic negative change in the Corporate income taxes payable and Deferred corporate income taxes in 2018 to 2019 and 2020 read in conjunction with their corresponding balances in the Balance Sheet reveal that the company had cleared huge outstanding with greater penalties. 2012 2013 2014 2015 2016 2017 2018 2019 2020 Corporate income taxes payable 3,78,534 4,30,408 5,23,070 6,10,220 7,32,620 8,29,357 9,39,823 6,98,869 1,33,566 Deferred corporate income taxes 47,691 51,196 53,840 56,186 57,752 65,522 80,858 99,320 0 4. Cash Flow from Investing Activities. 2012 2013 2014 2015 2016 2017 2018 2019 2020 (Increase) or decrease in property, plant and equipment -1,03,240 -52,239 -67,997 -1,02,175 -1,09,429 -1,75,724 -1,77,982 -1,54,747 -97,171 Proceeds from sale of (acquisition of) other assets -16,726 -1,24,569 -25,120 2,87,485 -21,987 -57,155 -21,791 -59,590 -37,378 Net cash from investing activities -1,19,966 -1,76,808 -93,117 1,85,310 -1,31,416 -2,32,879 -1,99,773 -2,14,337 -1,34,549 (a) Since 2012, BNL has been increasing its property, plant, and equipment (P,P&E). This increase is observed despite the company having had negative cash flows from operations and very little increase in net income after taxes until 2020, when it experienced a massive loss. (b) At the time when the company's stock price was dropping drastically since 2018 and that too when the company could barely cover their operational costs it did not seem wise to purchase more assets.
  • 13.
    13 5. Cash Flowfrom Financing Activities. 2012 2013 2014 2015 2016 2017 2018 2019 2020 Proceeds from (repayment of) notes payable 12,34,855 4,35,873 -58,844 10,32,547 4,27,567 9,96,002 Proceeds from (repayment of) long-term debt -50,023 -1,31,335 -53,216 -21,025 6,51,768 -11,933 4,21,730 1,92,972 Proceeds from (repayment of) other liabilities 2,542 875 1,566 1,220 502 -3,532 -3,784 -3,376 -13,648 Proceeds from issuing (repurchase of) share capital 18,272 66,146 1,50,136 -77,997 -50,226 65,332 -54,593 14,184 6,007 Dividends paid -95,537 -97,408 -1,39,783 -1,33,817 -1,41,166 -1,43,322 -1,43,343 -1,43,207 -30,218 Net cash from (used in) financing activities -74,723 -80,410 -1,19,416 9,71,045 2,23,958 5,11,402 8,18,894 7,16,898 11,51,115 (a) The cash flows from financing activities are the main contributors to a positive overall cash flow balance. (b) Since BNL makes no cash from its operations, it has been using debt financing to cover all its activities. As a result, BNL has incurred significant balance increases for its current and long-term liabilities. Q3(b). What does this (facts revealed by the cash flow statements) mean for the future viability of the firm? 6. On analysing the Cash flows and various ratios, the dramatic change from 2014 to 2015 can be observed. The critical problem is huge A/R which resulted in significant pressure on the cash flow, and a sharp decline of company's share price. The analysis of the nine-year period also led to understand that the main problem did not start in recent years. The negative trend already has started in 2015, when the management possibly took some wrong decisions. 7. When it comes to BNL's future viability, there is no other way but to say that it doesn’t look good at all. Viability means the ability for any company to sell its products at a price that cover its costs and provide returns to the shareholders. Looking at the statement of cash flows and more specifically the income statement, the level of BNL cost of goods sold, selling and administrative expense, PP & E expense, the company will need a miracle to stay away from going under. To add insult to injury, BNL's management continue to operate as business as usual with unrealistic investments in PPE. 8. In the case of BNL STORES, the decision to expand while phasing out traditional stores is not without merit, but tying the store managers’ commission to the net income of the stores was fatal. The store managers increased the sales and thereby their commission by leniently giving credits to customers probably without checking their credentials and failing to recover it in acceptable DSO period. The adverse effect of these actions is reflected in the analysis by tremendously increasing BNL's receivables and inflating the company's net income (at a risk). 9. The fact that these statements are prepared using an accrual accounting method, BNL reported income even though they did not receive any cash. From a cash management perspective, BNL will not be able to effectively finance its day-to-day operations. The poor liquidity position can put the company at a risk of failure.
  • 14.
    14 Q3(c). How helpfulis this analysis (the cash flow analysis) in understanding the company’s stock price performance? 10. Given their cash flow problems, it is surprising that BNL has continued to pay out a substantial dividend. The company might have done this to prevent a loss of investor confidence. However, their operational issues are reflected in the significant drop in their stock price. Investors have already lost confidence. 11. Conclusion. BNL Stores is in dire need of a budding financial analyst graduating from the ‘Business Management’ course from NITIE, Mumbai to bail out the company, else the sound of death bell ringing from the Wall Street recommending a ‘sell out’ option could be hard very loud and clear. ********************