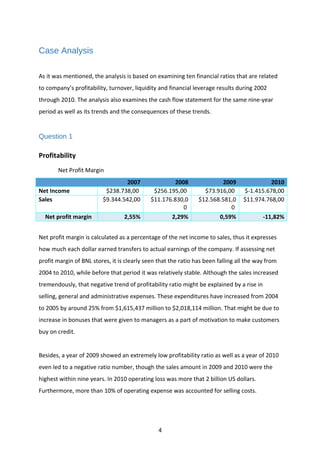
CASE 3
BNL STORES
Student Student number
Maria Epifanova 01632800
Lesly JeanLouis 00826331
Junyi Ouyang 01597944
Yifan Cui 01248695
03/05/2016
Table of Contents
Table of Contents...............................................................................................................2
Introduction.......................................................................................................................3
Case Analysis......................................................................................................................4
Question 1....................................................................................................................................4
Question 2..................................................................................................................................12
Question 3..................................................................................................................................13
Conclusion........................................................................................................................15
After analyzing the general ratios of BNL’s store, the dramatic change from 2004 to 2005
can be observed. The critical problem is account/receivable has been increased
significantly in 2005. In the long-term, the non-adequacy of accounts receivable level
resulted in significant pressure on the cash flow, and a sharp decline of company’s share
price. If a company decides to follow such a strategy in the future, it should be more
efficient and accurate at collecting the receivables. .........................................................15
The analysis of the nine-year period also led this research to understand that the main
problem did not start in recent years. The negative trend already has started in 2005,
when a management possibly took some wrong decisions. The financial crisis that
occurred in 2008 additionally created an external problem to BNL where internal problem
already existed in the business process. The supplementary economic issue attached extra
pressure that resulted in company’s loss in 2010. ..........................................................15
References.......................................................................................................................16
2
Introduction
BNL is Paul Cruz ‘s favorite place to shop. It was established in Midwestern since 40 years
ago. Recently, BNL issued a series of new business strategies, such as expanding the number
of BNL’s new supercenter stories, selling more durable goods. In addition, BNL’s traditional
tactic was to offer store credit to customers. This strategy was focused to stimulate sells as
well as to motivate each individual store manager selling more goods.
However, according to Paul Cruz ‘s research, BNL store’s stock had fallen dramatically, which
dropping from a high of $100 per share to less than $10. Therefore, the paper is established
to understand whether these new strategies were related to the decline in BNL’s share
price. Based on the company’s income statement, balance sheet and statement of cash
flow, the trends related to financial ratios and amounts from 2002 to 2010 are studied in
depth. The reasons behind those trends are also explained. Besides, for the industry
analyses, Home Depot company is examined. HD was taken for the analysis since it fully
matches with the profile of BNL business. This way, the study supports not only historical
analysis but as well benchmark analysis.
3
Case Analysis
As it was mentioned, the analysis is based on examining ten financial ratios that are related
to company’s profitability, turnover, liquidity and financial leverage results during 2002
through 2010. The analysis also examines the cash flow statement for the same nine-year
period as well as its trends and the consequences of these trends.
Question 1
Profitability
Net Profit Margin
2007 2008 2009 2010
Net Income $238.738,00 $256.195,00 $73.916,00 $-1.415.678,00
Sales $9.344.542,00 $11.176.830,0
0
$12.568.581,0
0
$11.974.768,00
Net profit margin 2,55% 2,29% 0,59% -11,82%
Net profit margin is calculated as a percentage of the net income to sales, thus it expresses
how much each dollar earned transfers to actual earnings of the company. If assessing net
profit margin of BNL stores, it is clearly seen that the ratio has been falling all the way from
2004 to 2010, while before that period it was relatively stable. Although the sales increased
tremendously, that negative trend of profitability ratio might be explained by a rise in
selling, general and administrative expenses. These expenditures have increased from 2004
to 2005 by around 25% from $1,615,437 million to $2,018,114 million. That might be due to
increase in bonuses that were given to managers as a part of motivation to make customers
buy on credit.
Besides, a year of 2009 showed an extremely low profitability ratio as well as a year of 2010
even led to a negative ratio number, though the sales amount in 2009 and 2010 were the
highest within nine years. In 2010 operating loss was more that 2 billion US dollars.
Furthermore, more than 10% of operating expense was accounted for selling costs.
4
To make it straight to the point, the profitability ratio has been declining from 3.42% in 2002
to -11.82% in 2010. This fact could be explained due to higher operating expenses growth
over sales earned growth. Moreover, an interesting moment in the financial result of a
downturn year of 2010 is that although operating income was negative, the company still
paid out dividends. That pay out could be because the company wanted to keep their
investors as well as possibly to slightly recover its stock price, nevertheless, if an
experienced creditor sees such a great loss and the negative trend of company’s
profitability, income from dividends is not going to significantly affect his or her decision on
further dealing with a company. Conversely, a company that pays dividends from no income
but debt, should create a concern of any investor.
Return on Equity
2007 2008 2009 2010
Net Income $238.738,00 $256.195,00 $73.916,00 $-1.415.678,00
Equity $2.208.552,00 $2.266.811,00 $2.211.704,00 $771.815,00
ROE 10,81% 11,30% 3,34% -183,42%
Return on Equity illustrates the ratio of earnings to shareholder’s equity, it is a measure that
is helpful for potential investors who assess attractive stocks. In addition, it is composed
from three financial measures as profitability, efficiency and financial leverage. As it is seen
from the table above as well as from the case paper, ROE has been fallen through all the
time from 2002 to 2010. This is supported by rising total liabilities. The huge drop of ROE
from 2008 to 2010 resulted from company’s borrowings of long-term debt. Moreover, as it
is seen from the Balance Sheets of BNL company, the account of long-term debt has
tremendously increased (by around 4 times) from 2006 to 2007, that led to a great rise of
short-term notes payable account in 2008 since the company had to pay a lot more interest
in the following years. From the financial data presented by the case, it might be considered
that BNL has borrowed a large loan to get more cash to cover operating expenses since the
company had most of its assets in Accounts Receivables.
Since the management team mainly focused on attracting customers who pay on credit, and
therefore, increase Accounts Receivable, the company did not control its balance of current
5
assets by allowing the A/R account to rise every year by a large portion considering the cash
and cash equivalent amount.
In 2008 there was financial crisis that made the company to fell in ROE and its components
as efficiency, profitability and financial leverage. That external difficulty effected the most of
business companies. This fact can be supported by the analysis of an industry player as
Home Depot (HD). HD also had a sharp decrease in ROE owning it from 20.56% to 12.74% in
2008. Nevertheless, Home Depot slightly got ROE better as they succeeded to upgrade it to
14.32% in 2009.
Return on Asset
2007 2008 2009 2010
Net Income $238,738.00 $256,195.00 $73,916.00 $-1,415,678.00
Income before
tax
$418,408.00 $430,780.00 $96,215.00 $-2,212,097.00
Tax expense $179,670.00 $174,585.00 $22,299.00 $-796,419.00
Tax rate 43% 41% 23% 36%
Interest Expense $115,057.00 $146,638.00 $163,086.00 $256,087.00
Assets $6,404,862.00 $7,530,533.00 $8,102,013.00 $7,337,770.00
ROA 4.75% 4.56% 2.46% -17.06%
Return on Asset measure strongly depends on net income and assets outcomes. Hence, a
previously mentioned decline in net income to assets might illustrate the efficiency of
handling assets. The negative ratio in 2010 concludes that the company made a loss on
every dollar invested in asset. That was a result of an impressive deficit made in the same
year.
6
Turnover
Days Receivables
2007 2008 2009 2010
Accounts Receivable $3.246.562,00 $3.689.622,00 $3.684.015,00 $2.945.781,00
Sales $9.344.542,00 $11.176.830,00 $12.568.581,00 $11.974.768,00
Days receivables 126,81 120,49 106,99 89,79
Days in Account Receivables ratio studies how well a company collects its credit sales. Since
BNL’s strategy is to provide customers with sales on credit and give sales managers the
bonuses based on the sales realized, the company has to concentrate on studying this ratio
as it shows a downturn of this tactic. Undoubtedly, it is easier to sell a good to a customer
by providing a credit, nevertheless there should be a limit of this tactic and the management
needs to track the percentage of cash to accounts receivables and examine the efficiency of
transferring Accounts Receivable into real money. As it is extracted from the financial data,
from 2004 to 2005 the days receivables ratio has more than doubled. That is supported by
increased sales as well as by an immense growth of Accounts Receivable. From that year to
2007 the ratio has been rising. Although sales in the period of 2008 to 2010 were high, the
ratio has decreased because A/R account finally declined. That decline might be a result of
either improved credit collection policy or time issue as collections of A/R from the previous
periods.
Although the ratio has lately ameliorated, the management has to strictly track the
performance of collection policy since their operations are hugely depended on it.
Moreover, if the management had transferred A/R into cash earlier, the company could
have needed no huge borrowings from a bank from 2007 to support its operations.
7
Inventory turnover
2007 2008 2009 2010
COGS $6.313.787,00 $7.629.270,00 $8.698.367,00 $8.836.150,00
Inventory $2.025.023,00 $2.708.834,00 $3.055.319,00 $2.761.880,00
Inventory
turnover
3,12 2,82 2,85 3,20
Although there are high fluctuations of different ratios, the inventory turnover seems to be
the most stable since its lowest point was at 2,85% in 2008 as well as 2009 and its peak was
spotted at 3,7% in 2002. In order to support sales amount that increased every year, the
company needed to carry high level of inventory, and thus earned high levels of COGS.
Total Asset Turnover
2007 2008 2009 2010
Sales $9.344.542,00 $11.176.830,0
0
$12.568.581,0
0
$11.974.768,00
Assets $6.404.862,00 $7.530.533,00 $8.102.013,00 $7.337.770,00
Total Asset
turnover
1,46 1,48 1,55 1,63
Asset Turnover is calculated using sales and assets numbers. It is considered to indicate the
efficiency of company of deploying its assets, and thus, extracting revenues. The higher the
ratio, the better company uses its assets. Hence, using the data collected, it is indicated that
has been decreasing from 2004 to 2008. After 2008 the ratio experienced a slight rise. That
recent positive trend might depict recovery of asset efficiency. Nevertheless, the ratio was
all the time higher than 1, which means that within a year period total assets generate value
in sales by more than just once.
For a better analysis of this ratio, Home Depot is taken as an industry player, and thus, its
outcome in asset turnover is compared to BNL’s result. Home Depot has the following
results in the ratio: 1.96% in 2006, 1.88% in 2007, 1.60% in 2008, 1.67% in 2009 and 1.61%
in 2009. As noticed, there was a slight decreased of Home Depot’s AT from 2007 to 2008,
whereas BNL succeeded to improve the ratio. Therefore, it might be concluded that the
company was comparably efficient using its assets and even improved the results in the
period of economy downturn.
8
Liquidity
Current ratio
2007 2008 2009 2010
Current Assets $5.646.038,00 $6.653.323,00 $7.100.369,00 $6.292.321,00
Current Liabilities $3.224.410,00 $4.292.203,00 $4.481.974,00 $5.077.616,00
Current ratio 1,75 1,55 1,58 1,24
Current ratio examines company’s ability to pay off its current debt using current assets
(self-liquidating accounts). The company’s A/R accounts have been rising for the whole
period, that created current assets amount to improve as well. Nevertheless, since the
company started immensely borrowing from 2005, and afterwards paying increased interest
expense, it has reflected in the following years as well as resulted in fluctuations of current
ratio. If the current ratio in 2002 equaled to 2.66, in 2010 it was already 1.24, which was due
to more extensive growth of current liabilities rather than stable rise of current assets.
Quick ratio
2007 2008 2009 2010
Cash $337.990,00 $209.794,00 $311.548,00 $539.973,00
Accounts Receivable $3.246.562,00 $3.689.622,00 $3.684.015,00 $2.945.781,00
Current Liabilities $3.224.410,00 $4.292.203,00 $4.481.974,00 $5.077.616,00
Quick ratio 1,11 0,91 0,89 0,69
As it was mentioned, the trend of current liabilities was more excessive than the expansion
of current assets including separately cash and accounts receivables accounts. That resulted
in a decreased current ratio, as well as quick ratio. Based on the table above, the cash and
accounts receivables were not increasing enough to catch the liabilities amount. Hence, it
created situation in 2008 when the quick ratio went lower than 1 meaning that “quick
accounts” of assets could not cover current liabilities at that time. When comparing with
Home Depot, BNL seems to do much better since HD’s quick ratio has been always lower
than 0.30 for the period from 2006 to 2010.
In such a volatile industry, in which BNL stores operate it is important to measure liquidity.
Nevertheless, the company seems to do adequate when managing current liabilities to
current assets since most of years (eight out of nine) the ratio was larger than 1.
9
Financial Leverage
Debt-to-equity ratio
2007 2008 2009 2010
Liabilities $4.196.310,00 $5.263.722,00 $5.890.309,00 $6.565.955,00
Equity $2.208.552,00 $2.266.811,00 $2.211.704,00 $771.815,00
Debt-to-equity
ratio
1,90 2,32 2,66 8,51
The ratio of debt to liability examines the portion of liability in assets relatively to
shareholder’s equity. To that extend, the measure assesses company’s financial leverage.
Historically, it is seen that the ratio has been increasing as within nine years, the ratio has
gone up from 0.96 in 2002 to 8.51 in 2010. The last number shows a high risk that a
company involves in its operations. As mentioned, the rise is explained by company’s
borrowing history as to cover operating expenses, BNL sharply increased its loan level, the
same way as its short-term notes payable.
Commonly, this industry tries to come with low financial leverage ratio since the cash flows
are not stable and the market is relatively volatile. To support this, the analysis refers back
to Home Depot results in leverage ratio. Based on HD debt to equity from 2006 to 2010 the
ratios climbed up from 0.10 to 0.45, in percentage that is a steep increase, nevertheless, the
ratio does not even exceed 1. That industry study might support the previous conclusion
that BNL took a risky decision to increase its liabilities to equity.
10
Debt-to-capitalization ratio
2007 2008 2009 2010
Long-term liabilities $971,900.00 $971,519.00 $1,408,335.00 $1,488,339.00
Contributed Capital $550,787.00 $496,194.00 $510,378.00 $516,385.00
Debt-to-
capitalization ratio
0.64 0.66 0.73 0.74
When comparing, within nine years the contributed capital level has not changed much as it
has risen from $397,396 in 2002 to $516,385 in 2010. Nonetheless, long-term liabilities have
steeply gone up from $557,269 to $1,488,339. That trend resulted in a higher debt-to-
capitalization portion especially when stressing the period from 2004 to 2005. As previously
emphasized, the year of 2005 was a decisive year for the company since the management
team decided to double its Accounts receivable in order to accelerate sales levels.
To conclude, when analyzing financial performance of BNL company from 2002 to 2010, the
nine-year period might be divided into three phases: the first phase is from 2002 to 2003,
the second stage is from 2004 to 2008 and the third one is from 2009 to 2010. First period
could be called as stability, the second one as turn-down and the third one as breakdown.
Although in the first phase there was a slight decline in several ratios, the financial output
did not significantly fluctuate. Afterwards, the second period’s failure was due to an internal
problem that was created by management’s decision on increasing sales by selling on credit
and by making Accounts Receivable to climb up high and not creating an essential balance.
Nonetheless, in 2008 the financial crisis generated an external problem for the company,
and from that period on there were two issues that are related to management’s
involvement as well as to economic conditions. From that point it would be difficult for a
company to recover since the right and well-analyzed decisions have to be made.
11
Question 2
2008 2009 2010
Cash flows from operating
activities
Net Income (loss) after taxes $256.195,00 $73.916,00 $-1.415.678,00
Adjustments for: Amortization of
property, plant and equipment $81.387,00 $89.903,00 $90.744,00
Changes in:
Accounts Receivable $-443.060,00 $5.607,00 $738.234,00
Inventories $-683.811,00 $-346.485,00 $293.439,00
Prepaid expenses $-8.610,00 $-4.414,00 $4.800,00
Accounts Payable $-75.220,00 $3.158,00 $164.943,00
Corporate taxes payable $110.466,00 $-240.954,00 $-565.303,00
Deferred corporate income taxes $15.336,00 $18.462,00 $-99.320,00
$-1.084.899,00 $-564.626,00 $536.793,00
Net cash from operating
activities $-747.317,00 $-400.807,00 $-788.141,00
Cash flows from investing
activities
(Increase) or decrease in property,
plant and equipment $-177.982,00 $-154.747,00 $-97.171,00
Proceeds from sale of (acquisition
of) other assets $-21.791,00 $-59.590,00 $-37.378,00
Net cash from investing
activities $-199.773,00 $-214.337,00 $-134.549,00
Cash flows from financing
activities
Proceeds from (repayment of) notes
payable $1.032.547,00 $427.567,00 $996.002,00
Proceeds from (repayment of) long-
term debt $-11.933,00 $421.730,00 $192.972,00
Proceeds from (repayment of) other
liabilities $-3.784,00 $-3.376,00 $-13.648,00
Proceeds from issuing (repurchase
of) share capital $-54.593,00 $14.184,00 $6.007,00
Dividends paid $-143.343,00 $-143.207,00 $-30.218,00
Net cash from (used in)
financing activities $818.894,00 $716.898,00 $1.151.115,00
Net increase (decrease) in
cash and cash equivalents $-128.196,00 $101.754,00 $228.425,00
Opening balance, cash and
cash equivalents $337.990,00 $209.794,00 $311.548,00
Closing balance, cash and
cash equivalents $209.794,00 $311.548,00 $539.973,00
12
Question 3
Interpreting BNL STORES ' statement of cash flows shed a lot of light on how the company
was managed throughout the years. The effects of these strategies implemented are
reflected through the numbers in the financial statements of the company. Based on the
linkages of the balance sheet and the income statement on the statement of cash flow, it
makes a lot of sense to look at the statement format and data sources to analyze BNL
financial history from an operating, investing and financing perspectives.
The data from 2002 to 2004 in the statement of cash flow showed BNL STORES in a better
light with positive net cash flow from operating activities derived by reasonable change in
account receivable, inventories and account payable. The working capital management was
somewhat effective during those years. Similar observations can be made for the investing
and financing activities during this period. In 2005, the new strategies implemented by the
company's management started to reflect in their statements and BNL reported a significant
negative net cash from operating activities directly related to a very high change in their
account receivable. Having a negative net cash from investing and financing activities would
show BNL is paying back debt and investing back into the business, but that year they were
both positive. This nightmare will continue until 2010 which will affect the company’s future
cash flows negatively.
When it comes to BNL's economic viability, there is no other way to put it or to sugarcoat it.
It does not look good at all. Viability means the ability for any company to sell its products at
a price that cover its costs and provide a return to the shareholders. Looking at the
statement of cash flows and more specifically the income statement, the level of BNL cost of
goods sold, selling and administrative expense, PPE expense, the company will need a
miracle to stay away from going under. To add insult to injury, BNL's management continue
to operate as business as usual with unrealistic investments in PPE and the obsession of
paying dividends.
For any company listed in the US stock markets, the performance of their stock is directly
related to their management strategies and its impacts on the company top and bottom line
13
as a whole. In the case of BNL STORES, the decision to expand while phasing out traditional
stores is not without merit, but tying the store managers 'commission to the net income of
the stores was fatal. By leniently giving credits to customers who did not deserve them, the
store managers increased their stores net income and their commission at the same time.
The adverse effect of these actions are reflected in the analysis by tremendously increasing
BNL's receivables and inflating the company's net income. The fact that these statements
are prepared using an accrual accounting method, BNL reported income even though they
did not receive any cash. BNL from a cash management perspective, the fact that BNL will
not be able to effectively finance its day-to-day operations and the fact that the analysts
know how illiquidity can put a company at a risk of failure, BNL will receive a sell
recommendation from Wall Street which will tank the stock price.
14
Conclusion
After analyzing the general ratios of BNL’s store, the dramatic change from 2004 to 2005
can be observed. The critical problem is account/receivable has been increased
significantly in 2005. In the long-term, the non-adequacy of accounts receivable level
resulted in significant pressure on the cash flow, and a sharp decline of company’s
share price. If a company decides to follow such a strategy in the future, it should be
more efficient and accurate at collecting the receivables.
The analysis of the nine-year period also led this research to understand that the main
problem did not start in recent years. The negative trend already has started in 2005,
when a management possibly took some wrong decisions. The financial crisis that
occurred in 2008 additionally created an external problem to BNL where internal
problem already existed in the business process. The supplementary economic issue
attached extra pressure that resulted in company’s loss in 2010.
15
References
1. Cruz, Paul. "BNL Stores." Richard Ivey School of Business Foundation (2013): Print.
2. "HD Home Depot Inc XNYS:HD Stock Quote Price News." HD Home Depot Inc
XNYS:HD Stock Quote Price News. Web. 05 Mar. 2016.
16

Case 3 Final

  • 1.
    CASE 3 BNL STORES StudentStudent number Maria Epifanova 01632800 Lesly JeanLouis 00826331 Junyi Ouyang 01597944 Yifan Cui 01248695 03/05/2016
  • 2.
    Table of Contents Tableof Contents...............................................................................................................2 Introduction.......................................................................................................................3 Case Analysis......................................................................................................................4 Question 1....................................................................................................................................4 Question 2..................................................................................................................................12 Question 3..................................................................................................................................13 Conclusion........................................................................................................................15 After analyzing the general ratios of BNL’s store, the dramatic change from 2004 to 2005 can be observed. The critical problem is account/receivable has been increased significantly in 2005. In the long-term, the non-adequacy of accounts receivable level resulted in significant pressure on the cash flow, and a sharp decline of company’s share price. If a company decides to follow such a strategy in the future, it should be more efficient and accurate at collecting the receivables. .........................................................15 The analysis of the nine-year period also led this research to understand that the main problem did not start in recent years. The negative trend already has started in 2005, when a management possibly took some wrong decisions. The financial crisis that occurred in 2008 additionally created an external problem to BNL where internal problem already existed in the business process. The supplementary economic issue attached extra pressure that resulted in company’s loss in 2010. ..........................................................15 References.......................................................................................................................16 2
  • 3.
    Introduction BNL is PaulCruz ‘s favorite place to shop. It was established in Midwestern since 40 years ago. Recently, BNL issued a series of new business strategies, such as expanding the number of BNL’s new supercenter stories, selling more durable goods. In addition, BNL’s traditional tactic was to offer store credit to customers. This strategy was focused to stimulate sells as well as to motivate each individual store manager selling more goods. However, according to Paul Cruz ‘s research, BNL store’s stock had fallen dramatically, which dropping from a high of $100 per share to less than $10. Therefore, the paper is established to understand whether these new strategies were related to the decline in BNL’s share price. Based on the company’s income statement, balance sheet and statement of cash flow, the trends related to financial ratios and amounts from 2002 to 2010 are studied in depth. The reasons behind those trends are also explained. Besides, for the industry analyses, Home Depot company is examined. HD was taken for the analysis since it fully matches with the profile of BNL business. This way, the study supports not only historical analysis but as well benchmark analysis. 3
  • 4.
    Case Analysis As itwas mentioned, the analysis is based on examining ten financial ratios that are related to company’s profitability, turnover, liquidity and financial leverage results during 2002 through 2010. The analysis also examines the cash flow statement for the same nine-year period as well as its trends and the consequences of these trends. Question 1 Profitability Net Profit Margin 2007 2008 2009 2010 Net Income $238.738,00 $256.195,00 $73.916,00 $-1.415.678,00 Sales $9.344.542,00 $11.176.830,0 0 $12.568.581,0 0 $11.974.768,00 Net profit margin 2,55% 2,29% 0,59% -11,82% Net profit margin is calculated as a percentage of the net income to sales, thus it expresses how much each dollar earned transfers to actual earnings of the company. If assessing net profit margin of BNL stores, it is clearly seen that the ratio has been falling all the way from 2004 to 2010, while before that period it was relatively stable. Although the sales increased tremendously, that negative trend of profitability ratio might be explained by a rise in selling, general and administrative expenses. These expenditures have increased from 2004 to 2005 by around 25% from $1,615,437 million to $2,018,114 million. That might be due to increase in bonuses that were given to managers as a part of motivation to make customers buy on credit. Besides, a year of 2009 showed an extremely low profitability ratio as well as a year of 2010 even led to a negative ratio number, though the sales amount in 2009 and 2010 were the highest within nine years. In 2010 operating loss was more that 2 billion US dollars. Furthermore, more than 10% of operating expense was accounted for selling costs. 4
  • 5.
    To make itstraight to the point, the profitability ratio has been declining from 3.42% in 2002 to -11.82% in 2010. This fact could be explained due to higher operating expenses growth over sales earned growth. Moreover, an interesting moment in the financial result of a downturn year of 2010 is that although operating income was negative, the company still paid out dividends. That pay out could be because the company wanted to keep their investors as well as possibly to slightly recover its stock price, nevertheless, if an experienced creditor sees such a great loss and the negative trend of company’s profitability, income from dividends is not going to significantly affect his or her decision on further dealing with a company. Conversely, a company that pays dividends from no income but debt, should create a concern of any investor. Return on Equity 2007 2008 2009 2010 Net Income $238.738,00 $256.195,00 $73.916,00 $-1.415.678,00 Equity $2.208.552,00 $2.266.811,00 $2.211.704,00 $771.815,00 ROE 10,81% 11,30% 3,34% -183,42% Return on Equity illustrates the ratio of earnings to shareholder’s equity, it is a measure that is helpful for potential investors who assess attractive stocks. In addition, it is composed from three financial measures as profitability, efficiency and financial leverage. As it is seen from the table above as well as from the case paper, ROE has been fallen through all the time from 2002 to 2010. This is supported by rising total liabilities. The huge drop of ROE from 2008 to 2010 resulted from company’s borrowings of long-term debt. Moreover, as it is seen from the Balance Sheets of BNL company, the account of long-term debt has tremendously increased (by around 4 times) from 2006 to 2007, that led to a great rise of short-term notes payable account in 2008 since the company had to pay a lot more interest in the following years. From the financial data presented by the case, it might be considered that BNL has borrowed a large loan to get more cash to cover operating expenses since the company had most of its assets in Accounts Receivables. Since the management team mainly focused on attracting customers who pay on credit, and therefore, increase Accounts Receivable, the company did not control its balance of current 5
  • 6.
    assets by allowingthe A/R account to rise every year by a large portion considering the cash and cash equivalent amount. In 2008 there was financial crisis that made the company to fell in ROE and its components as efficiency, profitability and financial leverage. That external difficulty effected the most of business companies. This fact can be supported by the analysis of an industry player as Home Depot (HD). HD also had a sharp decrease in ROE owning it from 20.56% to 12.74% in 2008. Nevertheless, Home Depot slightly got ROE better as they succeeded to upgrade it to 14.32% in 2009. Return on Asset 2007 2008 2009 2010 Net Income $238,738.00 $256,195.00 $73,916.00 $-1,415,678.00 Income before tax $418,408.00 $430,780.00 $96,215.00 $-2,212,097.00 Tax expense $179,670.00 $174,585.00 $22,299.00 $-796,419.00 Tax rate 43% 41% 23% 36% Interest Expense $115,057.00 $146,638.00 $163,086.00 $256,087.00 Assets $6,404,862.00 $7,530,533.00 $8,102,013.00 $7,337,770.00 ROA 4.75% 4.56% 2.46% -17.06% Return on Asset measure strongly depends on net income and assets outcomes. Hence, a previously mentioned decline in net income to assets might illustrate the efficiency of handling assets. The negative ratio in 2010 concludes that the company made a loss on every dollar invested in asset. That was a result of an impressive deficit made in the same year. 6
  • 7.
    Turnover Days Receivables 2007 20082009 2010 Accounts Receivable $3.246.562,00 $3.689.622,00 $3.684.015,00 $2.945.781,00 Sales $9.344.542,00 $11.176.830,00 $12.568.581,00 $11.974.768,00 Days receivables 126,81 120,49 106,99 89,79 Days in Account Receivables ratio studies how well a company collects its credit sales. Since BNL’s strategy is to provide customers with sales on credit and give sales managers the bonuses based on the sales realized, the company has to concentrate on studying this ratio as it shows a downturn of this tactic. Undoubtedly, it is easier to sell a good to a customer by providing a credit, nevertheless there should be a limit of this tactic and the management needs to track the percentage of cash to accounts receivables and examine the efficiency of transferring Accounts Receivable into real money. As it is extracted from the financial data, from 2004 to 2005 the days receivables ratio has more than doubled. That is supported by increased sales as well as by an immense growth of Accounts Receivable. From that year to 2007 the ratio has been rising. Although sales in the period of 2008 to 2010 were high, the ratio has decreased because A/R account finally declined. That decline might be a result of either improved credit collection policy or time issue as collections of A/R from the previous periods. Although the ratio has lately ameliorated, the management has to strictly track the performance of collection policy since their operations are hugely depended on it. Moreover, if the management had transferred A/R into cash earlier, the company could have needed no huge borrowings from a bank from 2007 to support its operations. 7
  • 8.
    Inventory turnover 2007 20082009 2010 COGS $6.313.787,00 $7.629.270,00 $8.698.367,00 $8.836.150,00 Inventory $2.025.023,00 $2.708.834,00 $3.055.319,00 $2.761.880,00 Inventory turnover 3,12 2,82 2,85 3,20 Although there are high fluctuations of different ratios, the inventory turnover seems to be the most stable since its lowest point was at 2,85% in 2008 as well as 2009 and its peak was spotted at 3,7% in 2002. In order to support sales amount that increased every year, the company needed to carry high level of inventory, and thus earned high levels of COGS. Total Asset Turnover 2007 2008 2009 2010 Sales $9.344.542,00 $11.176.830,0 0 $12.568.581,0 0 $11.974.768,00 Assets $6.404.862,00 $7.530.533,00 $8.102.013,00 $7.337.770,00 Total Asset turnover 1,46 1,48 1,55 1,63 Asset Turnover is calculated using sales and assets numbers. It is considered to indicate the efficiency of company of deploying its assets, and thus, extracting revenues. The higher the ratio, the better company uses its assets. Hence, using the data collected, it is indicated that has been decreasing from 2004 to 2008. After 2008 the ratio experienced a slight rise. That recent positive trend might depict recovery of asset efficiency. Nevertheless, the ratio was all the time higher than 1, which means that within a year period total assets generate value in sales by more than just once. For a better analysis of this ratio, Home Depot is taken as an industry player, and thus, its outcome in asset turnover is compared to BNL’s result. Home Depot has the following results in the ratio: 1.96% in 2006, 1.88% in 2007, 1.60% in 2008, 1.67% in 2009 and 1.61% in 2009. As noticed, there was a slight decreased of Home Depot’s AT from 2007 to 2008, whereas BNL succeeded to improve the ratio. Therefore, it might be concluded that the company was comparably efficient using its assets and even improved the results in the period of economy downturn. 8
  • 9.
    Liquidity Current ratio 2007 20082009 2010 Current Assets $5.646.038,00 $6.653.323,00 $7.100.369,00 $6.292.321,00 Current Liabilities $3.224.410,00 $4.292.203,00 $4.481.974,00 $5.077.616,00 Current ratio 1,75 1,55 1,58 1,24 Current ratio examines company’s ability to pay off its current debt using current assets (self-liquidating accounts). The company’s A/R accounts have been rising for the whole period, that created current assets amount to improve as well. Nevertheless, since the company started immensely borrowing from 2005, and afterwards paying increased interest expense, it has reflected in the following years as well as resulted in fluctuations of current ratio. If the current ratio in 2002 equaled to 2.66, in 2010 it was already 1.24, which was due to more extensive growth of current liabilities rather than stable rise of current assets. Quick ratio 2007 2008 2009 2010 Cash $337.990,00 $209.794,00 $311.548,00 $539.973,00 Accounts Receivable $3.246.562,00 $3.689.622,00 $3.684.015,00 $2.945.781,00 Current Liabilities $3.224.410,00 $4.292.203,00 $4.481.974,00 $5.077.616,00 Quick ratio 1,11 0,91 0,89 0,69 As it was mentioned, the trend of current liabilities was more excessive than the expansion of current assets including separately cash and accounts receivables accounts. That resulted in a decreased current ratio, as well as quick ratio. Based on the table above, the cash and accounts receivables were not increasing enough to catch the liabilities amount. Hence, it created situation in 2008 when the quick ratio went lower than 1 meaning that “quick accounts” of assets could not cover current liabilities at that time. When comparing with Home Depot, BNL seems to do much better since HD’s quick ratio has been always lower than 0.30 for the period from 2006 to 2010. In such a volatile industry, in which BNL stores operate it is important to measure liquidity. Nevertheless, the company seems to do adequate when managing current liabilities to current assets since most of years (eight out of nine) the ratio was larger than 1. 9
  • 10.
    Financial Leverage Debt-to-equity ratio 20072008 2009 2010 Liabilities $4.196.310,00 $5.263.722,00 $5.890.309,00 $6.565.955,00 Equity $2.208.552,00 $2.266.811,00 $2.211.704,00 $771.815,00 Debt-to-equity ratio 1,90 2,32 2,66 8,51 The ratio of debt to liability examines the portion of liability in assets relatively to shareholder’s equity. To that extend, the measure assesses company’s financial leverage. Historically, it is seen that the ratio has been increasing as within nine years, the ratio has gone up from 0.96 in 2002 to 8.51 in 2010. The last number shows a high risk that a company involves in its operations. As mentioned, the rise is explained by company’s borrowing history as to cover operating expenses, BNL sharply increased its loan level, the same way as its short-term notes payable. Commonly, this industry tries to come with low financial leverage ratio since the cash flows are not stable and the market is relatively volatile. To support this, the analysis refers back to Home Depot results in leverage ratio. Based on HD debt to equity from 2006 to 2010 the ratios climbed up from 0.10 to 0.45, in percentage that is a steep increase, nevertheless, the ratio does not even exceed 1. That industry study might support the previous conclusion that BNL took a risky decision to increase its liabilities to equity. 10
  • 11.
    Debt-to-capitalization ratio 2007 20082009 2010 Long-term liabilities $971,900.00 $971,519.00 $1,408,335.00 $1,488,339.00 Contributed Capital $550,787.00 $496,194.00 $510,378.00 $516,385.00 Debt-to- capitalization ratio 0.64 0.66 0.73 0.74 When comparing, within nine years the contributed capital level has not changed much as it has risen from $397,396 in 2002 to $516,385 in 2010. Nonetheless, long-term liabilities have steeply gone up from $557,269 to $1,488,339. That trend resulted in a higher debt-to- capitalization portion especially when stressing the period from 2004 to 2005. As previously emphasized, the year of 2005 was a decisive year for the company since the management team decided to double its Accounts receivable in order to accelerate sales levels. To conclude, when analyzing financial performance of BNL company from 2002 to 2010, the nine-year period might be divided into three phases: the first phase is from 2002 to 2003, the second stage is from 2004 to 2008 and the third one is from 2009 to 2010. First period could be called as stability, the second one as turn-down and the third one as breakdown. Although in the first phase there was a slight decline in several ratios, the financial output did not significantly fluctuate. Afterwards, the second period’s failure was due to an internal problem that was created by management’s decision on increasing sales by selling on credit and by making Accounts Receivable to climb up high and not creating an essential balance. Nonetheless, in 2008 the financial crisis generated an external problem for the company, and from that period on there were two issues that are related to management’s involvement as well as to economic conditions. From that point it would be difficult for a company to recover since the right and well-analyzed decisions have to be made. 11
  • 12.
    Question 2 2008 20092010 Cash flows from operating activities Net Income (loss) after taxes $256.195,00 $73.916,00 $-1.415.678,00 Adjustments for: Amortization of property, plant and equipment $81.387,00 $89.903,00 $90.744,00 Changes in: Accounts Receivable $-443.060,00 $5.607,00 $738.234,00 Inventories $-683.811,00 $-346.485,00 $293.439,00 Prepaid expenses $-8.610,00 $-4.414,00 $4.800,00 Accounts Payable $-75.220,00 $3.158,00 $164.943,00 Corporate taxes payable $110.466,00 $-240.954,00 $-565.303,00 Deferred corporate income taxes $15.336,00 $18.462,00 $-99.320,00 $-1.084.899,00 $-564.626,00 $536.793,00 Net cash from operating activities $-747.317,00 $-400.807,00 $-788.141,00 Cash flows from investing activities (Increase) or decrease in property, plant and equipment $-177.982,00 $-154.747,00 $-97.171,00 Proceeds from sale of (acquisition of) other assets $-21.791,00 $-59.590,00 $-37.378,00 Net cash from investing activities $-199.773,00 $-214.337,00 $-134.549,00 Cash flows from financing activities Proceeds from (repayment of) notes payable $1.032.547,00 $427.567,00 $996.002,00 Proceeds from (repayment of) long- term debt $-11.933,00 $421.730,00 $192.972,00 Proceeds from (repayment of) other liabilities $-3.784,00 $-3.376,00 $-13.648,00 Proceeds from issuing (repurchase of) share capital $-54.593,00 $14.184,00 $6.007,00 Dividends paid $-143.343,00 $-143.207,00 $-30.218,00 Net cash from (used in) financing activities $818.894,00 $716.898,00 $1.151.115,00 Net increase (decrease) in cash and cash equivalents $-128.196,00 $101.754,00 $228.425,00 Opening balance, cash and cash equivalents $337.990,00 $209.794,00 $311.548,00 Closing balance, cash and cash equivalents $209.794,00 $311.548,00 $539.973,00 12
  • 13.
    Question 3 Interpreting BNLSTORES ' statement of cash flows shed a lot of light on how the company was managed throughout the years. The effects of these strategies implemented are reflected through the numbers in the financial statements of the company. Based on the linkages of the balance sheet and the income statement on the statement of cash flow, it makes a lot of sense to look at the statement format and data sources to analyze BNL financial history from an operating, investing and financing perspectives. The data from 2002 to 2004 in the statement of cash flow showed BNL STORES in a better light with positive net cash flow from operating activities derived by reasonable change in account receivable, inventories and account payable. The working capital management was somewhat effective during those years. Similar observations can be made for the investing and financing activities during this period. In 2005, the new strategies implemented by the company's management started to reflect in their statements and BNL reported a significant negative net cash from operating activities directly related to a very high change in their account receivable. Having a negative net cash from investing and financing activities would show BNL is paying back debt and investing back into the business, but that year they were both positive. This nightmare will continue until 2010 which will affect the company’s future cash flows negatively. When it comes to BNL's economic viability, there is no other way to put it or to sugarcoat it. It does not look good at all. Viability means the ability for any company to sell its products at a price that cover its costs and provide a return to the shareholders. Looking at the statement of cash flows and more specifically the income statement, the level of BNL cost of goods sold, selling and administrative expense, PPE expense, the company will need a miracle to stay away from going under. To add insult to injury, BNL's management continue to operate as business as usual with unrealistic investments in PPE and the obsession of paying dividends. For any company listed in the US stock markets, the performance of their stock is directly related to their management strategies and its impacts on the company top and bottom line 13
  • 14.
    as a whole.In the case of BNL STORES, the decision to expand while phasing out traditional stores is not without merit, but tying the store managers 'commission to the net income of the stores was fatal. By leniently giving credits to customers who did not deserve them, the store managers increased their stores net income and their commission at the same time. The adverse effect of these actions are reflected in the analysis by tremendously increasing BNL's receivables and inflating the company's net income. The fact that these statements are prepared using an accrual accounting method, BNL reported income even though they did not receive any cash. BNL from a cash management perspective, the fact that BNL will not be able to effectively finance its day-to-day operations and the fact that the analysts know how illiquidity can put a company at a risk of failure, BNL will receive a sell recommendation from Wall Street which will tank the stock price. 14
  • 15.
    Conclusion After analyzing thegeneral ratios of BNL’s store, the dramatic change from 2004 to 2005 can be observed. The critical problem is account/receivable has been increased significantly in 2005. In the long-term, the non-adequacy of accounts receivable level resulted in significant pressure on the cash flow, and a sharp decline of company’s share price. If a company decides to follow such a strategy in the future, it should be more efficient and accurate at collecting the receivables. The analysis of the nine-year period also led this research to understand that the main problem did not start in recent years. The negative trend already has started in 2005, when a management possibly took some wrong decisions. The financial crisis that occurred in 2008 additionally created an external problem to BNL where internal problem already existed in the business process. The supplementary economic issue attached extra pressure that resulted in company’s loss in 2010. 15
  • 16.
    References 1. Cruz, Paul."BNL Stores." Richard Ivey School of Business Foundation (2013): Print. 2. "HD Home Depot Inc XNYS:HD Stock Quote Price News." HD Home Depot Inc XNYS:HD Stock Quote Price News. Web. 05 Mar. 2016. 16