This document discusses generating a revised Typical Meteorological Year (TMY) solar radiation data for Armidale, Australia that considers cloudy days. It begins by explaining what TMY data is and how it is typically generated without considering cloudy days. It then defines clear and cloudy days based on cloud cover measurements. The methodology section describes using the Finkelstein-Schafer statistical method to generate the original TMY from 23 years of solar radiation data, without accounting for cloudy days. The document aims to generate a revised TMY that considers cloudy days and analyze the impacts on the expected solar radiation potential.
![IOSR Journal of Engineering (IOSRJEN) www.iosrjen.org
ISSN (e): 2250-3021, ISSN (p): 2278-8719
Vol. 04, Issue 08 (August. 2014), ||VX|| PP 14-20
International organization of Scientific Research 14 | P a g e
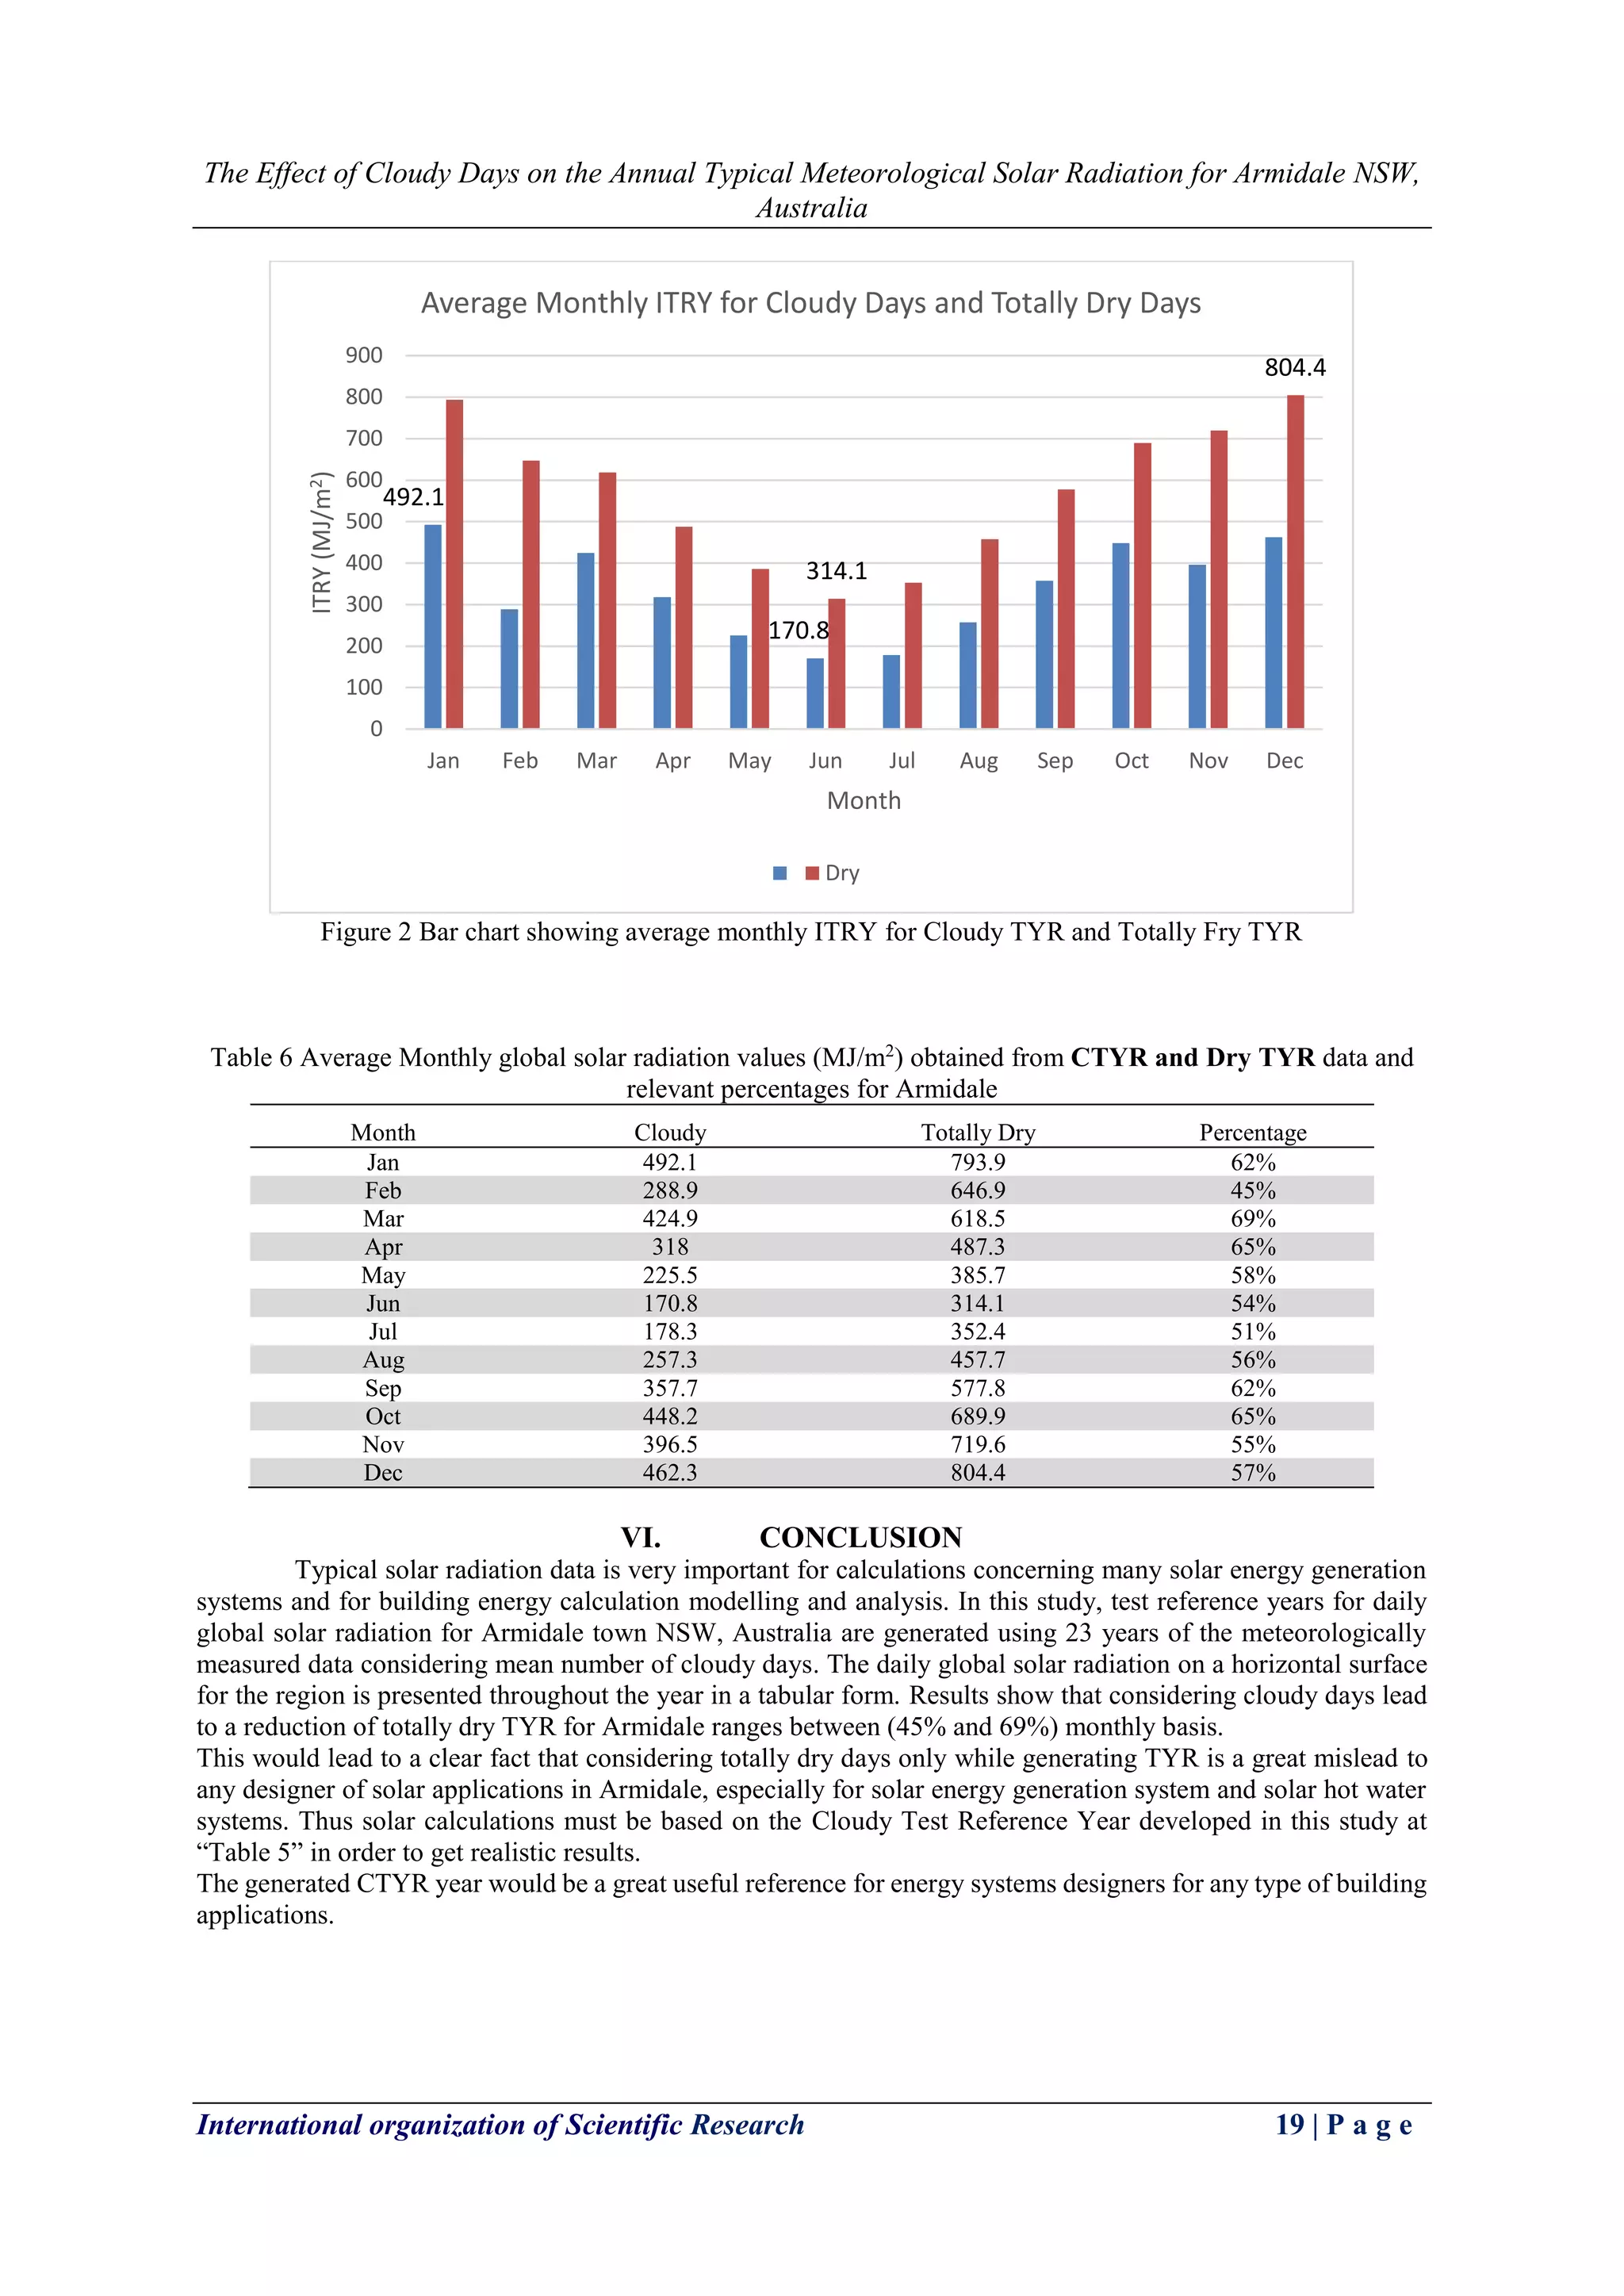
The Effect of Cloudy Days on the Annual Typical Meteorological Solar Radiation for Armidale NSW, Australia
Yasser Maklad1
1(University of New England, Armidale NSW 2351 NSW Australia– School of Environmental & Rural Science – email: ymaklad@myune.edu.au)
Abstract: - The most common data for describing the local solar climate is through what is called Typical Meteorological Year data (TMY). Typical solar radiation data is very important for the calculations of many solar applications. Previously, the calculation TMY for solar radiation has been already conducted for Armidale NSW, Australia, as typical solar radiation years for Armidale were generated from the daily global solar radiation data measured for 23 years, utilising the Finkelstein-Schafer statistical method. By all means, TMY of solar radiation showed the how solar radiation is potential in Armidale and would be a real help for solar energy generation systems’ designers in this region for all building applications varying between residential, educational, administrative and commercial for sizing and maximising efficiency of such systems by using the tabular TMY outcome for the each day of the year. However, in this study, cloudy days are considered, a revised TMY of solar radiation for Armidale is generated. It has been found that, the consideration of cloudy days has significant impacts on the potential of solar radiation in Armidale which is directly related to forming a real picture of this potential. Such impacts are affecting inversely the expected amount of energy generated and/or heat from solar radiation in Armidale.
Keywords: - Armidale NSW, clear days, cloudy days, solar radiation, test meteorological year, test reference yea,
I. INTRODUCTION
The most common data for describing the local solar climate is through what is called Typical Meteorological Year data (TMY). To determine TMY data, various meteorological measurements are made at hourly intervals over a number of years to build up a picture of the local climate. A simple average of the yearly data underestimates the amount of variability, so the month that is most representative of the location is selected. For each month, the average radiation over the whole measurement period is determined, together with the average radiation in each month during the measurement period. The data for the month that has the average radiation most closely equal to the monthly average over the whole measurement period is then chosen as the TMY data for that month. This process is then repeated for each month in the year. The months are added together to give a full year of hourly samples. There is no strict standard for TMY data so the user must adjust the data to suit the application. Considerable care must be taken with sample periods. Solar radiation data is a crucial parameter for the prediction of long-term performance of solar energy generation systems. As well, it is a key input in modelling and designing of solar energy applications. Thus, a need for a reliable source of solar radiation data has to be readily available for particular settlement locations.
The need for a one-year representative daily meteorological data led to the development of methodologies known as the Typical Meteorological Year (TMY), alternatively called Test Reference Year (TRY) [1]. TMY or TRY is a representative data that consists of the month selected from the individual years and concatenated to form a complete year. However, A TMY is not necessarily a good indicator of conditions over the next year or even the next five years. Rather, TMY represents conditions judged to be typical over a long period of time [2]. Typical weather year data sets can be generated for several climatic variables such as temperature, humidity, wind speed, etc. or only for solar radiation. Various trials have been made to generate such weather databases for different areas around the world [1, 3, 4, 5, 6, 7, 8, 9, 10&11].
A TMY for Armidale has been developed [12]. But it didn’t consider cloudy days in Armidale since the calculation procedure of TMY doesn’t incorporate that.
It is important to define the clear days and the cloudy days as follows:
Mean number of clear days is the average number of clear days in a calendar month or year, calculated over the period of record. This statistic is derived from cloud cover observations, which are measured in oktas (eighths). The sky is visually inspected to produce an estimate of the number of eighths of the dome of the sky covered by cloud. A completely clear sky is recorded as zero okta, while a totally overcast sky is 8 oktas. The presence of any trace of cloud in an otherwise blue sky is recorded as 1 okta, and similarly any trace of blue on an otherwise cloudy sky is recorded as 7 oktas. A clear day is recorded when the mean of the 9 am and 3 pm cloud](https://image.slidesharecdn.com/c04811420-140908044104-phpapp01/75/C04811420-1-2048.jpg)
![The Effect of Cloudy Days on the Annual Typical Meteorological Solar Radiation for Armidale NSW,
Australia
International organization of Scientific Research 15 | P a g e
observations is less than or equal to 2 oktas. This definition has changed slightly over time. Prior to this, a clear day was defined as having less than or equal to 2.5 oktas averaged over the 9 am and 3 pm observations [13].
On the other hand, the mean number of cloudy days is the average number of cloudy days in a calendar month or year, calculated over the period of record. This statistic is derived from cloud cover observations, which are measured in oktas (eighths). The sky is visually inspected to produce an estimate of the number of eighths of the dome of the sky covered by cloud. A completely clear sky is recorded as zero okta, while a totally overcast sky is 8 oktas. The presence of any trace of cloud in an otherwise blue sky is recorded as 1 okta, and similarly any trace of blue on an otherwise cloudy sky is recorded as 7 oktas. A cloudy day is recorded when the mean of the 9 am and 3 pm cloud observations is greater than or equal to 6 oktas. This definition has changed slightly over time. Prior to this, a cloudy day was defined as having greater than or equal to 5.5 oktas averaged over the 9 am and 3 pm observations [13].
Thus, the main aim of this study is to generate representative TMY solar radiation data for Armidale considering the cloudy days, compare original TMY with the resultant cloudy TMY (CTMY) or (CTRY), analyse the findings and estimate the impacts.
II. DATA AND LOCATION
The daily global solar radiations recorded during the period 1980–2012 are utilized to generate the typical solar radiation data. In Australia, meteorological observations are recorded by the Australian Bureau of Meteorology (BOM) weather stations are widely spreader in lots of cities and towns around Australia. In this study, the global solar radiation data recorded by Armidale Airport Weather Automatic Station and published on the BOM’s website where it was collected. The missing and invalid measurements account for approximately 0.01% of the whole database of global solar radiation; those were replaced with the values of preceding or subsequent days by interpolation. During the calculations process, any year found with more than ten days in any month observations not available was excluded. “Table 1” provides geographical information for Armidale town and the periods of the relevant global solar radiation data. “Fig. 1” shows Armidale location in NSW, Australia.
Table 1 Geographical and solar radiation database information of Armidale NSW, Australia
Longitude ( †E)
Latitude( †S)
Elevation (m)
Daily Global Solar Radiation Data
Period
Total years
Armidale
151.67
30.52
970-1070
1990—2012
23
Figure1 Armidale NSW, Australia location (Google Maps)](https://image.slidesharecdn.com/c04811420-140908044104-phpapp01/75/C04811420-2-2048.jpg)
![The Effect of Cloudy Days on the Annual Typical Meteorological Solar Radiation for Armidale NSW,
Australia
International organization of Scientific Research 16 | P a g e
III. METHODOLOGY
Finkelstein-Schafer (FS) statistics [14] is a nonparametric statistical method, known as common methodology for generating typical weather data [1, 2, 3, 4, 5, 8, 9, 10, 11&12]. In this study, FS methodology is used for generating the typical solar radiation year. According to FS statistics [11], if a number, n, of observations of a variable X are available and have been sorted into an increasing order X1, X2,. . .,Xn, the cumulative frequency distribution function (CDF) of this variable is given by a function Sn(X), which is defined in equation (1).
(1)
where k is rank order number. The FS by which comparison between the long-term CDF of each month and the CDF for each individual year of the month was done is given in equation (2).
(2)
where i is the absolute difference between the long-term CDF of the month and one-year CDF for the same month at Xi (i = 1, 2, n), n being the number of daily readings of the month. di and F(Xi) are expressed with the following equations (3 &4).
(3)
(4)
where Xi is an order sample value in a set of n observations sorted in an increasing order and X is the sample average.
Finally, the representative year for each month of the data set was determined on the basis that the representative year is that of the smallest value of FS as in equation (5).
(5)
IV. GENERATION OF CLOUDY TYPICAL SOLAR RADIATION YEAR
Previously the TMY or TYR for solar radiation in Armidale has been generated [12]
The test reference years with minimum FS for monthly mean global solar radiation for Armidale are given in “Table 2”. Which shows that, although the big picture that Armidale has a high potential of solar energy, still there are considerable differences of potentiality in through the months due to the fact that Armidale’s winter season (June, July and August) is relatively cloudy. “Table 2”, the minimum and maximum values of monthly mean of the daily global solar radiation on a horizontal surface (ITRY) in Armidale, the minimum is 10.41 MJ/m2 day in June and the maximum is 25.88 MJ/m2 day in December [12]
Table 2 Test Reference Years with minimum (min) FS and monthly mean of the daily global solar radiation (ITRY) for Armidale NSW, Australia
Month
Year
ITRY (MJ/m2day)
January
1993
25.33
February
2007
25.18
March
1993
19.68
April
1993
15.98
May
2000
12.4
June
2006
10.41
July
1991
11.44
August
1999
14.62
September
2012
19.11
October
1991
22.00
November
1991
23.59
December
1994
25.88
Extracted from [12]](https://image.slidesharecdn.com/c04811420-140908044104-phpapp01/75/C04811420-3-2048.jpg)
![The Effect of Cloudy Days on the Annual Typical Meteorological Solar Radiation for Armidale NSW,
Australia
International organization of Scientific Research 17 | P a g e
Table 3 Daily global solar radiation values (MJ/m2day) obtained from Test Reference Year data for Armidale
Day
Jan
Feb
Mar
Apr
May
Jun
Jul
Aug
Sep
Oct
Nov
Dec
1
29.4
18.1
19.1
18.8
13.5
10.8
10.0
14.5
16.4
20.5
22.3
24.6 2 27.0 22.5 21.8 18.9 12.6 10.6 10.4 14.2 16.3 19.4 22.9 25.0
3
27.2
23.2
21.1
17.8
13.9
9.00
11.2
13.6
16.1
19.3
23.4
26.0 4 26.1 26.1 22.0 19.0 13.0 10.7 10.0 13.2 17.5 20.9 23.1 25.7
5
23.2
25.5
19.8
16.8
12.0
10.9
12.0
13.3
15.8
21.2
21.3
25.4 6 23.2 23.5 21.3 19.5 14.7 11.6 11.2 14.3 18.7 19.9 22.3 23.8
7
26.6
21.5
19.4
18.8
14.5
9.70
10.8
13.7
17.0
21.4
24.1
26.1 8 25.1 23.2 20.3 16.4 12.8 10.3 10.7 14.9 17.0 21.6 22.0 26.8
9
24.9
23.2
19.5
16.2
13.4
10.6
9.60
14.9
15.7
22.3
23.2
24.8 10 26.4 24.1 21.0 17.4 12.9 10.7 11.2 15.4 18.7 21.5 24.7 22.7
11
26.4
24.3
21.4
16.3
12.8
10.1
11.4
15.1
18.3
22.4
24.2
24.7 12 26.7 21.4 20.2 16.5 12.6 11.6 10.3 15.2 18.4 22.8 25.3 26.3
13
26.1
22.4
21.0
16.4
12.5
9.80
9.90
15.7
20.4
23.7
24.4
28.3 14 25.6 20.2 21.1 14.9 12.7 10.2 10.2 15.6 19.7 21.9 26.9 25.8
15
25.7
19.7
21.9
16.7
12.9
10.5
11.6
15.6
19.3
23.2
23.8
25.2 16 26.6 20.3 21.9 15.7 12.2 10.5 12.4 14.3 19.7 23.6 22.5 27.0
17
25.1
23.9
19.3
15.4
11.5
11.2
12.1
14.4
19.2
22.5
21.3
28.3 18 25.1 22.2 20.7 16.2 11.1 10.6 10.7 14.0 19.7 23.0 21.5 26.0
19
22.1
21.8
20.9
15.2
12.4
9.50
12.2
14.6
20.0
21.8
25.5
27.1 20 28.4 22.8 20.5 15.4 12.4 9.90 12.4 13.9 19.9 23.6 24.2 26.8
21
27.3
23.4
19.8
16.2
11.3
10.6
12.4
15.5
19.9
22.9
21.3
28.1 22 25.0 21.3 17.8 15.7 11.9 10.6 12.2 14.3 21.2 24.3 24.2 26.4
23
23.5
23.2
18.8
16.2
12.2
10.4
12.7
12.8
21.8
24.4
23.7
27.9 24 25.6 23.3 20.3 14.6 12.0 11.1 11.6 16.1 20.2 21.3 25.6 24.3
25
20.8
19.0
19.5
14.6
12.2
11.0
10.8
16.8
21.5
22.9
25.3
26.2 26 25.4 21.5 17.8 14.9 11.9 10.3 9.60 16.2 20.5 20.0 26.3 26.3
27
25.2
21.5
19.4
13.7
12.2
9.80
11.4
15.5
21.5
21.3
26.1
19.8 28 27.2 25.5 17.9 13.1 11.7 10.6 11.7 15.3 21.6 26.9 26.5 26.2
29
26.8
18.3
18.5
15.1
11.4
11.2
13.6
14.9
22.1
25.5
25.7
28.3 30 27.4 15.8 14.9 11.5 9.70 13.3 14.0 23.7 21.3 26.0 26.1
31
22.8
18.7
11.0
12.8
15.9
22.6
28.4
Extracted from [12]
Searching for cloudy days in the same historical meteorological data period of this study, “Table 4” shows the total number of mean cloudy days is 200 days annually which is 55% of the year, winter months (June, July and August) has the largest share of cloudy days of (18, 21 & 19) days respectively, which is logical, however, however, the surprise that still the other months have very near shares including summer months (December, Jan and Feb) of (18, 15 & 20) days respectively. It can be easily derived from “Table 4” that cloudy days’ number in Armidale is very considerable over the whole year.
Table 4 Mean number of cloudy days in Armidale NSW, Australia
Month
Jan
Feb
Mar
Apr
May
Jun
Jul
Aug
Sep
Oct
Nov
Dec
Total
Mean Number of Cloudy Days
15
20
14
15
17
18
21
19
13
13
17
18
200
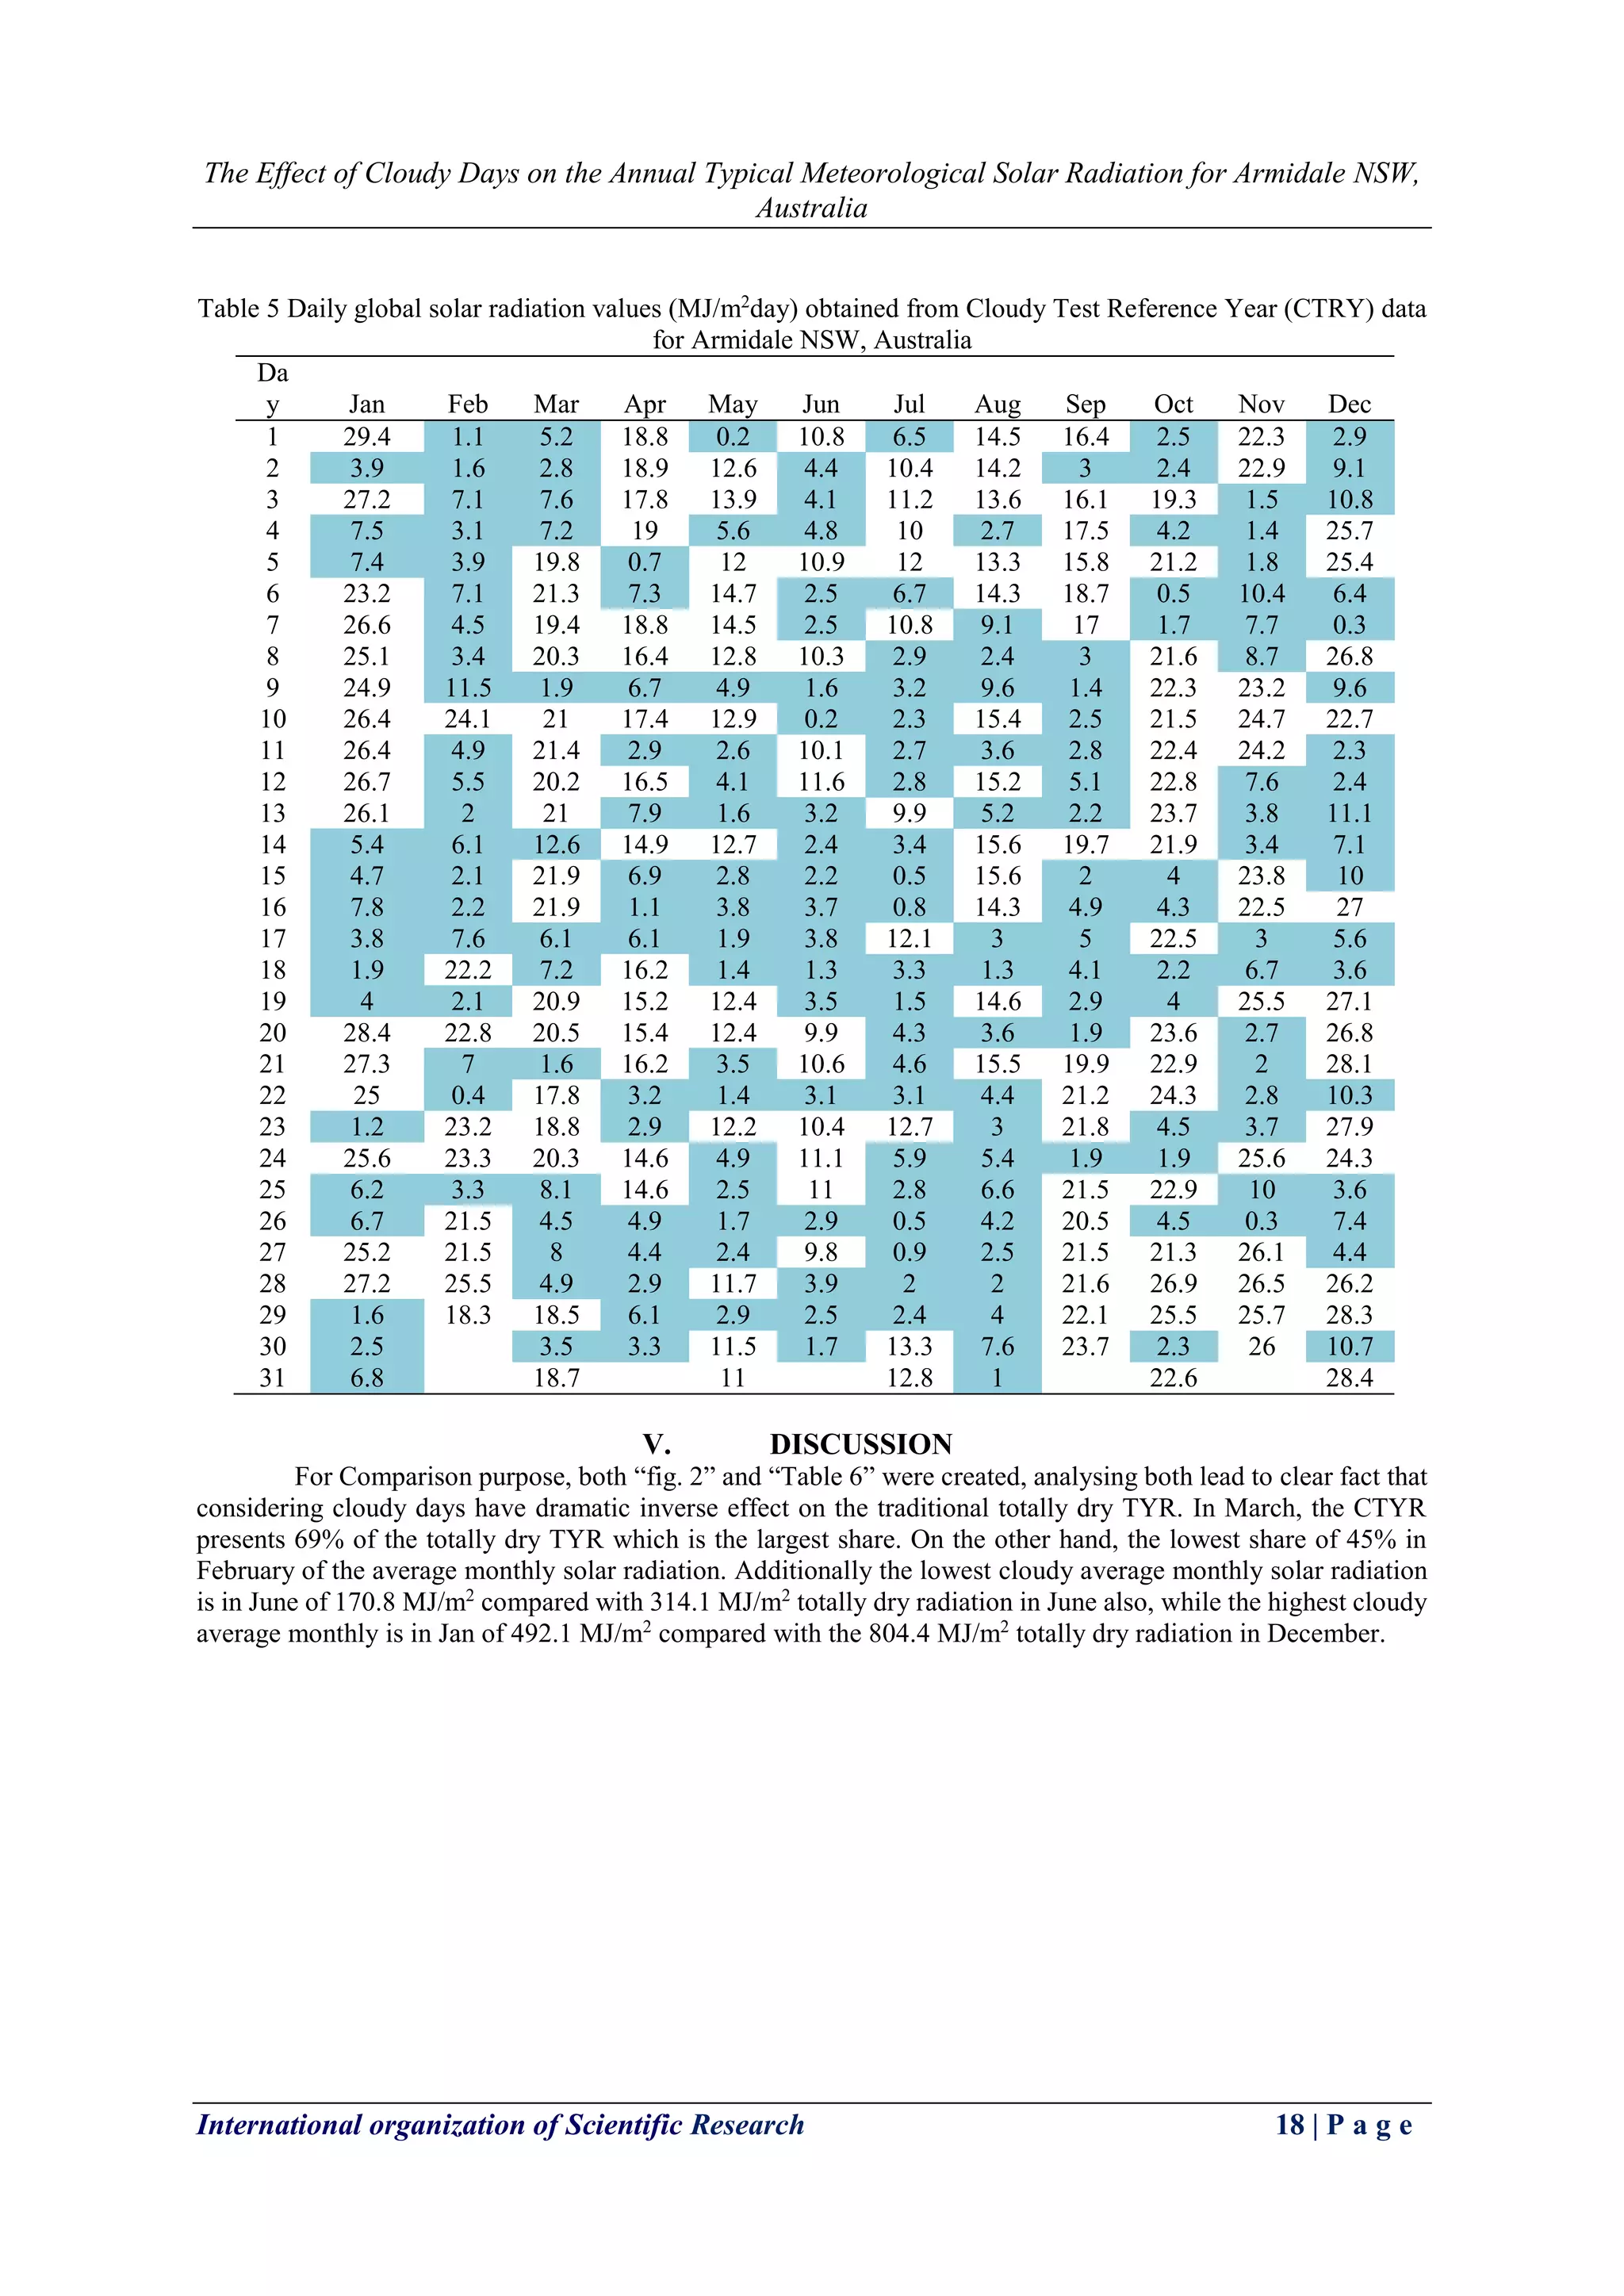
Applying the above methodology [14] for all the months in the database, considering the cloudy days in the Test Reference Year for daily global solar radiation data was formed, “Table 4” shows the CTRY for Armidale, apparently the blue highlighted is the cloudy days mean solar radiations.](https://image.slidesharecdn.com/c04811420-140908044104-phpapp01/75/C04811420-4-2048.jpg)
![The Effect of Cloudy Days on the Annual Typical Meteorological Solar Radiation for Armidale NSW,
Australia
International organization of Scientific Research 20 | P a g e
REFERENCES
[1] A. Argiriou, S. Lykoudis, S. Kontoyiannidis, C.A. Balaras, D. Asimakopoulos, M. Petrakis, and P.Kassomenos. Comparison of methodologies for TMY generation using 20 years data for Athens, Greece. Solar Energy 66(1), 1999, 33–45.
[2] W. Marion and K. Urban. User’s Manual for TMY2s. National Renewable Energy Laboratory, Colorado, USA, 1995.
[3] H. Bulut. Generation of typical solar radiation data for Istanbul, Turkey. International Journal of Energy Research 27(9), 2003, 847–855.
[4] H. Bulut. Typical Solar Radiation Year for South-eastern Anatolia. Renewable Energy 29(9), 2004, 1477– 1488.
[5] R.L. Fagbenle. Generation of a test reference year for Ibadan, Nigeria. Energy Conversion and Management 30(1), 1995, 61–63.
[6] J.C. Lam, S.C.M. Hui, and A.L.S. Chan. A statistical approach to the development of a typical meteorological year for Hong Kong. Architectural Science Review 39(4), 1996, 201–209.
[7] A. Miguel, and J. Bilbao. Test reference year generation from meteorological and simulated solar radiation data. Solar Energy 78(6), 2005, 695–703.
[8] M. Petrakis, H.D. Kambezidis, S. Lykoudis, A.D. Adamopoulos, P. Kassomenos, I.M. Michaelides, S.A. Kalogirou, G. Roditis, I. Chrysis, and A. Hadjigianni. Generation of a typical meteorological year for Nicosia, Cyprus. Renewable Energy: 13(3), 1998, 381–388.
[9] S.A.M. Said and H.M. Kadry. Generation of representative weather-year data for Saudi Arabia. Applied Energy 48(2), 1994, 131–136.
[10] M.A.M. Shutout and M.T.Y. Tadros. Typical solar radiation year for Egypt. Renewable
Energy 4(4), 1994, 387–393.
[11] G. Kalogirou, I. Roditis,, II. Chrysis, and A. Hadjigianni. Generation of a typical meteorological year for Nicosia, Cyprus. Renewable Energy: 13(3), 1998, 381–388.
[12] Y. Maklad. Generation of an Annual Typical Meteorological Solar Radiation for Armidale NSW Australia. IOSR Journal of Engineering (IOSRJEN): 4(4), 2014, 41-45.
[13] Australian Bureau of Meteorology. http://www.bom.gov.au/climate/cdo/about/definitionsother.shtml
[14] J.M. Finkelstein and R.E. Schafer. Improved goodness of fit tests. Biometrika 58(3), 1971, 641–645.](https://image.slidesharecdn.com/c04811420-140908044104-phpapp01/75/C04811420-7-2048.jpg)


![Coded Agents – with UiPath SDK + LangGraph [Virtual Hands-on Workshop]](https://cdn.slidesharecdn.com/ss_thumbnails/codedagentsdeck-251215155422-5497c599-thumbnail.jpg?width=640&height=640&fit=bounds)


