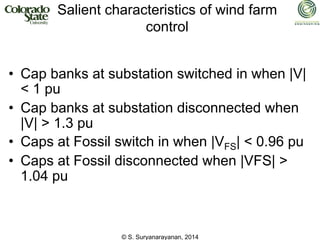
The document analyzes voltage deviation at the Condon wind farm connected to the Bonneville Power Administration network, highlighting persistent deviations of over 9%. It proposes the installation of a static synchronous compensator (STATCOM) as a remedy, validated through high-fidelity modeling and simulation. Various operational characteristics of wind turbines and their impact on voltage management are also discussed, along with recommendations for effective capacitor switching to maintain system stability.


![© S. Suryanarayanan, 2014
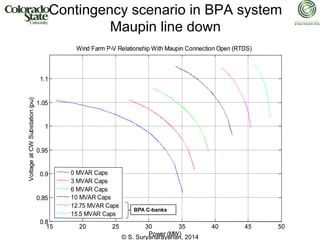
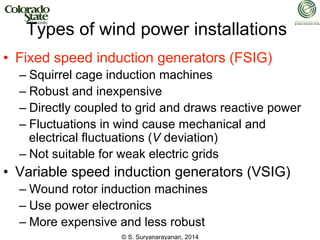
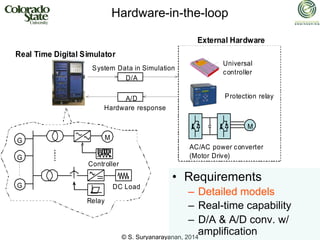
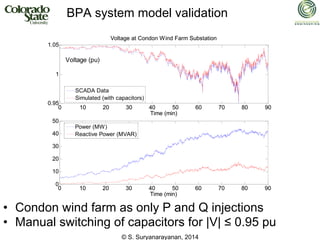
Voltage deviation on PCC at Condon
• Persistent voltage deviation of >9% seen regularly
• Note: x-axis is time (1 year period)
01/01/04 03/01/04 04/30/04 06/29/04 08/28/04 10/27/04 12/26/04
90
95
100
105
110
5 min Condon Wind SCADA Data for 365 days starting 01-Jan-2004
Voltage at Wind Farm [%]
Date [MM/DD/YY]
BPA’s nominal operating
voltage level
BPA’s nominal operating
voltage range
• Yet, voltage deviation on PCC was observed periodically](https://image.slidesharecdn.com/wecswithgrid-240711093443-5a27c893/85/GRID-integration-of-Wind-energy-conversion-system-7-320.jpg)
![© S. Suryanarayanan, 2014
-10 0 10 20 30 40 50
0.95
0.96
0.97
0.98
0.99
1
1.01
1.02
1.03
1.04
1.05
1.06
1.07
1.08
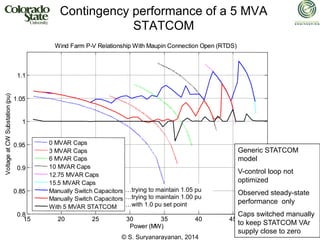
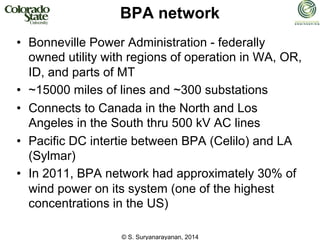
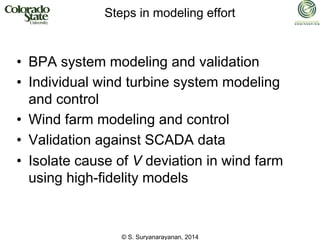
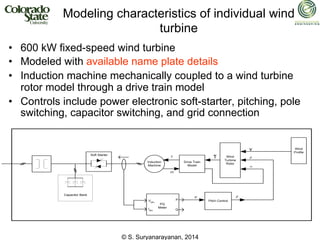
Real power delivered by wind farm [MW]
Voltage at the
wind farm [pu]
2s SCADA 03/05/2006
5min SCADA 08/22/2004 - 08/24/2004
Δv = 9%
caused
only in
some
cases
Site established as candidate for testing and installing new
technology for mitigating V deviation
Voltage deviation on PCC at Condon](https://image.slidesharecdn.com/wecswithgrid-240711093443-5a27c893/85/GRID-integration-of-Wind-energy-conversion-system-8-320.jpg)
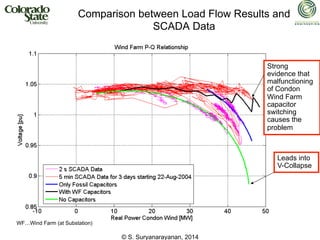
![© S. Suryanarayanan, 2014
0 5 10 15 20 25 30 35 40 45 50
0.88
0.9
0.92
0.94
0.96
0.98
1
1.02
1.04
1.06
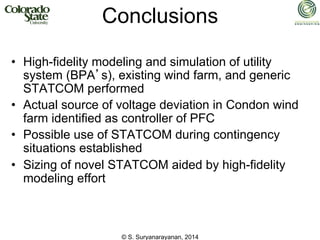
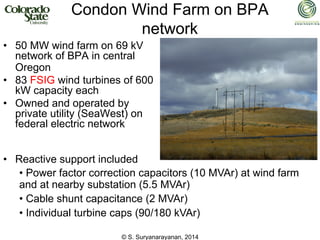
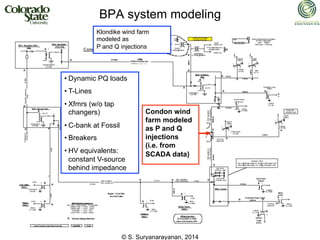
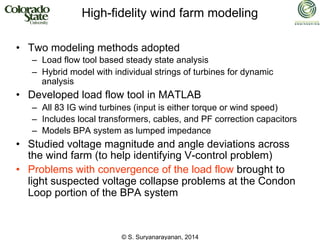
Voltage
at
Condon
Wind
[pu]
Real Power Condon Wind [MW]
2 s SCADA Data
5 min SCADA Data for 3 days starting 22-Aug-2004
No Capacitors (RTDS)
Fossil Capacitors (RTDS)
CWF Capacitors (RTDS)
Power ramped by (slowly) increasing
wind speed uniformly
Validation of hybrid RTDS model
against SCADA Data
More evidence
that
malfunctioning
of Condon
Wind Farm
capacitor
switching
causes the
problem](https://image.slidesharecdn.com/wecswithgrid-240711093443-5a27c893/85/GRID-integration-of-Wind-energy-conversion-system-22-320.jpg)
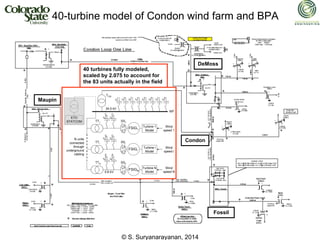
![© S. Suryanarayanan, 2014
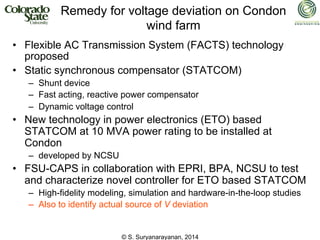
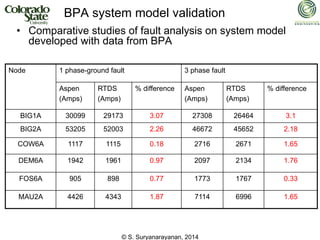
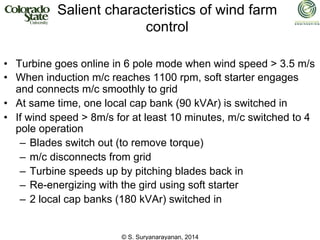
BPA Recent Data
Proper cap bank switching
Condon Wind Farm Voltage
[kV]
time [s]
10 min
When cap switching control at Condon Wind works properly, the voltage stays within BPA
criteria as FSU studies predicted
- As confirmed by BPA via email on 11/22/2006](https://image.slidesharecdn.com/wecswithgrid-240711093443-5a27c893/85/GRID-integration-of-Wind-energy-conversion-system-23-320.jpg)