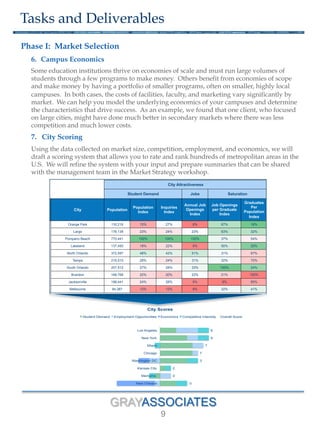
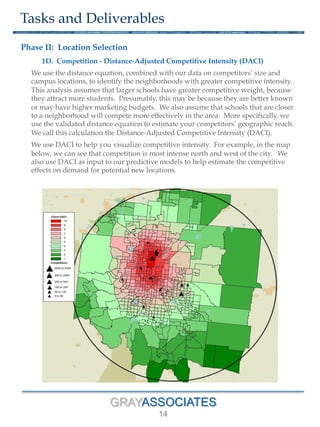
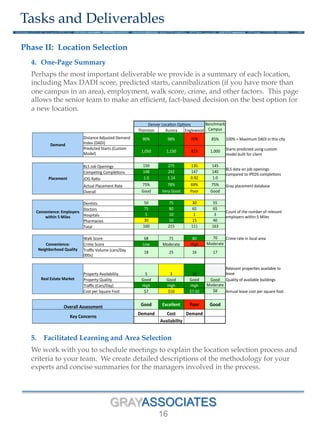
GRAYASSOCIATES
1
GRAYASSOCIATES
July 2015
Location Selection
GRAYASSOCIATES
2
1.  Select the geographic markets in which you can succeed.
§  Document the characteristics of a successful campus
−  Starts
−  Completions
−  Placement
−  Revenue
−  Profit
§  Identify and rank markets in which you could achieve these targets
2.  Identify the most attractive locations within these markets.
§  Determine how many campuses the selected markets could support
§  Evaluate each identified area’s convenience for students
−  Public transportation
−  Goods, services, and walkability
−  Safety
−  Employers, especially for clinical sites
§  Summarize the areas and enable your team to make fact-based decisions on the
best areas for a campus re-location
§  Create a preliminary view of property options and costs
§  Create predictive models that can also be used to evaluate other markets
Objectives
Gray location selection work helps you achieve the following objectives:
GRAYASSOCIATES
3
Approach
To achieve the objectives, Gray combines leading-edge databases and advanced analytics.
§  GrayData. As illustrated below, Gray has assembled a database on the market-
drivers of a successful campus or program, including: inquiries, applications,
demographics, competition, job openings, job postings, and placement rates. We
have mapped all the data down to the census tract level. We have built
crosswalks to link related variables, such as job openings and completions. We
have invested in a BI tool (QlikView) that enables us to rigorously screen
hundreds of cities, locations, or programs.
§  Advanced Location Analysis. We have developed proprietary approaches to
help you evaluate the effects of inquiry volume, distance, demographics, and
competition on student demand for a current or potential campus. These
techniques are described in more detail in the sections on Methodology and
Deliverables.
§  Customized Predictive Models. We combine advanced statistical techniques
with data on your students, local demographics, and competition to build models
that predict starts and other student outcomes (e.g., completions). We then run
these models for every tract in a market to determine which areas have the
greatest potential.
§  Access to Real Estate Options. We can work with Cushman & Wakefield to
identify preliminary property options and prices.
§  User-Friendly Approach. Gray uses an enormous amount of data and complex
analytics; however, we boil these down to clear maps and simple summaries. For
those who want to understand the underlying techniques, we schedule “deep
dives” so the techniques and their limitations can be fully understood.
GrayData
Demographics
U.S. Census
Job Postings
WANTED Analytics
Completions
IPEDS
Placement Rates
Gray Research
Employment
BLS/O*NET
Industry Inquiries
GrayReports
GRAYASSOCIATES
4
Methodology
Gray’s methodology starts with your targets for a new or relocated campus and ends when the
location selection team has agreed on the best options. We break the work into two phases, market
selection and location selection.
Phase I: Market Selection
1. Kick-Off Meeting. We recommend starting the project with a kick-off meeting for all of
your managers who are part of your location selection team. In the meeting we:
− Review Project Objectives and answer questions
− Refine the Work Plan and reach agreements on tasks, responsibilities, and deadlines
− Schedule Meetings to review progress and share findings
2. Campus Targets. We ask our clients to provide their enrollment, outcome, and financial
targets for a successful campus. If the targets are not known, we work with the client to
analyze the drivers of success and determine appropriate targets.
3. Student Demand: Inquiry Volumes. Gray provides relevant geo-coded data on
industry inquiries and applications. We also map relevant demographic factors to help
size student demand for your programs in every city in the U.S.
4. Competitive Intensity. Gray calculates the number of completions for your programs in
each city. We compare the completion volume to the relevant age group for your
programs (often age 18-34) and determine the number of completions per capita. We
compare completions per capita in each city to all other cities to identify cities with less
intense competition.
5. Employment Opportunities. For your programs, Gray compares completions to BLS job
openings to create a job-openings-per-graduate ratio (JOG). We compare the JOG for
each city to every other city to identify cities with greater employment opportunities for
your graduates. In addition, we pull placement rates, by program and city, to see which
cities have the best actual results for placement.
6. Campus Economics. Every school has a unique set of economics that underlie the
financial performance of a campus. Some require high volumes and scale in a few
programs, while other schools flourish with small campuses and programs. We help you
determine the economic drivers of your campuses and identify the types of cities that can
support them (e.g., high-cost major metros, or lower-cost smaller cities).
7.  City Scoring. Using the data collected on student demand, competitive intensity,
employment, and campus economics, we work with you to create and refine a scoring
system that reflects your strategy. Using the scoring system, we help you rate and rank
markets for your current and potential campuses.
8.  Market Strategy Workshop. We share the data, scoring system, and rankings with your
team in a one-day workshop. We incorporate the team’s suggestions into the scoring
system and allow them to add their judgment to the quantitative analysis. At the
conclusion of the workshop, you have a shared understanding and agreement on the
data, scoring, and cities selected.
GRAYASSOCIATES
5
Methodology
Phase II: Location Selection
1.  Student Demand: Predictive Models. We build statistical models to predict your
potential starts and completions using demographic data, distance analysis,
competitive intensity, inquiries, and your historical start and completion files. We
use these models to predict the number of starts and completions you should win
from each current and potential city. These models include several supporting
datasets and analyses.
− GrayReports Inquiry Data. Using our database on over 31 million
inquiries, Gray pulls the number and location of inquiries for your
programs and locations.
− Distance Analysis. Gray analysis quantifies the effect of distance on your
inquiries, starts, and completions.
− Demand: “Distance–Adjusted Demand Index (DADI).” Gray weights
the value of all inquiries based on their distance to a given tract. We map
this DADI score to highlight the areas closest to most demand.
− Competition: “Distance-Adjusted Competitive Index (DACI).” Gray
uses the size, location, and distance to each competitor to estimate the
intensity of competition in an area.
2.  Initial Scan of Available Properties. Optionally, Gray works with Cushman &
Wakefield to help you identify sites that fit your criteria in neighborhoods that
score highly on your criteria.
3.  Convenience: Descriptive Maps. We assess each area’s visibility and
convenience to students by creating maps of employers (and potential clinic
sites), transportation, crime, walkability, and traffic.
4.  One-Page Summary. We provide you with a clear, one-page summary of the
potential size of each campus and other key factors.
5.  Facilitated Learning and Area Selection. We work with client teams to share our
findings, answer questions, and incorporate their suggestions. We schedule
“deep dives” with relevant executives, so they can contribute to and fully
understand Gray’s methodologies. We also encourage the client to go to
proposed sites, validate the feel of the area, and conduct appropriate hands-on
evaluation. We ensure the client team understands where the best areas are for a
new campus, why these areas were selected, and the tradeoffs among these and
other choices.
Each of these steps and the associated deliverables are described in detail, below.
For current campuses, or the cities selected in Phase I, we evaluate local markets to determine the
attractiveness of current and potential future locations.
GRAYASSOCIATES
6
Tasks and Deliverables
1.  Kick-Off Meeting
We will facilitate a 1-2 hour kick-off meeting with the relevant members of your
location selection team. In the meeting, we share and refine project objectives, tasks,
and deliverables. We also ensure that the team’s responsibilities are understood.
2.  Campus Targets
There is a critical first step in location selection that is often skipped: defining the
admissions, operations, and placement characteristics of a successful location. This
step need not be complicated – a client may simply choose a current high-performing
campus and use its metrics. Since few campuses are successful on every metric,
some clients create a somewhat more complex combination of attributes from several
campuses to use for its campus targets. As illustrated in the example below, these
metrics then become the benchmarks that any new location must meet or exceed.
In this example, the new location must be in a market with at least 50,000 inquiries
for its programs. This inquiry volume should enable the school to achieve 525 starts.
Given this volume of starts, one would expect 170 completions. This leads to a
critical constraint: given the school’s placement target of 88%, it must be able to place
at least 150 graduates a year.
Phase I: Market Selection
50,000	
  
525	
  
170	
   150	
  
500	
  
1	
  
10	
  
100	
  
1,000	
  
10,000	
  
100,000	
  
Inquiries	
   Starts	
   Comple8ons	
   Placed	
  Grads	
   Revenue	
  (000s)	
  
New Campus: Target Metrics at Year 3
GRAYASSOCIATES
7
Tasks and Deliverables
3.  Student Demand: Inquiry Volumes
For each city, we pull inquiry volumes from GrayReports for the relevant programs.
As illustrated below, this allows us to compare the size and growth of each market.
We pull the data for these analyses for the specific programs you have selected.
Phase I: Market Selection
393,175	
  
305,691	
  
270,499	
   258,703	
  
238,160	
  
0	
  
50,000	
  
100,000	
  
150,000	
  
200,000	
  
250,000	
  
300,000	
  
350,000	
  
400,000	
  
450,000	
  
New	
  York-­‐Newark-­‐	
  
Jersey	
  City,	
  NY	
  -­‐	
  NJ	
  -­‐	
  PA	
  
Los	
  Angeles,	
  CA	
   Chicago-­‐Naperville-­‐	
  
Elgin,	
  IL	
  -­‐	
  IN	
  -­‐	
  WI	
  
Atlanta-­‐Sandy	
  Springs-­‐	
  
Roswell,	
  GA	
  
Dallas-­‐Fort	
  Worth-­‐	
  
Arlington,	
  TX	
  
Industry Inquiries
5 Largest Markets
12 Months Ending June 2014
-­‐19.5%	
   -­‐24.4%	
  
-­‐60.8%	
  
-­‐16.9%	
   -­‐19.2%	
  
-10.5% -13.7%
103.3%
-26.0%
-40.0%
-­‐70%	
  
-­‐50%	
  
-­‐30%	
  
-­‐10%	
  
10%	
  
30%	
  
50%	
  
70%	
  
90%	
  
110%	
  
130%	
  
Atlanta,	
  GA	
   Chicago,	
  IL	
   Los	
  Angeles,	
  CA	
   New	
  York,	
  NY	
   Philadelphia,	
  PA	
  
Changes in Industry Inquiries
5 Largest Markets
12 Months Ending June 2014
GRAYASSOCIATES
8
Tasks and Deliverables
Phase I: Market Selection
4. Competitive Intensity
The best metric we have developed to measure competitive intensity is completions per
capita for the program you select. Using completions per capita, we can compare every
market in the US to every other market, again using the specific programs you select. This
metric can also be broken down to distinguish for-profit completions per capita from not-for-
profit completions per capita.
5. Employment Opportunities
In today’s regulatory environment, access to sites for internships and clinical rotations is very
important, especially in healthcare. As part of our city evaluations, we size the local
employment market and we pull local placement rates from our database.
Using BLS, we also track job openings for your programs in the local market. We will
compare BLS projected job openings to the number of graduates, to create our Job
Opportunities per Graduate (JOG) ratio. When there are more jobs than grads (JOG>1), the
employment outlook is healthy. However, placement results often exceed – by a wide
margin – what BLS would suggest. Therefore, we strongly advise using BLS data only in
combination with actual placement results.
In our view, actual placement rates for
competing schools offering the same
programs will be the best indicator of
employment market health. If the
average rate in the local market for
your programs declines to 70% or
below, placing additional students will
likely be a challenge.
Gray Placement Analysis By City for Selected Programs
1,080	
  
363	
  
0	
  
200	
  
400	
  
600	
  
800	
  
1,000	
  
1,200	
  
2012	
  Job	
  Openings	
   2012	
  Graduates	
  
Foreign Language Teacher
Education JOG
JOG: 2.98
City	
   2011	
  Comple.ons	
   Placement	
  Rate	
   Placed	
  Students	
  
City	
  1	
   148	
   67%	
   99	
  
City	
  2	
   242	
   71%	
   173	
  
City	
  3	
   147	
   71%	
   104	
  
City	
  4	
   227	
   73%	
   166	
  
City	
  5	
   21	
   35%	
   7	
  
Total	
   785	
   70%	
   549	
  
GRAYASSOCIATES
9
Tasks and Deliverables
Phase I: Market Selection
6.  Campus Economics
Some education institutions thrive on economies of scale and must run large volumes of
students through a few programs to make money. Others benefit from economies of scope
and make money by having a portfolio of smaller programs, often on smaller, highly local
campuses. In both cases, the costs of facilities, faculty, and marketing vary significantly by
market. We can help you model the underlying economics of your campuses and determine
the characteristics that drive success. As an example, we found that one client, who focused
on large cities, might have done much better in secondary markets where there was less
competition and much lower costs.
7. City Scoring
Using the data collected on market size, competition, employment, and economics, we will
draft a scoring system that allows you to rate and rank hundreds of metropolitan areas in the
U.S. We will refine the system with your input and prepare summaries that can be shared
with the management team in the Market Strategy workshop.
City Attractiveness
Campus Attr
Student Demand Jobs Saturation
Brand City Population
Population
Index
Inquiries
Index
Annual Job
Openings
Index
Job Openings
per Graduate
Index
Graduates
Per
Population
Index
Demand
Index
Competitve
Index
Everest University
Orange Park 116,218 15% 27% 8% 67% 16% 69% 48%
Largo 176,138 23% 24% 23% 63% 32% 58% 40%
Pompano Beach 770,441 100% 100% 100% 37% 54% 100% 100%
Lakeland 137,450 18% 22% 9% 50% 20% 41% 22%
North Orlando 372,597 48% 42% 51% 31% 67% 88% 88%
Tampa 216,510 28% 24% 31% 32% 70% 83% 100%
South Orlando 207,512 27% 28% 33% 100% 24% 82% 67%
Brandon 168,768 22% 20% 23% 21% 100% 75% 93%
Jacksonville 186,441 24% 28% 9% 9% 85% 69% 62%
Melbourne 94,387 12% 12% 8% 32% 41% 16% 14%
Metric Definition
City City is defined by a 30 mile radius around each campus, for any campused with overlapping radi, geographies will be allocated to the closest cam
Population Population age group 18-34, 30-mile radius.
Population Index Population of selected city definition divided by the max population.
Inquiries Index Industry inquiries for Everest U's programs in each market.
Graduates Per Population Index Graduates in 2012 divided population age group 18-34.
Annual Job Openings Index Annual job opening for Everest U's programs.
Job Openings per Graduate Index Annual job openings divided by the number of graduates for Everest U's programs.
Demand Index - Distance Adjusted Demand Index
Distance adjusted industry inquiries indexed to the max volume across all Everest University campuses. Calculates the relative demand for every
tract within 30-mile assuming a normal industry distance factor.
Competitive Index - Distance Adjusted Competitve Index
Distance adjusted industry completions indexed to the max volume across all Everest University campuses. Calculates the relative competition fo
census tract within 30-mile assuming a normal industry distance factor.
Opportunity Index
Combines Demand and Competiton to identify underserved market potential. This metric calculates how much potential an individual market has
across all Everest University campuses.
Campus Program Viability The percent of programs in the individual market that score better than the mean scores for all 813 IPEDs programs at all Everest University cam
9
9
7
7
3
2
0
-3
Los Angeles
New York
Miami
Chicago
Washington DC
Kansas City
Memphis
New Orleans
City Scores
Student Demand Employment Opportunities Economics Competitive Intensity Overall Score
GRAYASSOCIATES
10
Tasks and Deliverables
Phase I: Market Selection
8.  Market Strategy Workshop
In the workshop, we share the data and analysis with your team, enable them to refine the
scoring, and incorporate their judgment into the final evaluations of current markets and
selection of new markets. They leave understanding the data, selection process, and choices
made by the team.
Phase II: Location Selection
Once the right cities are chosen, we focus on helping you select the best possible locations for
campuses in each city. This could apply to re-location of a campus coming up for lease renewal,
or selection of new locations in new cities. Our approach leverages the data collected in Phase I,
combined with custom models that predict student demand for your new locations.
1.  Demand: Predictive Models
We start this task by coding our client’s starts and completions into census tracts. That
enables us to compare client student data with over 300 census variables. In addition, we use
proprietary techniques (described below) for estimating the effects of distance on student
demand and competition. Our statistician uses this information to build custom models of
the relationship between your student demand – starts, completions, or placed completions –
and population, inquiries, distance, demographics, and competition. Your model can then be
used to predict how many total students you would attract at a new location—and we run
this estimate for every neighborhood (census tract) in the city. We also provide an estimate of
the accuracy of the model predictions, so you have a clear understanding of the underlying
uncertainties.
This enables us to create a map that shows the peak areas for your predicted starts and for
your predicted completions.
Location Predicted Starts
Option 1 1,000
Option 2 762
Option 3 300
Factor
Impact on Demand
Demographic Factors
Competitive Factors
Geographic Factors
Starts = e(Distance*X + Population*Y…)
“Zero-inflated
Poisson models”
Statistical Analysis
Predictive Model
Predicted Starts (or other Demand Metric) by Tract and Campus Location
2012 US Census
Data by Tract
Competitor locations
and completions
Client demand:
•  By campus and
census tract
•  Starts, completions, or
placed completions
GRAYASSOCIATES
11
Tasks and Deliverables
Phase II: Location Selection
1A. Demand: Inquiry Maps
Our inquiry maps are unique. We have agreements with major aggregators and
agencies who share their inquiry data with us. This dataset now includes over 30
million inquiries, covering hundreds of cities and programs. Further, most inquiry
maps are at the zip-code level; ours are at the census-tract level, which is nearly twice
as precise. We also include competitors on these maps – scaled by their enrollment
or, in this case, by their change in enrollment (2011 vs. 2012).
As illustrated in the map below, we create inquiry maps for the cities you choose to
explore, so you can see where inquiries and demand come from in the area.
But seeing where demand comes from by census tract does not answer the question –
where would the most students be willing to travel to go to school?
Data are for
illustration only.
GRAYASSOCIATES
12
Tasks and Deliverables
Phase II: Location Selection
1B. Demand: Distance Analysis
In our view, the effect of distance is profound: potential students who are further
from a campus are less likely to inquire, apply, start, and complete. The question we
help answer is, “How large is this effect?” To assess the effect of distance, we
compare your data with GrayReports inquiries and demographic information to
measure erosion in inquiries and starts as distance from campus increases. Using
your historical data, we also evaluate the effect of distance on retention.
Let’s look at one example: share of inquiries. In our experience, we have found that
share of GrayReports inquiries drops quickly as distance increases. As shown in the
illustration below, in areas within a mile from campus, this hypothetical client’s share
of inquiries is over 20%; 8 miles away, it is just 10%. (Note: data has been disguised.)
Once we develop a distance equation that accurately portrays the impact of distance
on student demand for your programs, we apply it to help evaluate both demand
and competition. Next, we’ll show how it can be used to identify the peak-demand
locations in a city.
y = -0.02x + 0.2404
R² = 0.90
0 1 2 3 4 5 6 7 8 9
Distance From Campus (Miles)
Client Share vs. Distance
Example: 0-8 Miles30%
Data are for
illustration only.
GRAYASSOCIATES
13
Tasks and Deliverables
Phase II: Location Selection
1C. Demand: Distance-Adjusted Demand Intensity (DADI)
Using the distance equation and our inquiry data, Gray estimates the Distance-
Adjusted Demand Intensity (DADI) – essentially the distance-weighted inquiry
volume for a location given its distance to every other tract. The tracts with the
highest DADI scores are closer to more inquiries than all other locations in the city.
We will also estimate how far off-peak every other location is; in this example, each
change in color shows a 2-3% drop in DADI at the high end (greens) and a 10% swing
below that. The fastest growing campus (+7%) is also in the Max DADI area, while
those outside this area tend to be shrinking.
Using similar techniques, we can also help you understand competitive intensity, by
neighborhood, and program.
Data are for
illustration only.
GRAYASSOCIATES
14
Tasks and Deliverables
Phase II: Location Selection
1D. Competition - Distance-Adjusted Competitive Intensity (DACI)
We use the distance equation, combined with our data on competitors’ size and
campus locations, to identify the neighborhoods with greater competitive intensity.
This analysis assumes that larger schools have greater competitive weight, because
they attract more students. Presumably, this may be because they are better known
or may have higher marketing budgets. We also assume that schools that are closer
to a neighborhood will compete more effectively in the area. More specifically, we
use the validated distance equation to estimate your competitors’ geographic reach.
We call this calculation the Distance-Adjusted Competitive Intensity (DACI).
We use DACI to help you visualize competitive intensity. For example, in the map
below, we can see that competition is most intense north and west of the city. We
also use DACI as input to our predictive models to help estimate the competitive
effects on demand for potential new locations.
GRAYASSOCIATES
15
Tasks and Deliverables
Phase II: Location Selection
2.  Initial Scan of Available Properties
Working with Cushman & Wakefield’s Education Group or the real estate firm of
your choice, we can help you identify properties available in or near the highest
potential areas in the city.
3.  Convenience, Descriptive Maps
We also explore the areas near high-demand locations to be sure they are convenient
and safe for students. Walk Scores summarize access to stores and services near the
site, such as transportation and restaurants. It is important that the neighborhood is
safe, so we also map local crime rates. To evaluate access to employers, we map their
locations for each program and employer type. Traffic counts and public
transportation maps are also provided.
• 	
  	
  Hospitals	
  
• 	
  	
  Walk	
  Score	
  (Green	
  is	
  more	
  walkable)	
   • 	
  	
  Crime	
  Score	
  (Darker	
  is	
  more	
  safe)	
  
• 	
  	
  Traffic	
  
GRAYASSOCIATES
16
Tasks and Deliverables
Phase II: Location Selection
4.  One-Page Summary
Perhaps the most important deliverable we provide is a summary of each location,
including Max DADI score, predicted starts, cannibalization (if you have more than
one campus in an area), employment, walk score, crime, and other factors. This page
allows the senior team to make an efficient, fact-based decision on the best option for
a new location.
5. Facilitated Learning and Area Selection
We work with you to schedule meetings to explain the location selection process and
criteria to your team. We create detailed descriptions of the methodology for your
experts and concise summaries for the managers involved in the process.
Denver&Loca+on&Op+ons& Benchmark&
Campus&&Thornton& Aurora& Englewood&
Demand'
Distance&Adjusted&Demand&
Index&(DADI)&
90%& 98%& 70%& 85%& 100%&=&Maximum&DADI&in&this&city&
Predicted&Starts&(Custom&
Model)&
1,050& 1,150& 823& 1,000& Starts&predicted&using&custom&
model&built&for&client&
&& && && &&
Placement''
BLS&Job&Openings& 150& 275& 135& 145&
BLS&data&on&job&openings&
compared&to&IPEDS&comple+ons&Compe+ng&Comple+ons& 148& 242& 147& 140&
JOG&Ra+o& 1.0& 1.14& 0.92& 1.0&
Actual&Placement&Rate& 75%& 78%& 69%& 75%& Gray&placement&database&
Overall& Good& Very&Good& Poor& Good&
&& && && &&
Convenience:'Employers'
within'5'Miles'
Den+sts& 50& 75& 30& 55&
Count&of&the&number&of&relevant&
employers&within&5&Miles&
Doctors& 75& 80& 65& 65&
Hospitals& 5& 10& 1& 3&
Pharmacies& 30& 50& 15& 40&
Total& 160& 215& 111& 163&
&& && && &&
Convenience:''''''
Neighborhood'Quality'
Walk&Score& 68& 71& 80& 70& Crime&rate&in&local&area&
Crime&Score& Low& Moderate& High& Moderate&
Traffic&Volume&(cars/Day&
000s)&
18& 25& 16& 17&
'' && && && && &&
Real'Estate'Market'
Property&Availability&& 5& 3& 10&
&& Relevant&proper+es&available&to&
lease&
Property&Quality& Good& Good& Good& Good& Quality&of&available&buildings&
Traffic&(Cars/Day)& High& High& High& Moderate&
Cost&per&Square&Foot& $7&& $10&& $7.50&& $8&& Annual&lease&cost&per&square&foot.&
&& && &&
Overall'Assessment' Good' Excellent' Poor' Good'
Key'Concerns'
Demand' Cost' Demand' ''
'' Availability' '' ''

Gray Associates - Campus Location Selection

  • 1.
  • 2.
    GRAYASSOCIATES 2 1.  Select thegeographic markets in which you can succeed. §  Document the characteristics of a successful campus −  Starts −  Completions −  Placement −  Revenue −  Profit §  Identify and rank markets in which you could achieve these targets 2.  Identify the most attractive locations within these markets. §  Determine how many campuses the selected markets could support §  Evaluate each identified area’s convenience for students −  Public transportation −  Goods, services, and walkability −  Safety −  Employers, especially for clinical sites §  Summarize the areas and enable your team to make fact-based decisions on the best areas for a campus re-location §  Create a preliminary view of property options and costs §  Create predictive models that can also be used to evaluate other markets Objectives Gray location selection work helps you achieve the following objectives:
  • 3.
    GRAYASSOCIATES 3 Approach To achieve theobjectives, Gray combines leading-edge databases and advanced analytics. §  GrayData. As illustrated below, Gray has assembled a database on the market- drivers of a successful campus or program, including: inquiries, applications, demographics, competition, job openings, job postings, and placement rates. We have mapped all the data down to the census tract level. We have built crosswalks to link related variables, such as job openings and completions. We have invested in a BI tool (QlikView) that enables us to rigorously screen hundreds of cities, locations, or programs. §  Advanced Location Analysis. We have developed proprietary approaches to help you evaluate the effects of inquiry volume, distance, demographics, and competition on student demand for a current or potential campus. These techniques are described in more detail in the sections on Methodology and Deliverables. §  Customized Predictive Models. We combine advanced statistical techniques with data on your students, local demographics, and competition to build models that predict starts and other student outcomes (e.g., completions). We then run these models for every tract in a market to determine which areas have the greatest potential. §  Access to Real Estate Options. We can work with Cushman & Wakefield to identify preliminary property options and prices. §  User-Friendly Approach. Gray uses an enormous amount of data and complex analytics; however, we boil these down to clear maps and simple summaries. For those who want to understand the underlying techniques, we schedule “deep dives” so the techniques and their limitations can be fully understood. GrayData Demographics U.S. Census Job Postings WANTED Analytics Completions IPEDS Placement Rates Gray Research Employment BLS/O*NET Industry Inquiries GrayReports
  • 4.
    GRAYASSOCIATES 4 Methodology Gray’s methodology startswith your targets for a new or relocated campus and ends when the location selection team has agreed on the best options. We break the work into two phases, market selection and location selection. Phase I: Market Selection 1. Kick-Off Meeting. We recommend starting the project with a kick-off meeting for all of your managers who are part of your location selection team. In the meeting we: − Review Project Objectives and answer questions − Refine the Work Plan and reach agreements on tasks, responsibilities, and deadlines − Schedule Meetings to review progress and share findings 2. Campus Targets. We ask our clients to provide their enrollment, outcome, and financial targets for a successful campus. If the targets are not known, we work with the client to analyze the drivers of success and determine appropriate targets. 3. Student Demand: Inquiry Volumes. Gray provides relevant geo-coded data on industry inquiries and applications. We also map relevant demographic factors to help size student demand for your programs in every city in the U.S. 4. Competitive Intensity. Gray calculates the number of completions for your programs in each city. We compare the completion volume to the relevant age group for your programs (often age 18-34) and determine the number of completions per capita. We compare completions per capita in each city to all other cities to identify cities with less intense competition. 5. Employment Opportunities. For your programs, Gray compares completions to BLS job openings to create a job-openings-per-graduate ratio (JOG). We compare the JOG for each city to every other city to identify cities with greater employment opportunities for your graduates. In addition, we pull placement rates, by program and city, to see which cities have the best actual results for placement. 6. Campus Economics. Every school has a unique set of economics that underlie the financial performance of a campus. Some require high volumes and scale in a few programs, while other schools flourish with small campuses and programs. We help you determine the economic drivers of your campuses and identify the types of cities that can support them (e.g., high-cost major metros, or lower-cost smaller cities). 7.  City Scoring. Using the data collected on student demand, competitive intensity, employment, and campus economics, we work with you to create and refine a scoring system that reflects your strategy. Using the scoring system, we help you rate and rank markets for your current and potential campuses. 8.  Market Strategy Workshop. We share the data, scoring system, and rankings with your team in a one-day workshop. We incorporate the team’s suggestions into the scoring system and allow them to add their judgment to the quantitative analysis. At the conclusion of the workshop, you have a shared understanding and agreement on the data, scoring, and cities selected.
  • 5.
    GRAYASSOCIATES 5 Methodology Phase II: LocationSelection 1.  Student Demand: Predictive Models. We build statistical models to predict your potential starts and completions using demographic data, distance analysis, competitive intensity, inquiries, and your historical start and completion files. We use these models to predict the number of starts and completions you should win from each current and potential city. These models include several supporting datasets and analyses. − GrayReports Inquiry Data. Using our database on over 31 million inquiries, Gray pulls the number and location of inquiries for your programs and locations. − Distance Analysis. Gray analysis quantifies the effect of distance on your inquiries, starts, and completions. − Demand: “Distance–Adjusted Demand Index (DADI).” Gray weights the value of all inquiries based on their distance to a given tract. We map this DADI score to highlight the areas closest to most demand. − Competition: “Distance-Adjusted Competitive Index (DACI).” Gray uses the size, location, and distance to each competitor to estimate the intensity of competition in an area. 2.  Initial Scan of Available Properties. Optionally, Gray works with Cushman & Wakefield to help you identify sites that fit your criteria in neighborhoods that score highly on your criteria. 3.  Convenience: Descriptive Maps. We assess each area’s visibility and convenience to students by creating maps of employers (and potential clinic sites), transportation, crime, walkability, and traffic. 4.  One-Page Summary. We provide you with a clear, one-page summary of the potential size of each campus and other key factors. 5.  Facilitated Learning and Area Selection. We work with client teams to share our findings, answer questions, and incorporate their suggestions. We schedule “deep dives” with relevant executives, so they can contribute to and fully understand Gray’s methodologies. We also encourage the client to go to proposed sites, validate the feel of the area, and conduct appropriate hands-on evaluation. We ensure the client team understands where the best areas are for a new campus, why these areas were selected, and the tradeoffs among these and other choices. Each of these steps and the associated deliverables are described in detail, below. For current campuses, or the cities selected in Phase I, we evaluate local markets to determine the attractiveness of current and potential future locations.
  • 6.
    GRAYASSOCIATES 6 Tasks and Deliverables 1. Kick-Off Meeting We will facilitate a 1-2 hour kick-off meeting with the relevant members of your location selection team. In the meeting, we share and refine project objectives, tasks, and deliverables. We also ensure that the team’s responsibilities are understood. 2.  Campus Targets There is a critical first step in location selection that is often skipped: defining the admissions, operations, and placement characteristics of a successful location. This step need not be complicated – a client may simply choose a current high-performing campus and use its metrics. Since few campuses are successful on every metric, some clients create a somewhat more complex combination of attributes from several campuses to use for its campus targets. As illustrated in the example below, these metrics then become the benchmarks that any new location must meet or exceed. In this example, the new location must be in a market with at least 50,000 inquiries for its programs. This inquiry volume should enable the school to achieve 525 starts. Given this volume of starts, one would expect 170 completions. This leads to a critical constraint: given the school’s placement target of 88%, it must be able to place at least 150 graduates a year. Phase I: Market Selection 50,000   525   170   150   500   1   10   100   1,000   10,000   100,000   Inquiries   Starts   Comple8ons   Placed  Grads   Revenue  (000s)   New Campus: Target Metrics at Year 3
  • 7.
    GRAYASSOCIATES 7 Tasks and Deliverables 3. Student Demand: Inquiry Volumes For each city, we pull inquiry volumes from GrayReports for the relevant programs. As illustrated below, this allows us to compare the size and growth of each market. We pull the data for these analyses for the specific programs you have selected. Phase I: Market Selection 393,175   305,691   270,499   258,703   238,160   0   50,000   100,000   150,000   200,000   250,000   300,000   350,000   400,000   450,000   New  York-­‐Newark-­‐   Jersey  City,  NY  -­‐  NJ  -­‐  PA   Los  Angeles,  CA   Chicago-­‐Naperville-­‐   Elgin,  IL  -­‐  IN  -­‐  WI   Atlanta-­‐Sandy  Springs-­‐   Roswell,  GA   Dallas-­‐Fort  Worth-­‐   Arlington,  TX   Industry Inquiries 5 Largest Markets 12 Months Ending June 2014 -­‐19.5%   -­‐24.4%   -­‐60.8%   -­‐16.9%   -­‐19.2%   -10.5% -13.7% 103.3% -26.0% -40.0% -­‐70%   -­‐50%   -­‐30%   -­‐10%   10%   30%   50%   70%   90%   110%   130%   Atlanta,  GA   Chicago,  IL   Los  Angeles,  CA   New  York,  NY   Philadelphia,  PA   Changes in Industry Inquiries 5 Largest Markets 12 Months Ending June 2014
  • 8.
    GRAYASSOCIATES 8 Tasks and Deliverables PhaseI: Market Selection 4. Competitive Intensity The best metric we have developed to measure competitive intensity is completions per capita for the program you select. Using completions per capita, we can compare every market in the US to every other market, again using the specific programs you select. This metric can also be broken down to distinguish for-profit completions per capita from not-for- profit completions per capita. 5. Employment Opportunities In today’s regulatory environment, access to sites for internships and clinical rotations is very important, especially in healthcare. As part of our city evaluations, we size the local employment market and we pull local placement rates from our database. Using BLS, we also track job openings for your programs in the local market. We will compare BLS projected job openings to the number of graduates, to create our Job Opportunities per Graduate (JOG) ratio. When there are more jobs than grads (JOG>1), the employment outlook is healthy. However, placement results often exceed – by a wide margin – what BLS would suggest. Therefore, we strongly advise using BLS data only in combination with actual placement results. In our view, actual placement rates for competing schools offering the same programs will be the best indicator of employment market health. If the average rate in the local market for your programs declines to 70% or below, placing additional students will likely be a challenge. Gray Placement Analysis By City for Selected Programs 1,080   363   0   200   400   600   800   1,000   1,200   2012  Job  Openings   2012  Graduates   Foreign Language Teacher Education JOG JOG: 2.98 City   2011  Comple.ons   Placement  Rate   Placed  Students   City  1   148   67%   99   City  2   242   71%   173   City  3   147   71%   104   City  4   227   73%   166   City  5   21   35%   7   Total   785   70%   549  
  • 9.
    GRAYASSOCIATES 9 Tasks and Deliverables PhaseI: Market Selection 6.  Campus Economics Some education institutions thrive on economies of scale and must run large volumes of students through a few programs to make money. Others benefit from economies of scope and make money by having a portfolio of smaller programs, often on smaller, highly local campuses. In both cases, the costs of facilities, faculty, and marketing vary significantly by market. We can help you model the underlying economics of your campuses and determine the characteristics that drive success. As an example, we found that one client, who focused on large cities, might have done much better in secondary markets where there was less competition and much lower costs. 7. City Scoring Using the data collected on market size, competition, employment, and economics, we will draft a scoring system that allows you to rate and rank hundreds of metropolitan areas in the U.S. We will refine the system with your input and prepare summaries that can be shared with the management team in the Market Strategy workshop. City Attractiveness Campus Attr Student Demand Jobs Saturation Brand City Population Population Index Inquiries Index Annual Job Openings Index Job Openings per Graduate Index Graduates Per Population Index Demand Index Competitve Index Everest University Orange Park 116,218 15% 27% 8% 67% 16% 69% 48% Largo 176,138 23% 24% 23% 63% 32% 58% 40% Pompano Beach 770,441 100% 100% 100% 37% 54% 100% 100% Lakeland 137,450 18% 22% 9% 50% 20% 41% 22% North Orlando 372,597 48% 42% 51% 31% 67% 88% 88% Tampa 216,510 28% 24% 31% 32% 70% 83% 100% South Orlando 207,512 27% 28% 33% 100% 24% 82% 67% Brandon 168,768 22% 20% 23% 21% 100% 75% 93% Jacksonville 186,441 24% 28% 9% 9% 85% 69% 62% Melbourne 94,387 12% 12% 8% 32% 41% 16% 14% Metric Definition City City is defined by a 30 mile radius around each campus, for any campused with overlapping radi, geographies will be allocated to the closest cam Population Population age group 18-34, 30-mile radius. Population Index Population of selected city definition divided by the max population. Inquiries Index Industry inquiries for Everest U's programs in each market. Graduates Per Population Index Graduates in 2012 divided population age group 18-34. Annual Job Openings Index Annual job opening for Everest U's programs. Job Openings per Graduate Index Annual job openings divided by the number of graduates for Everest U's programs. Demand Index - Distance Adjusted Demand Index Distance adjusted industry inquiries indexed to the max volume across all Everest University campuses. Calculates the relative demand for every tract within 30-mile assuming a normal industry distance factor. Competitive Index - Distance Adjusted Competitve Index Distance adjusted industry completions indexed to the max volume across all Everest University campuses. Calculates the relative competition fo census tract within 30-mile assuming a normal industry distance factor. Opportunity Index Combines Demand and Competiton to identify underserved market potential. This metric calculates how much potential an individual market has across all Everest University campuses. Campus Program Viability The percent of programs in the individual market that score better than the mean scores for all 813 IPEDs programs at all Everest University cam 9 9 7 7 3 2 0 -3 Los Angeles New York Miami Chicago Washington DC Kansas City Memphis New Orleans City Scores Student Demand Employment Opportunities Economics Competitive Intensity Overall Score
  • 10.
    GRAYASSOCIATES 10 Tasks and Deliverables PhaseI: Market Selection 8.  Market Strategy Workshop In the workshop, we share the data and analysis with your team, enable them to refine the scoring, and incorporate their judgment into the final evaluations of current markets and selection of new markets. They leave understanding the data, selection process, and choices made by the team. Phase II: Location Selection Once the right cities are chosen, we focus on helping you select the best possible locations for campuses in each city. This could apply to re-location of a campus coming up for lease renewal, or selection of new locations in new cities. Our approach leverages the data collected in Phase I, combined with custom models that predict student demand for your new locations. 1.  Demand: Predictive Models We start this task by coding our client’s starts and completions into census tracts. That enables us to compare client student data with over 300 census variables. In addition, we use proprietary techniques (described below) for estimating the effects of distance on student demand and competition. Our statistician uses this information to build custom models of the relationship between your student demand – starts, completions, or placed completions – and population, inquiries, distance, demographics, and competition. Your model can then be used to predict how many total students you would attract at a new location—and we run this estimate for every neighborhood (census tract) in the city. We also provide an estimate of the accuracy of the model predictions, so you have a clear understanding of the underlying uncertainties. This enables us to create a map that shows the peak areas for your predicted starts and for your predicted completions. Location Predicted Starts Option 1 1,000 Option 2 762 Option 3 300 Factor Impact on Demand Demographic Factors Competitive Factors Geographic Factors Starts = e(Distance*X + Population*Y…) “Zero-inflated Poisson models” Statistical Analysis Predictive Model Predicted Starts (or other Demand Metric) by Tract and Campus Location 2012 US Census Data by Tract Competitor locations and completions Client demand: •  By campus and census tract •  Starts, completions, or placed completions
  • 11.
    GRAYASSOCIATES 11 Tasks and Deliverables PhaseII: Location Selection 1A. Demand: Inquiry Maps Our inquiry maps are unique. We have agreements with major aggregators and agencies who share their inquiry data with us. This dataset now includes over 30 million inquiries, covering hundreds of cities and programs. Further, most inquiry maps are at the zip-code level; ours are at the census-tract level, which is nearly twice as precise. We also include competitors on these maps – scaled by their enrollment or, in this case, by their change in enrollment (2011 vs. 2012). As illustrated in the map below, we create inquiry maps for the cities you choose to explore, so you can see where inquiries and demand come from in the area. But seeing where demand comes from by census tract does not answer the question – where would the most students be willing to travel to go to school? Data are for illustration only.
  • 12.
    GRAYASSOCIATES 12 Tasks and Deliverables PhaseII: Location Selection 1B. Demand: Distance Analysis In our view, the effect of distance is profound: potential students who are further from a campus are less likely to inquire, apply, start, and complete. The question we help answer is, “How large is this effect?” To assess the effect of distance, we compare your data with GrayReports inquiries and demographic information to measure erosion in inquiries and starts as distance from campus increases. Using your historical data, we also evaluate the effect of distance on retention. Let’s look at one example: share of inquiries. In our experience, we have found that share of GrayReports inquiries drops quickly as distance increases. As shown in the illustration below, in areas within a mile from campus, this hypothetical client’s share of inquiries is over 20%; 8 miles away, it is just 10%. (Note: data has been disguised.) Once we develop a distance equation that accurately portrays the impact of distance on student demand for your programs, we apply it to help evaluate both demand and competition. Next, we’ll show how it can be used to identify the peak-demand locations in a city. y = -0.02x + 0.2404 R² = 0.90 0 1 2 3 4 5 6 7 8 9 Distance From Campus (Miles) Client Share vs. Distance Example: 0-8 Miles30% Data are for illustration only.
  • 13.
    GRAYASSOCIATES 13 Tasks and Deliverables PhaseII: Location Selection 1C. Demand: Distance-Adjusted Demand Intensity (DADI) Using the distance equation and our inquiry data, Gray estimates the Distance- Adjusted Demand Intensity (DADI) – essentially the distance-weighted inquiry volume for a location given its distance to every other tract. The tracts with the highest DADI scores are closer to more inquiries than all other locations in the city. We will also estimate how far off-peak every other location is; in this example, each change in color shows a 2-3% drop in DADI at the high end (greens) and a 10% swing below that. The fastest growing campus (+7%) is also in the Max DADI area, while those outside this area tend to be shrinking. Using similar techniques, we can also help you understand competitive intensity, by neighborhood, and program. Data are for illustration only.
  • 14.
    GRAYASSOCIATES 14 Tasks and Deliverables PhaseII: Location Selection 1D. Competition - Distance-Adjusted Competitive Intensity (DACI) We use the distance equation, combined with our data on competitors’ size and campus locations, to identify the neighborhoods with greater competitive intensity. This analysis assumes that larger schools have greater competitive weight, because they attract more students. Presumably, this may be because they are better known or may have higher marketing budgets. We also assume that schools that are closer to a neighborhood will compete more effectively in the area. More specifically, we use the validated distance equation to estimate your competitors’ geographic reach. We call this calculation the Distance-Adjusted Competitive Intensity (DACI). We use DACI to help you visualize competitive intensity. For example, in the map below, we can see that competition is most intense north and west of the city. We also use DACI as input to our predictive models to help estimate the competitive effects on demand for potential new locations.
  • 15.
    GRAYASSOCIATES 15 Tasks and Deliverables PhaseII: Location Selection 2.  Initial Scan of Available Properties Working with Cushman & Wakefield’s Education Group or the real estate firm of your choice, we can help you identify properties available in or near the highest potential areas in the city. 3.  Convenience, Descriptive Maps We also explore the areas near high-demand locations to be sure they are convenient and safe for students. Walk Scores summarize access to stores and services near the site, such as transportation and restaurants. It is important that the neighborhood is safe, so we also map local crime rates. To evaluate access to employers, we map their locations for each program and employer type. Traffic counts and public transportation maps are also provided. •     Hospitals   •     Walk  Score  (Green  is  more  walkable)   •     Crime  Score  (Darker  is  more  safe)   •     Traffic  
  • 16.
    GRAYASSOCIATES 16 Tasks and Deliverables PhaseII: Location Selection 4.  One-Page Summary Perhaps the most important deliverable we provide is a summary of each location, including Max DADI score, predicted starts, cannibalization (if you have more than one campus in an area), employment, walk score, crime, and other factors. This page allows the senior team to make an efficient, fact-based decision on the best option for a new location. 5. Facilitated Learning and Area Selection We work with you to schedule meetings to explain the location selection process and criteria to your team. We create detailed descriptions of the methodology for your experts and concise summaries for the managers involved in the process. Denver&Loca+on&Op+ons& Benchmark& Campus&&Thornton& Aurora& Englewood& Demand' Distance&Adjusted&Demand& Index&(DADI)& 90%& 98%& 70%& 85%& 100%&=&Maximum&DADI&in&this&city& Predicted&Starts&(Custom& Model)& 1,050& 1,150& 823& 1,000& Starts&predicted&using&custom& model&built&for&client& && && && && Placement'' BLS&Job&Openings& 150& 275& 135& 145& BLS&data&on&job&openings& compared&to&IPEDS&comple+ons&Compe+ng&Comple+ons& 148& 242& 147& 140& JOG&Ra+o& 1.0& 1.14& 0.92& 1.0& Actual&Placement&Rate& 75%& 78%& 69%& 75%& Gray&placement&database& Overall& Good& Very&Good& Poor& Good& && && && && Convenience:'Employers' within'5'Miles' Den+sts& 50& 75& 30& 55& Count&of&the&number&of&relevant& employers&within&5&Miles& Doctors& 75& 80& 65& 65& Hospitals& 5& 10& 1& 3& Pharmacies& 30& 50& 15& 40& Total& 160& 215& 111& 163& && && && && Convenience:'''''' Neighborhood'Quality' Walk&Score& 68& 71& 80& 70& Crime&rate&in&local&area& Crime&Score& Low& Moderate& High& Moderate& Traffic&Volume&(cars/Day& 000s)& 18& 25& 16& 17& '' && && && && && Real'Estate'Market' Property&Availability&& 5& 3& 10& && Relevant&proper+es&available&to& lease& Property&Quality& Good& Good& Good& Good& Quality&of&available&buildings& Traffic&(Cars/Day)& High& High& High& Moderate& Cost&per&Square&Foot& $7&& $10&& $7.50&& $8&& Annual&lease&cost&per&square&foot.& && && && Overall'Assessment' Good' Excellent' Poor' Good' Key'Concerns' Demand' Cost' Demand' '' '' Availability' '' ''