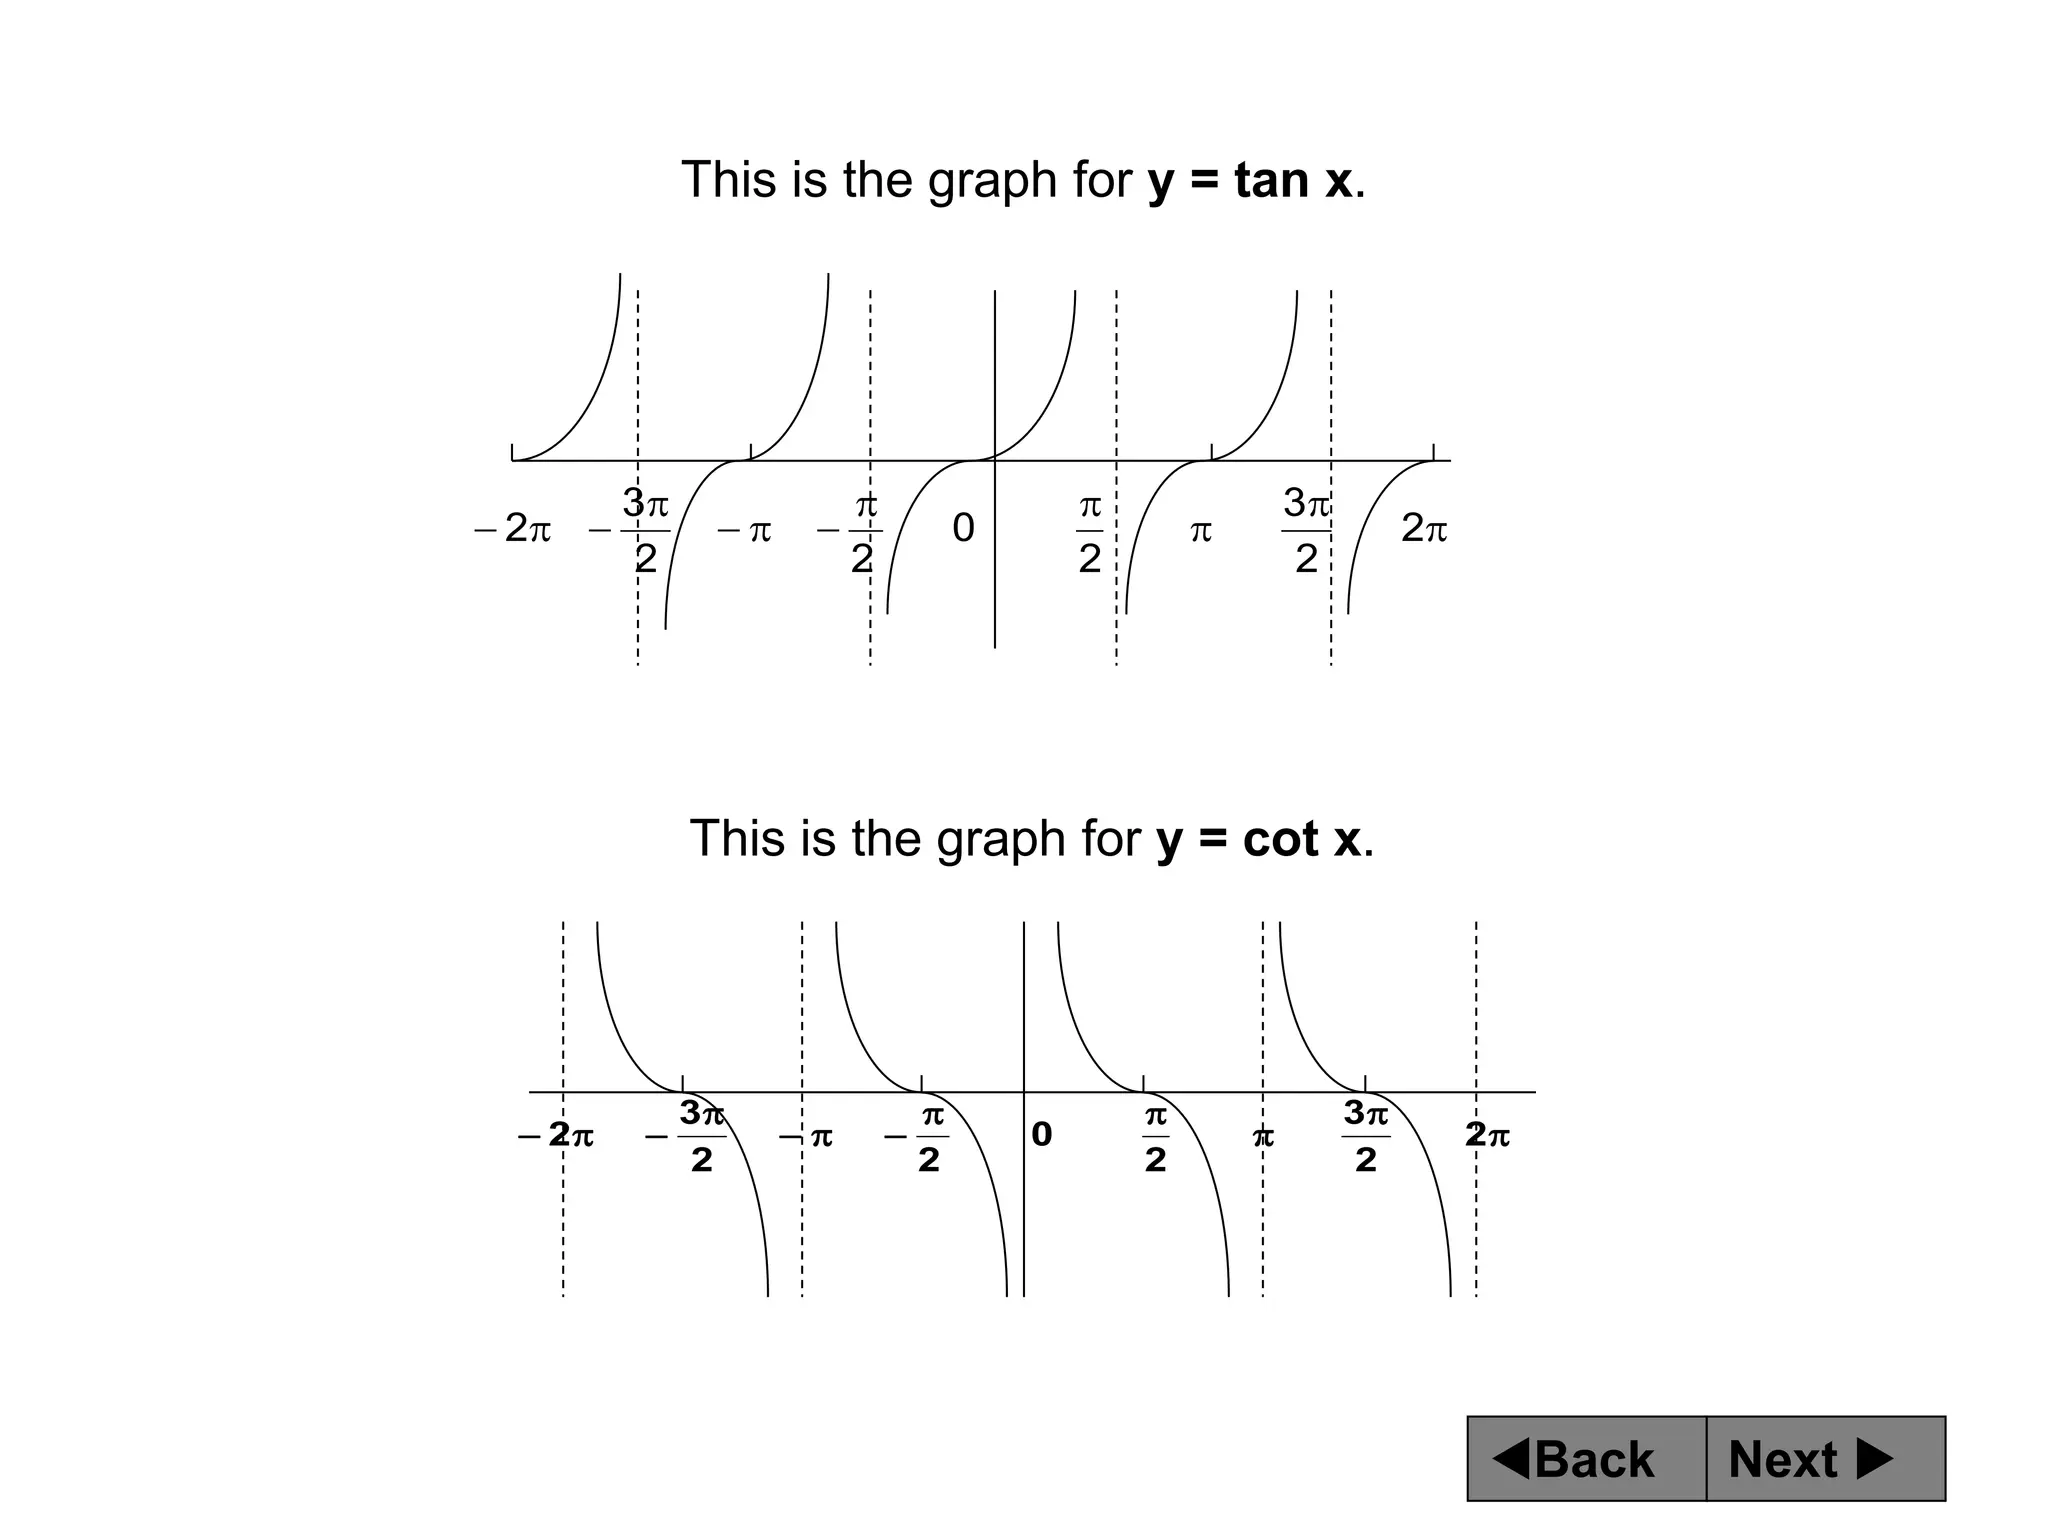
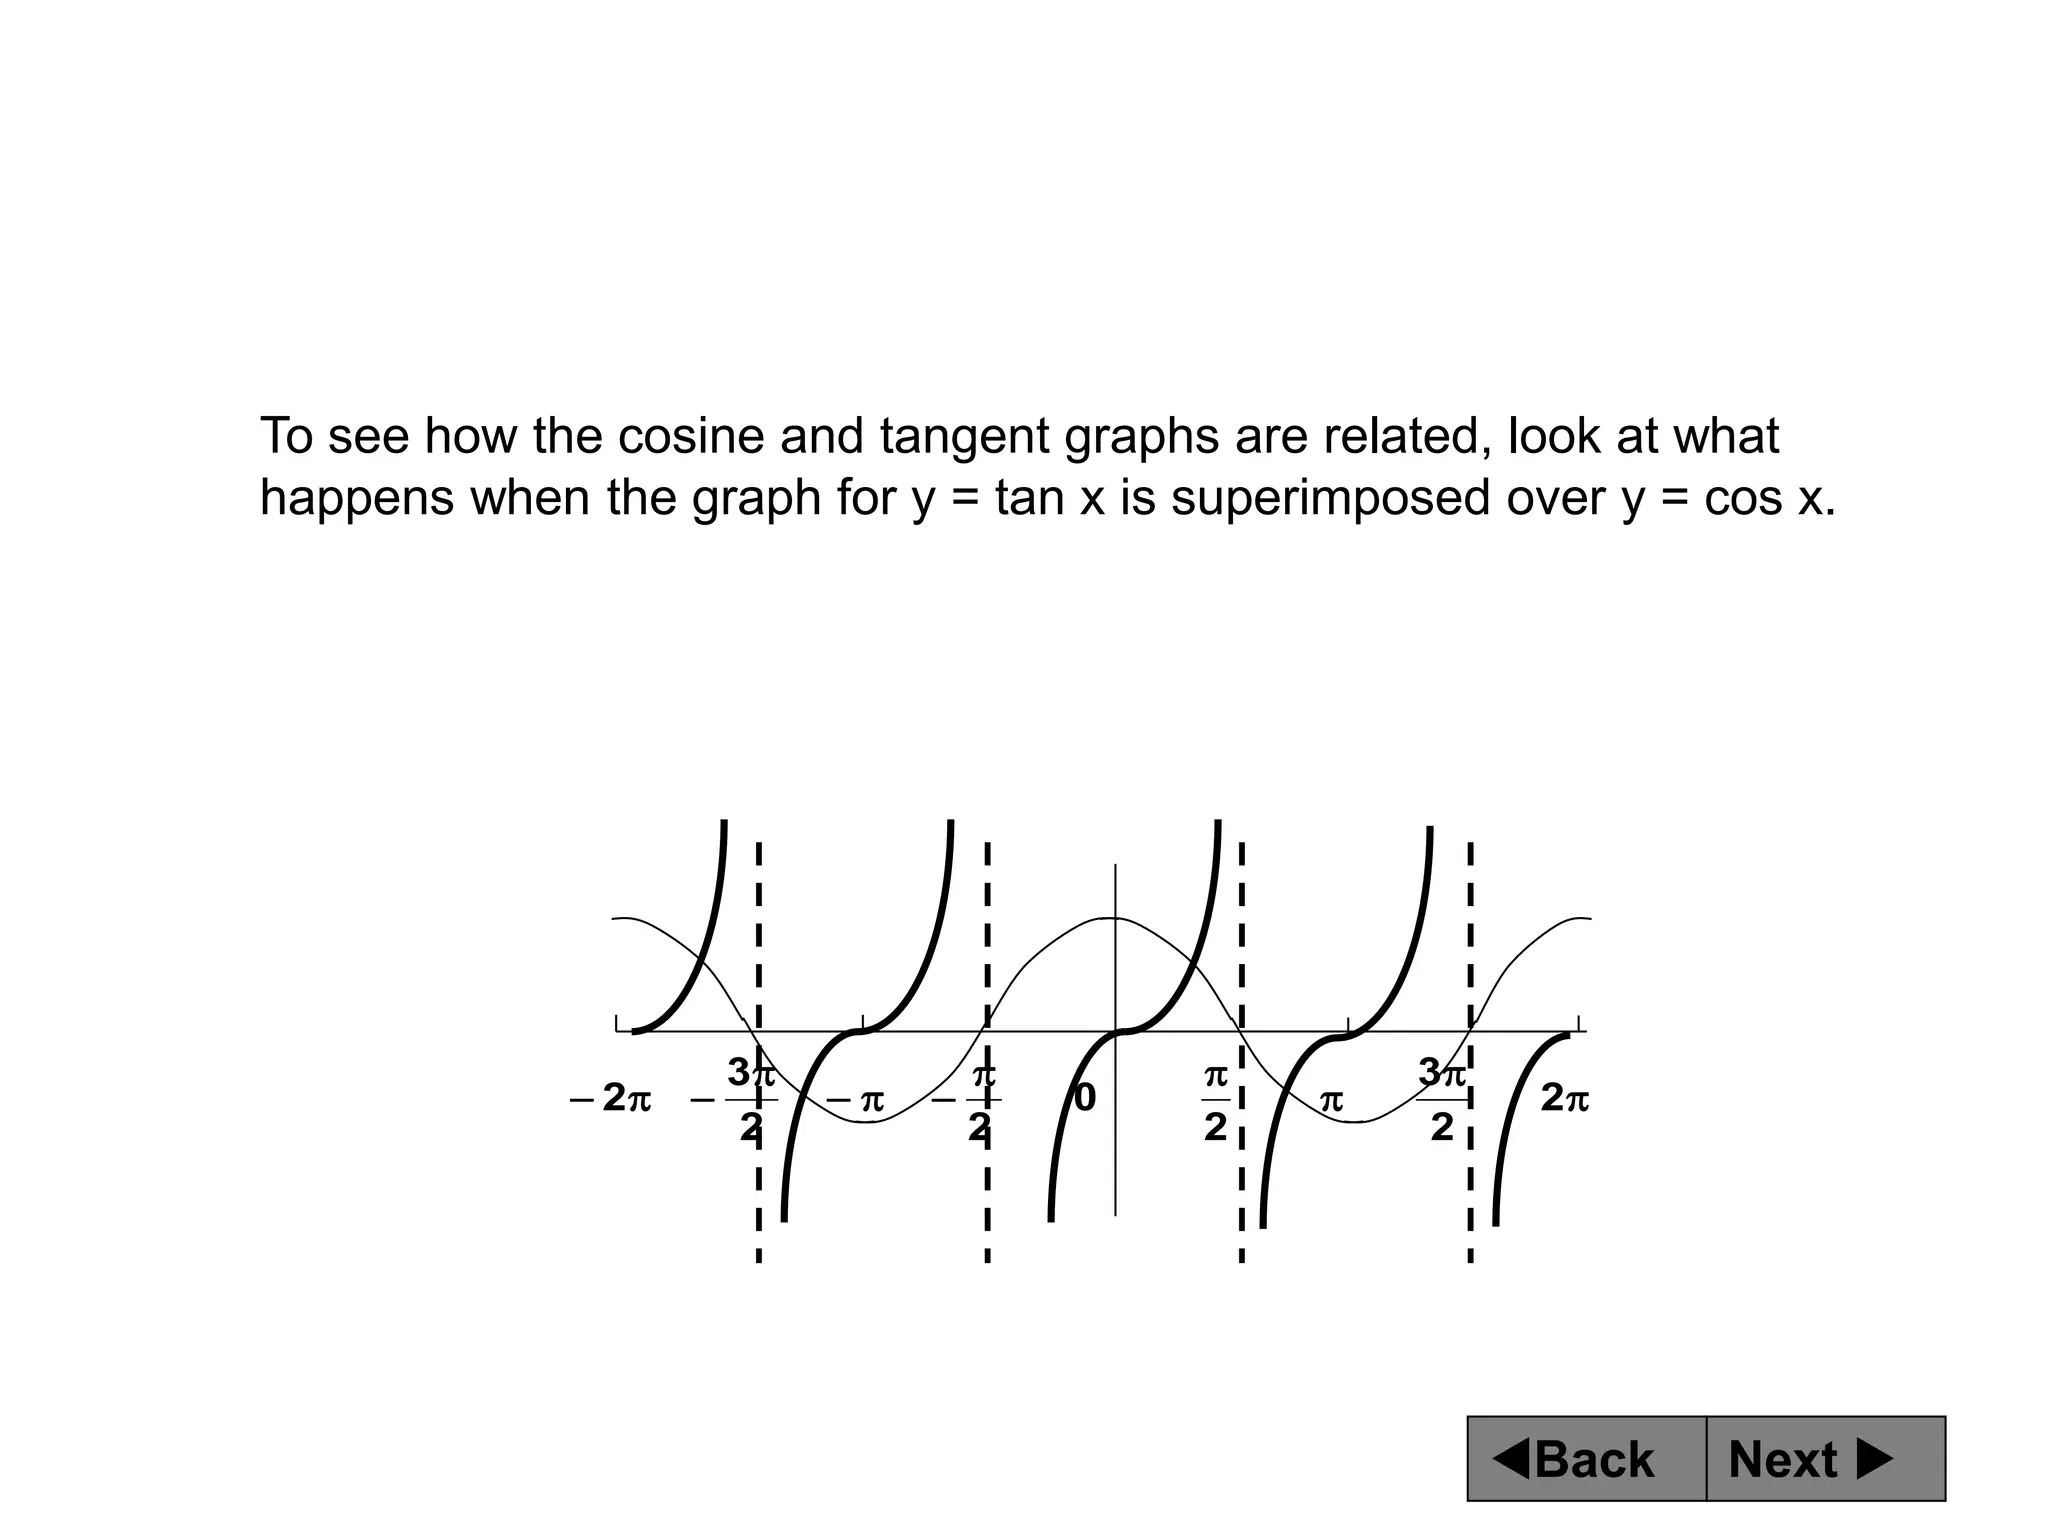
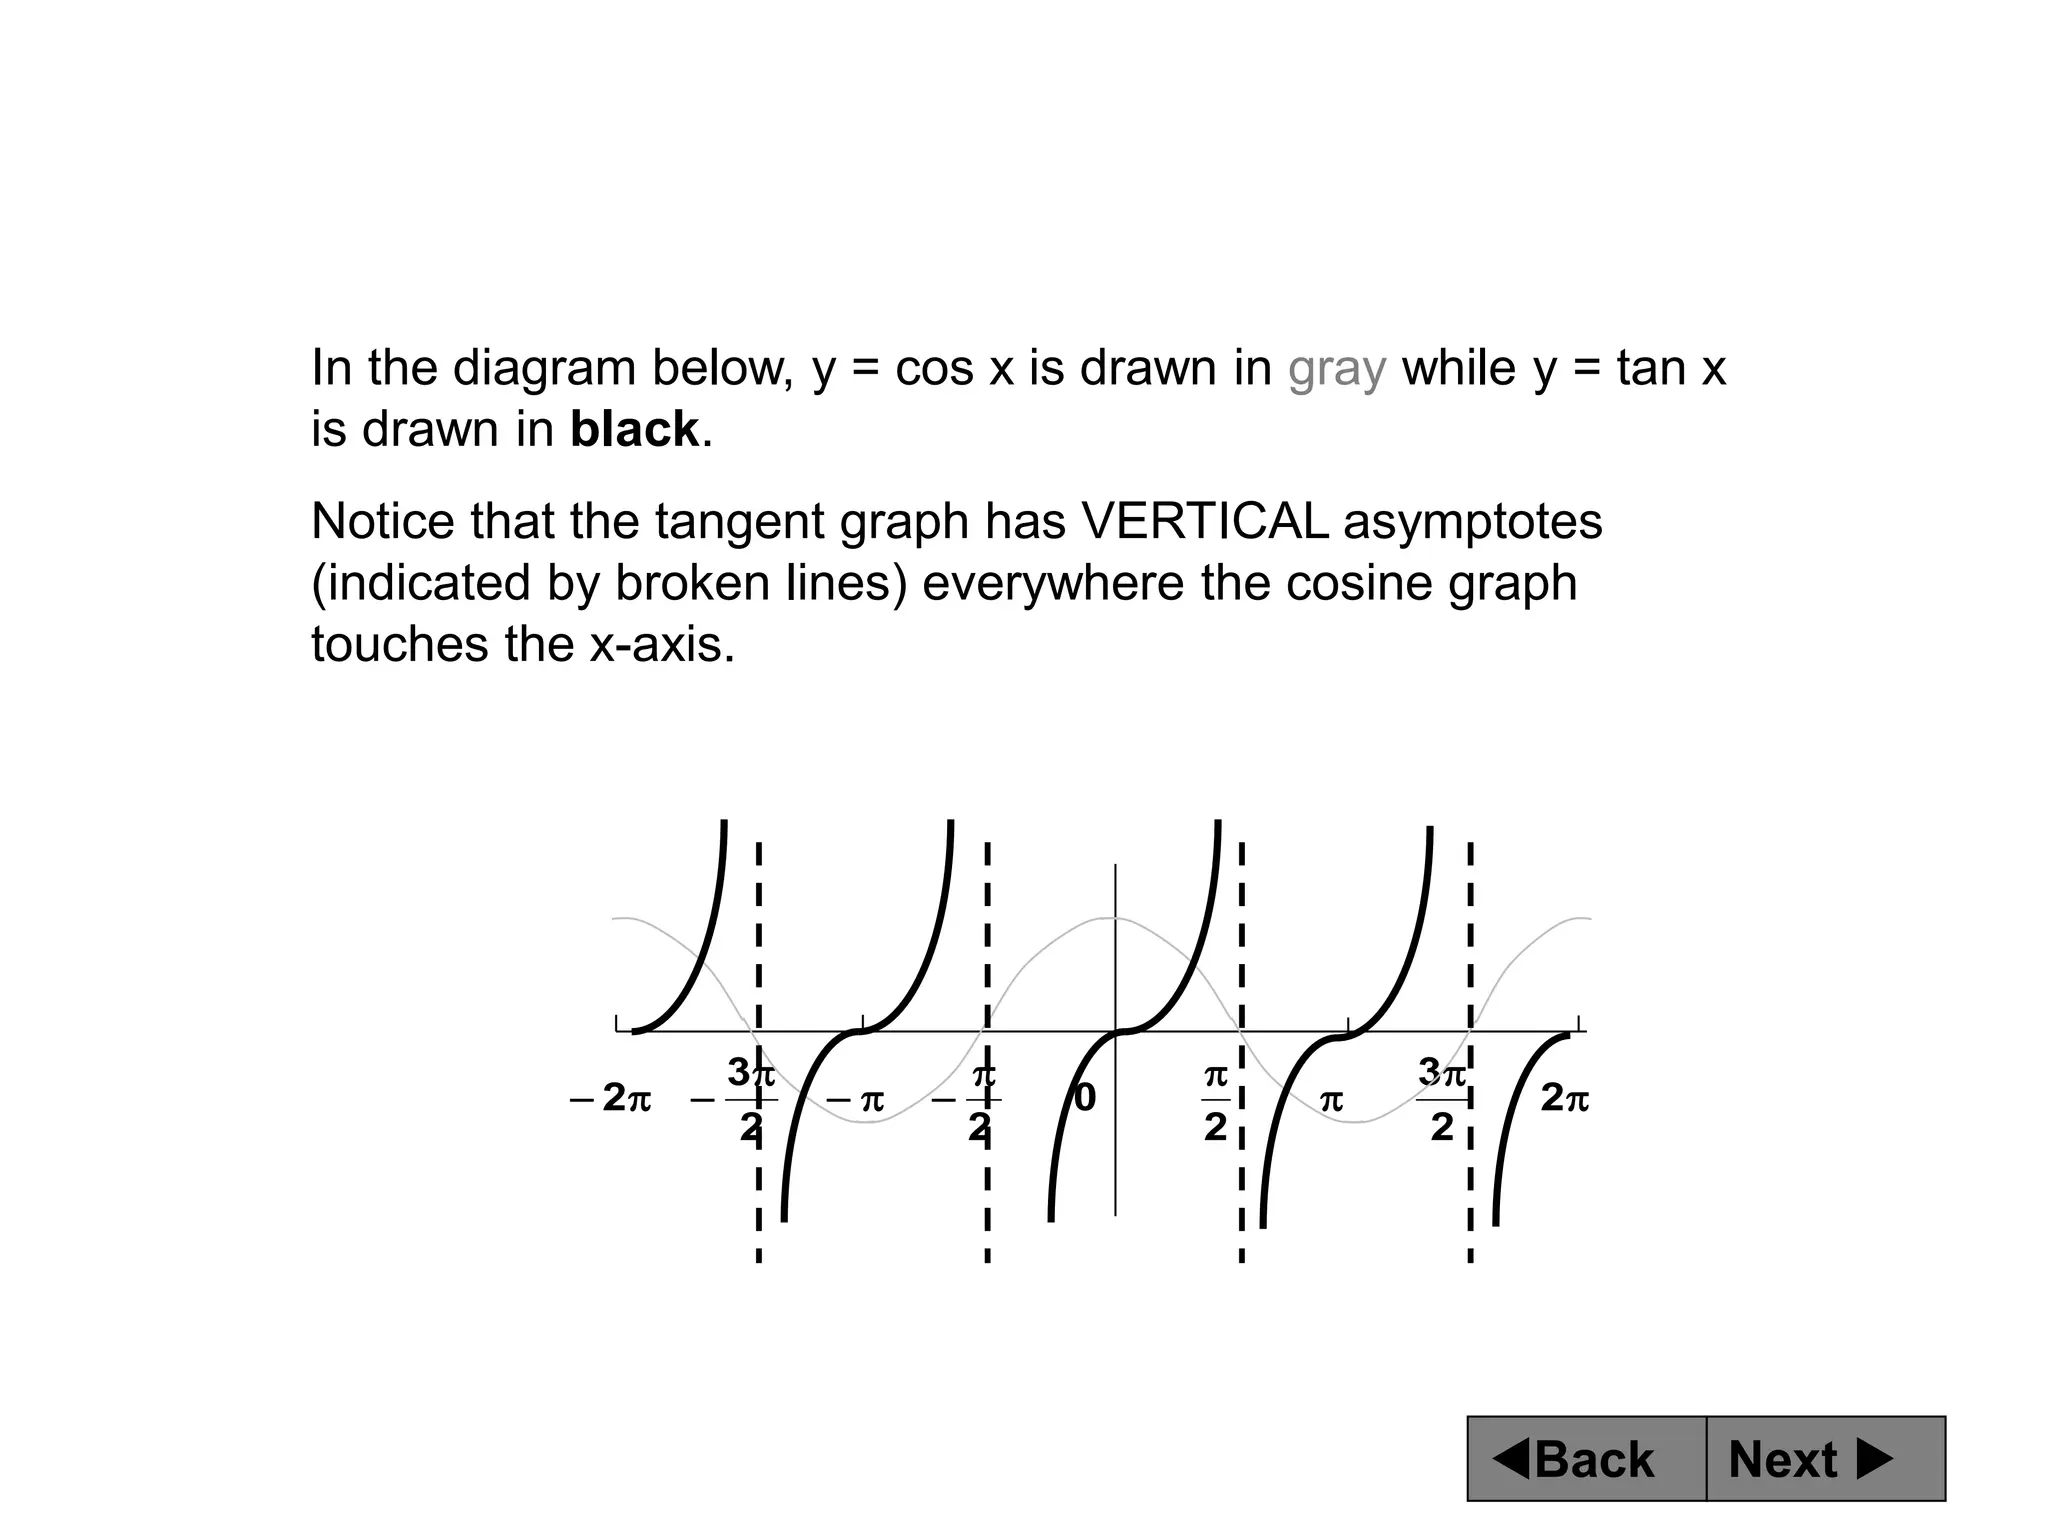
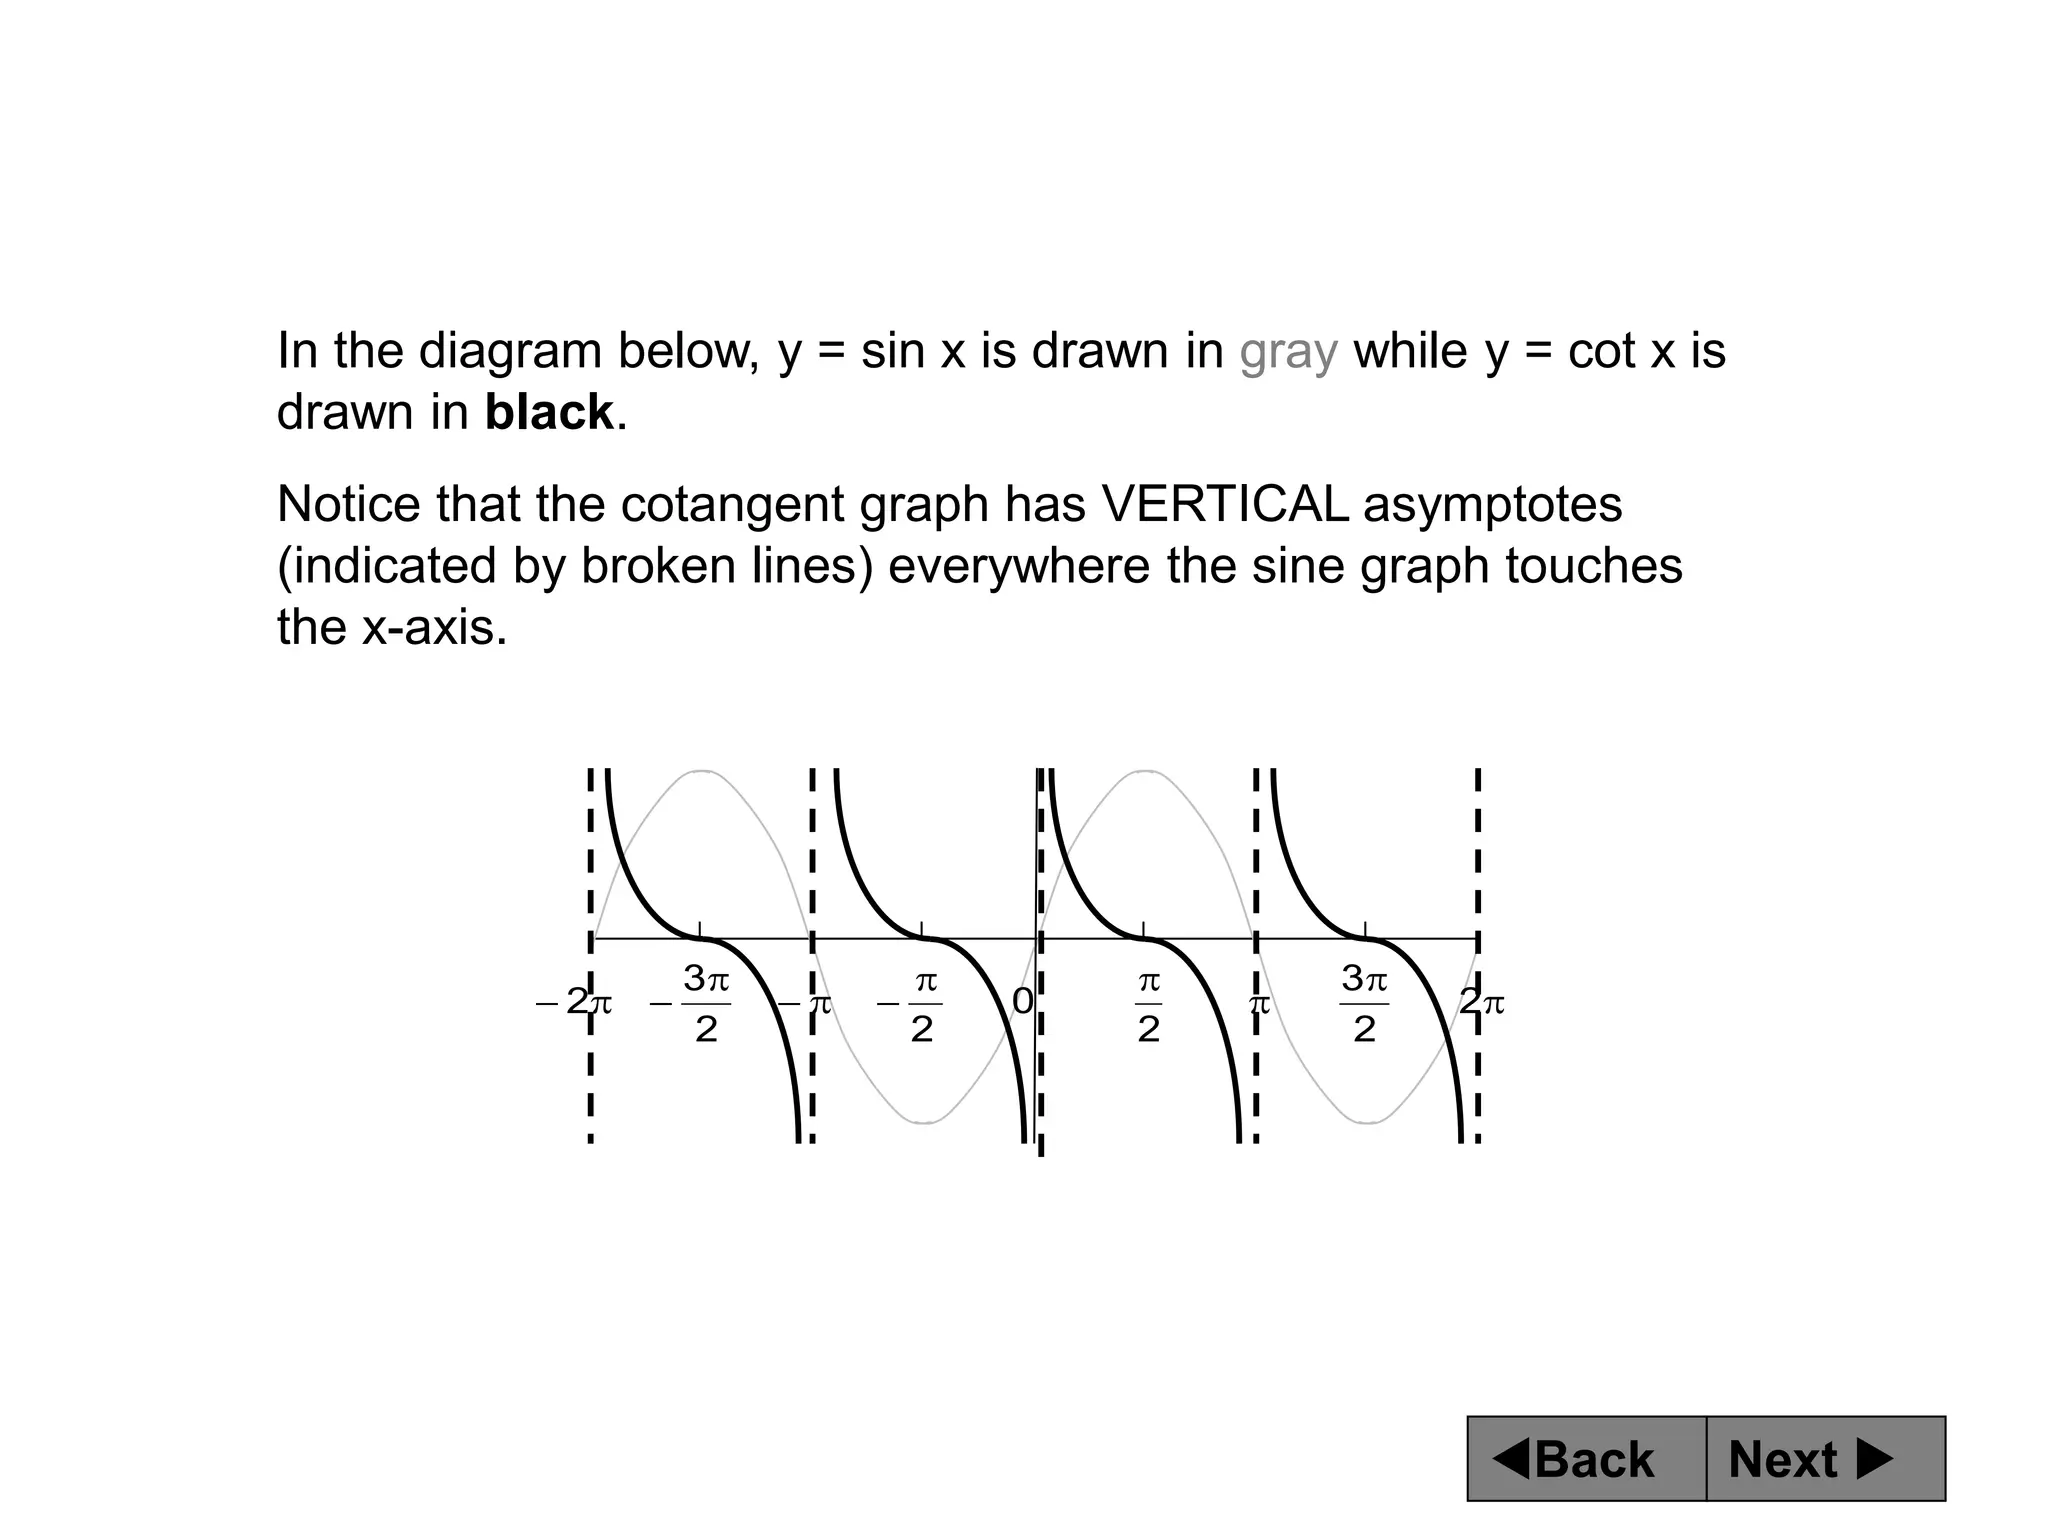
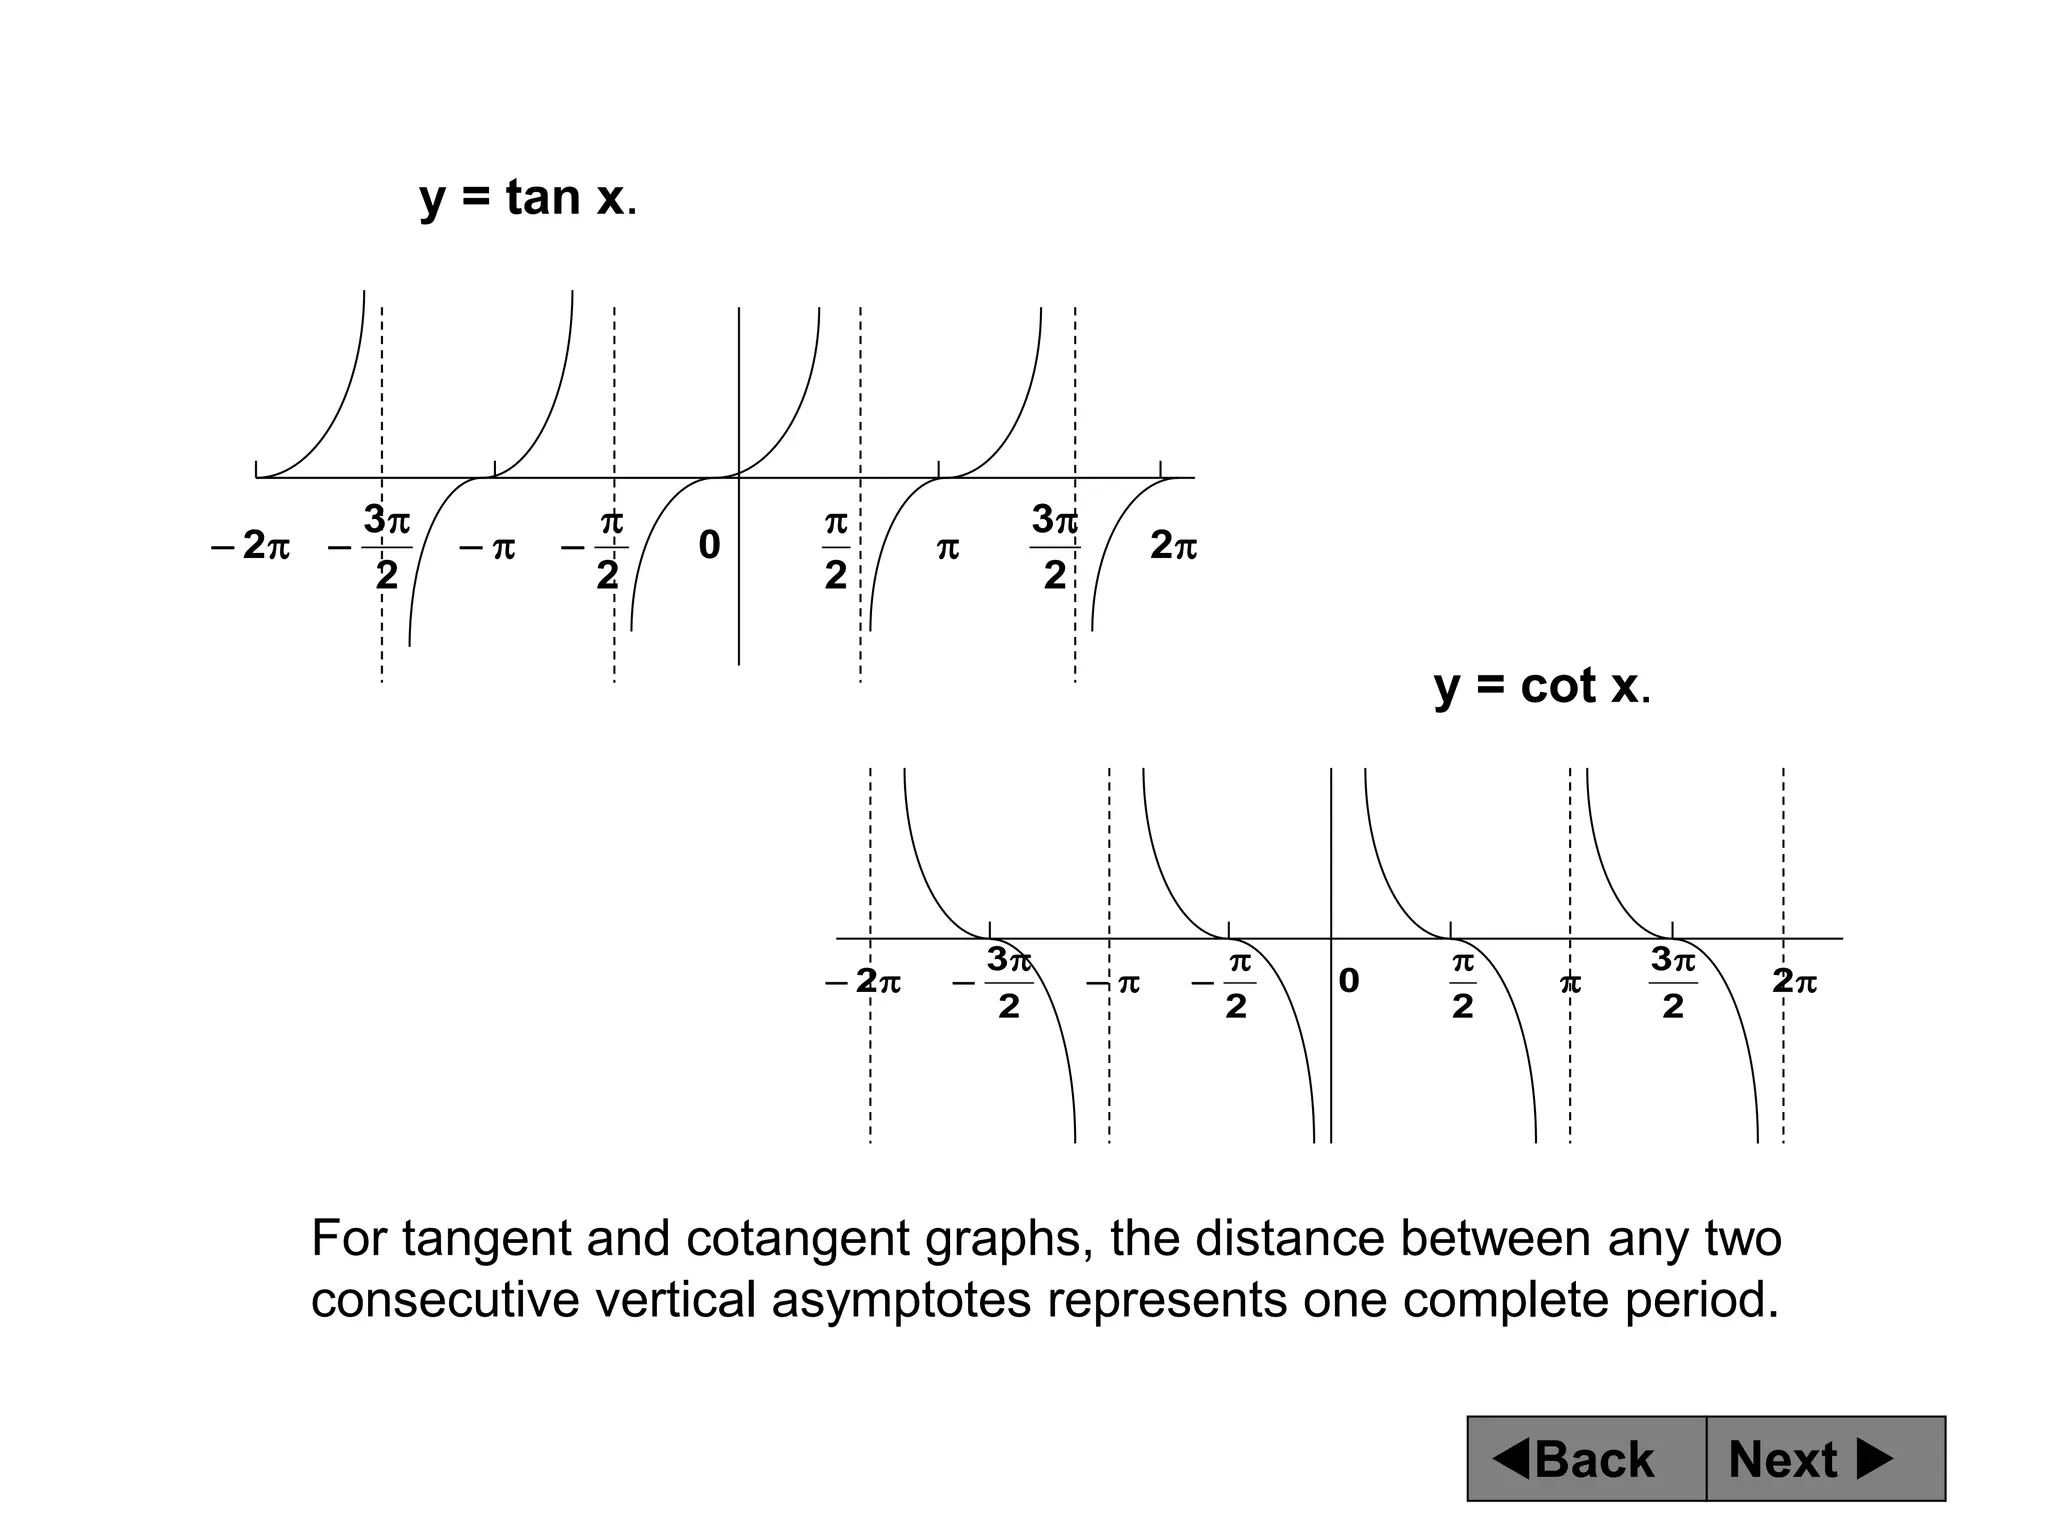
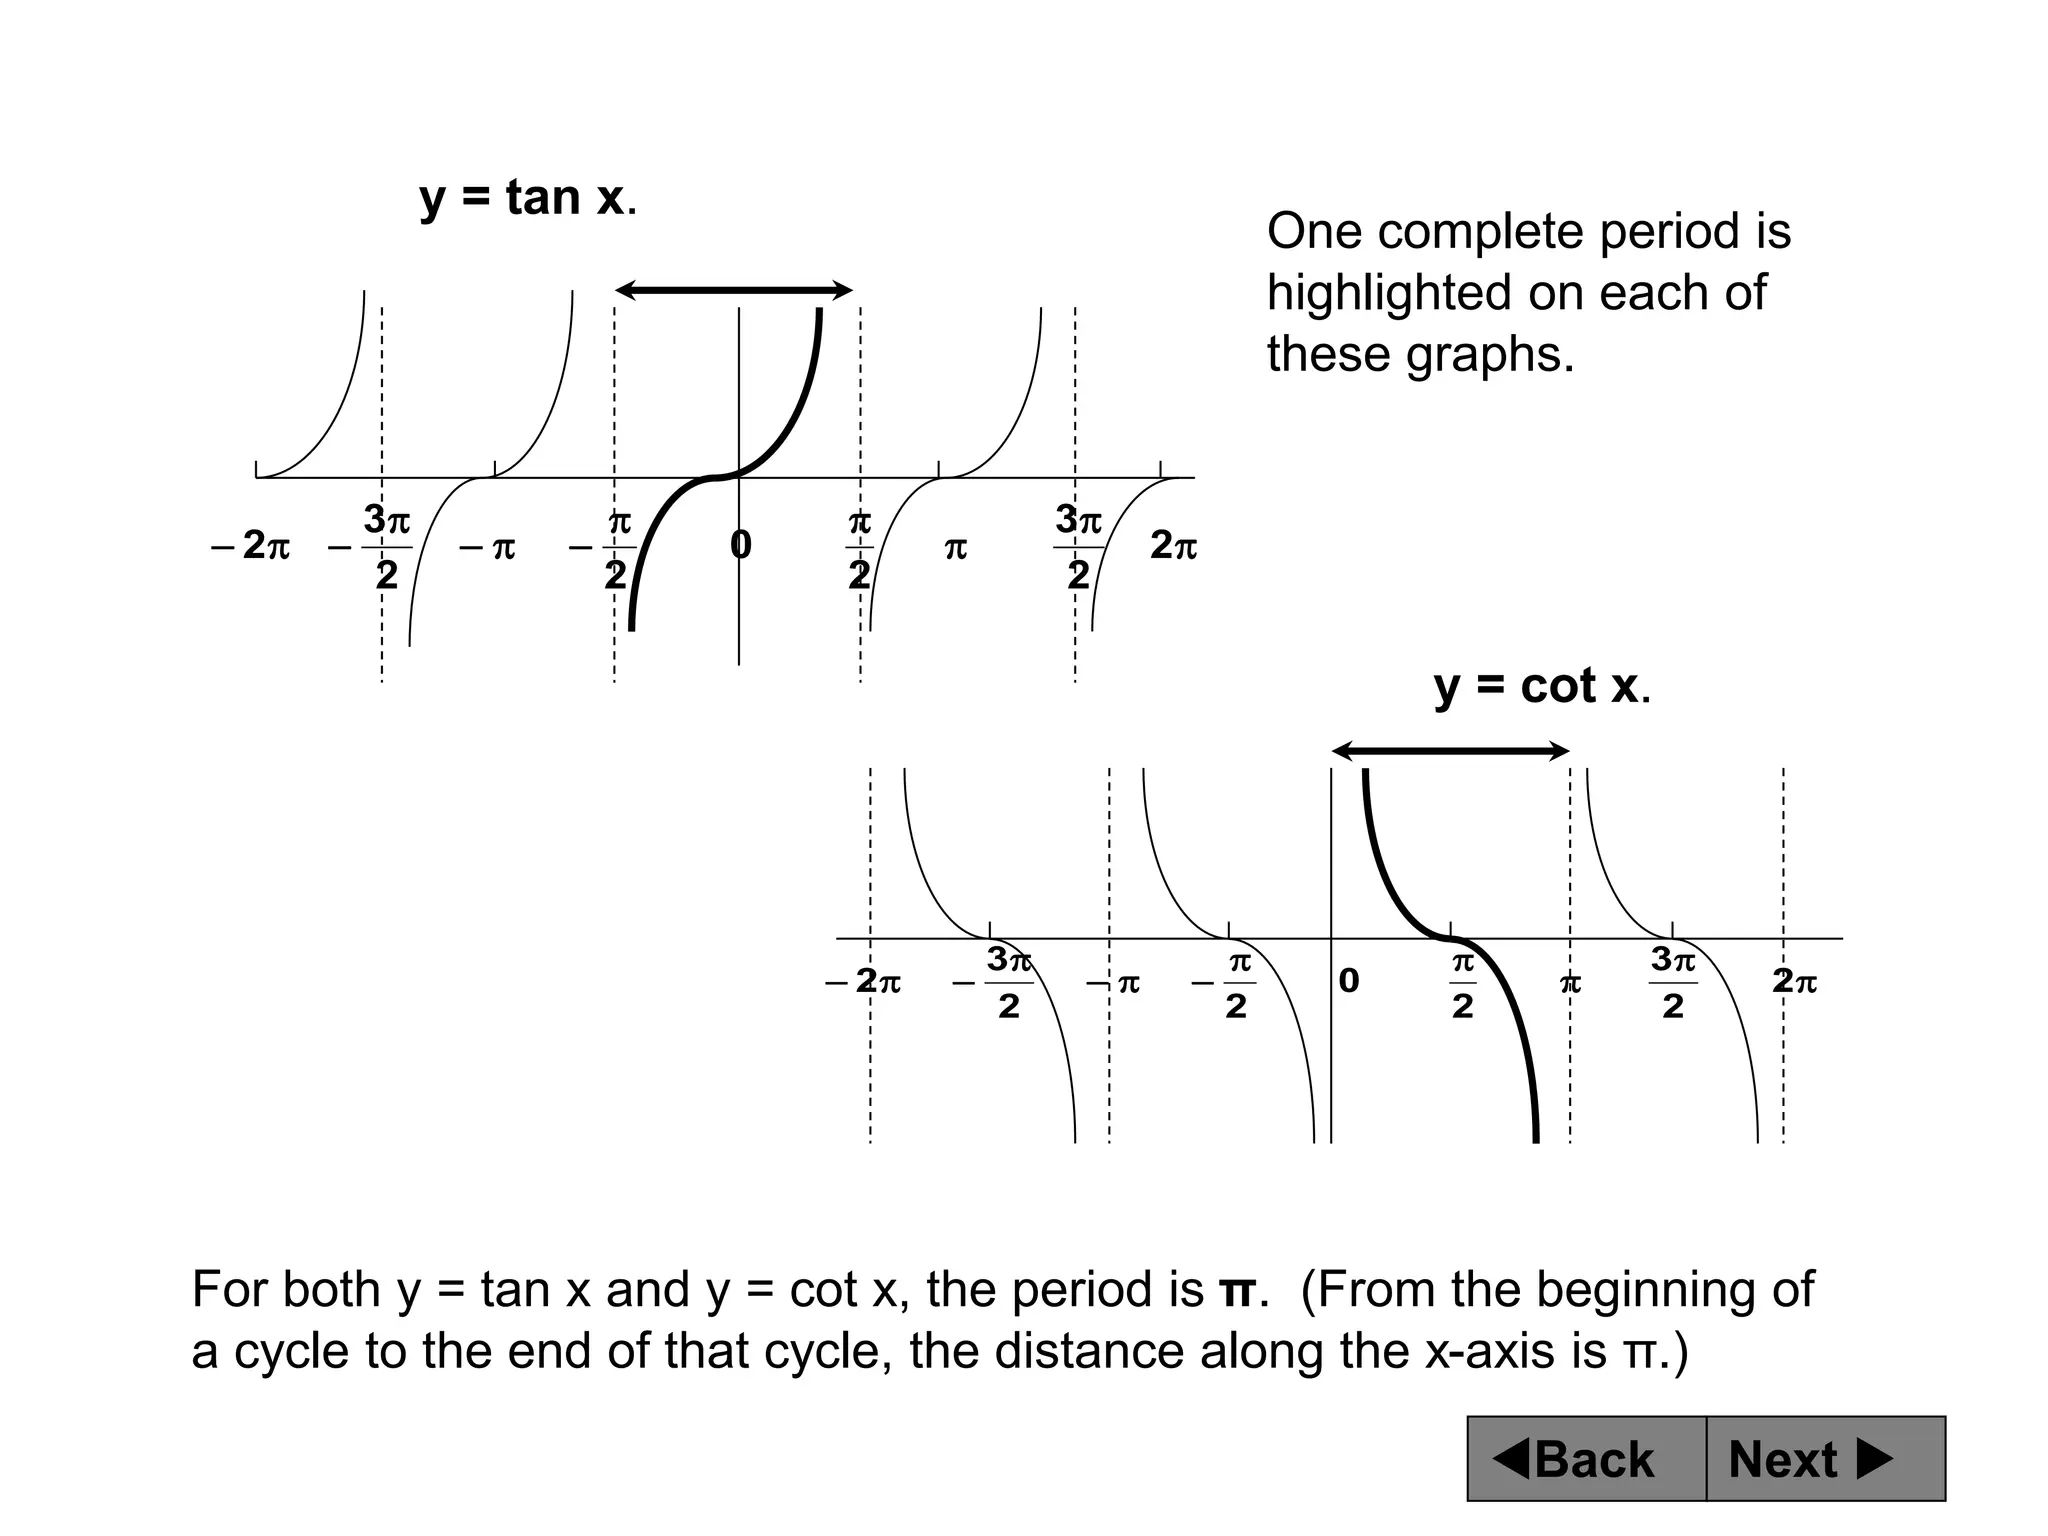
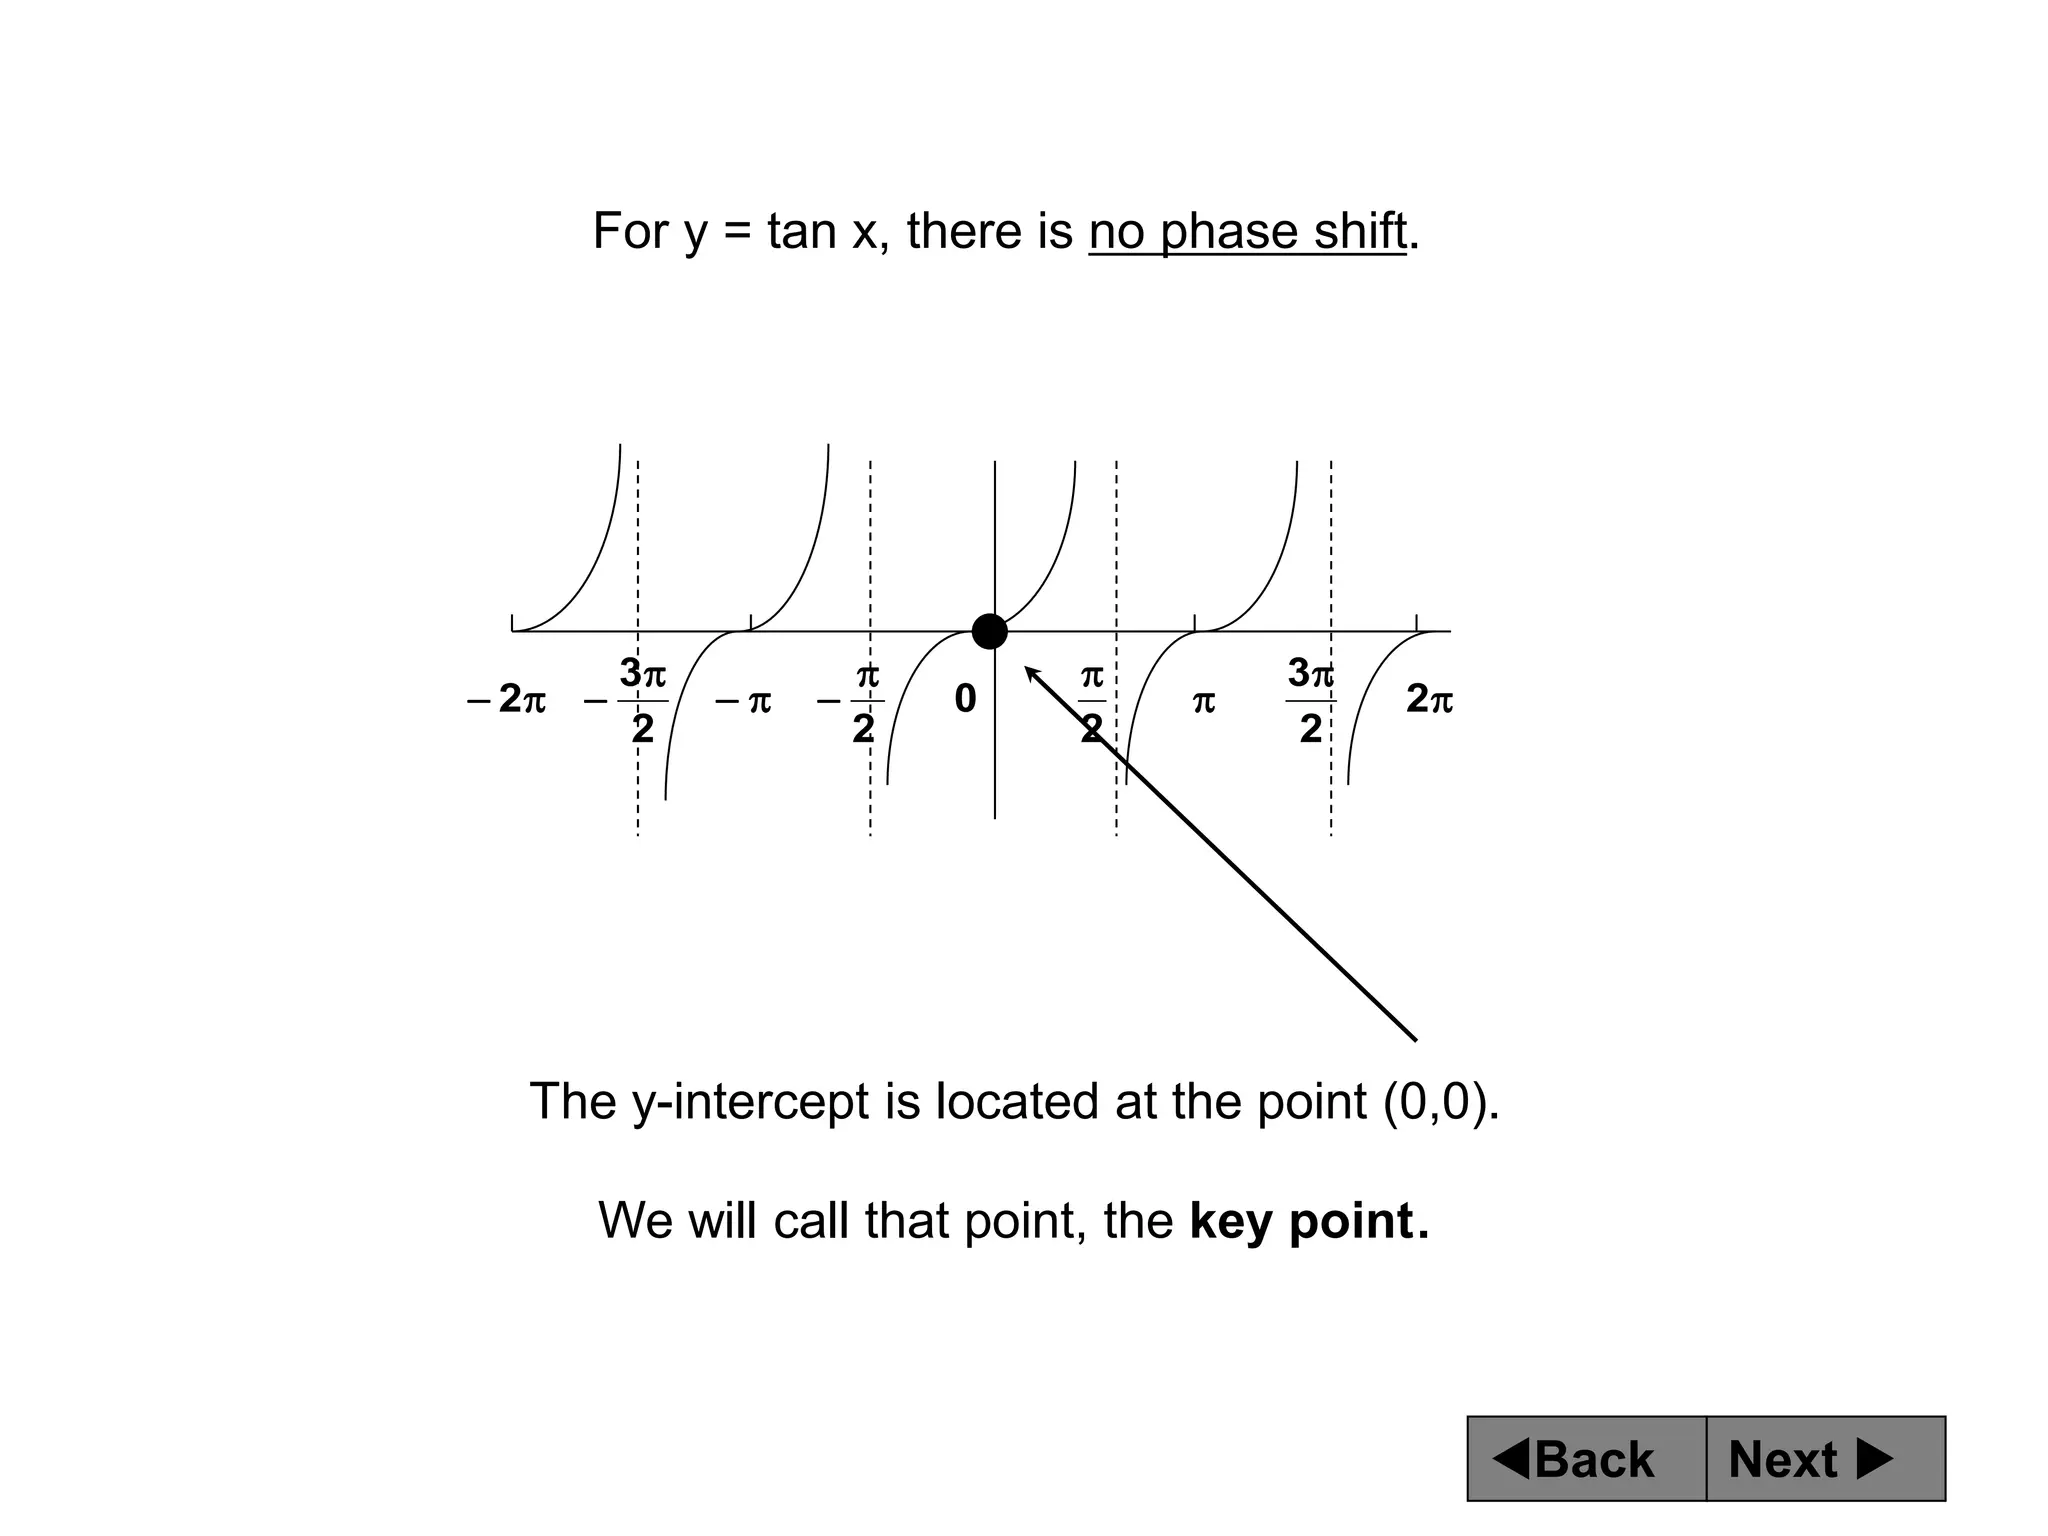
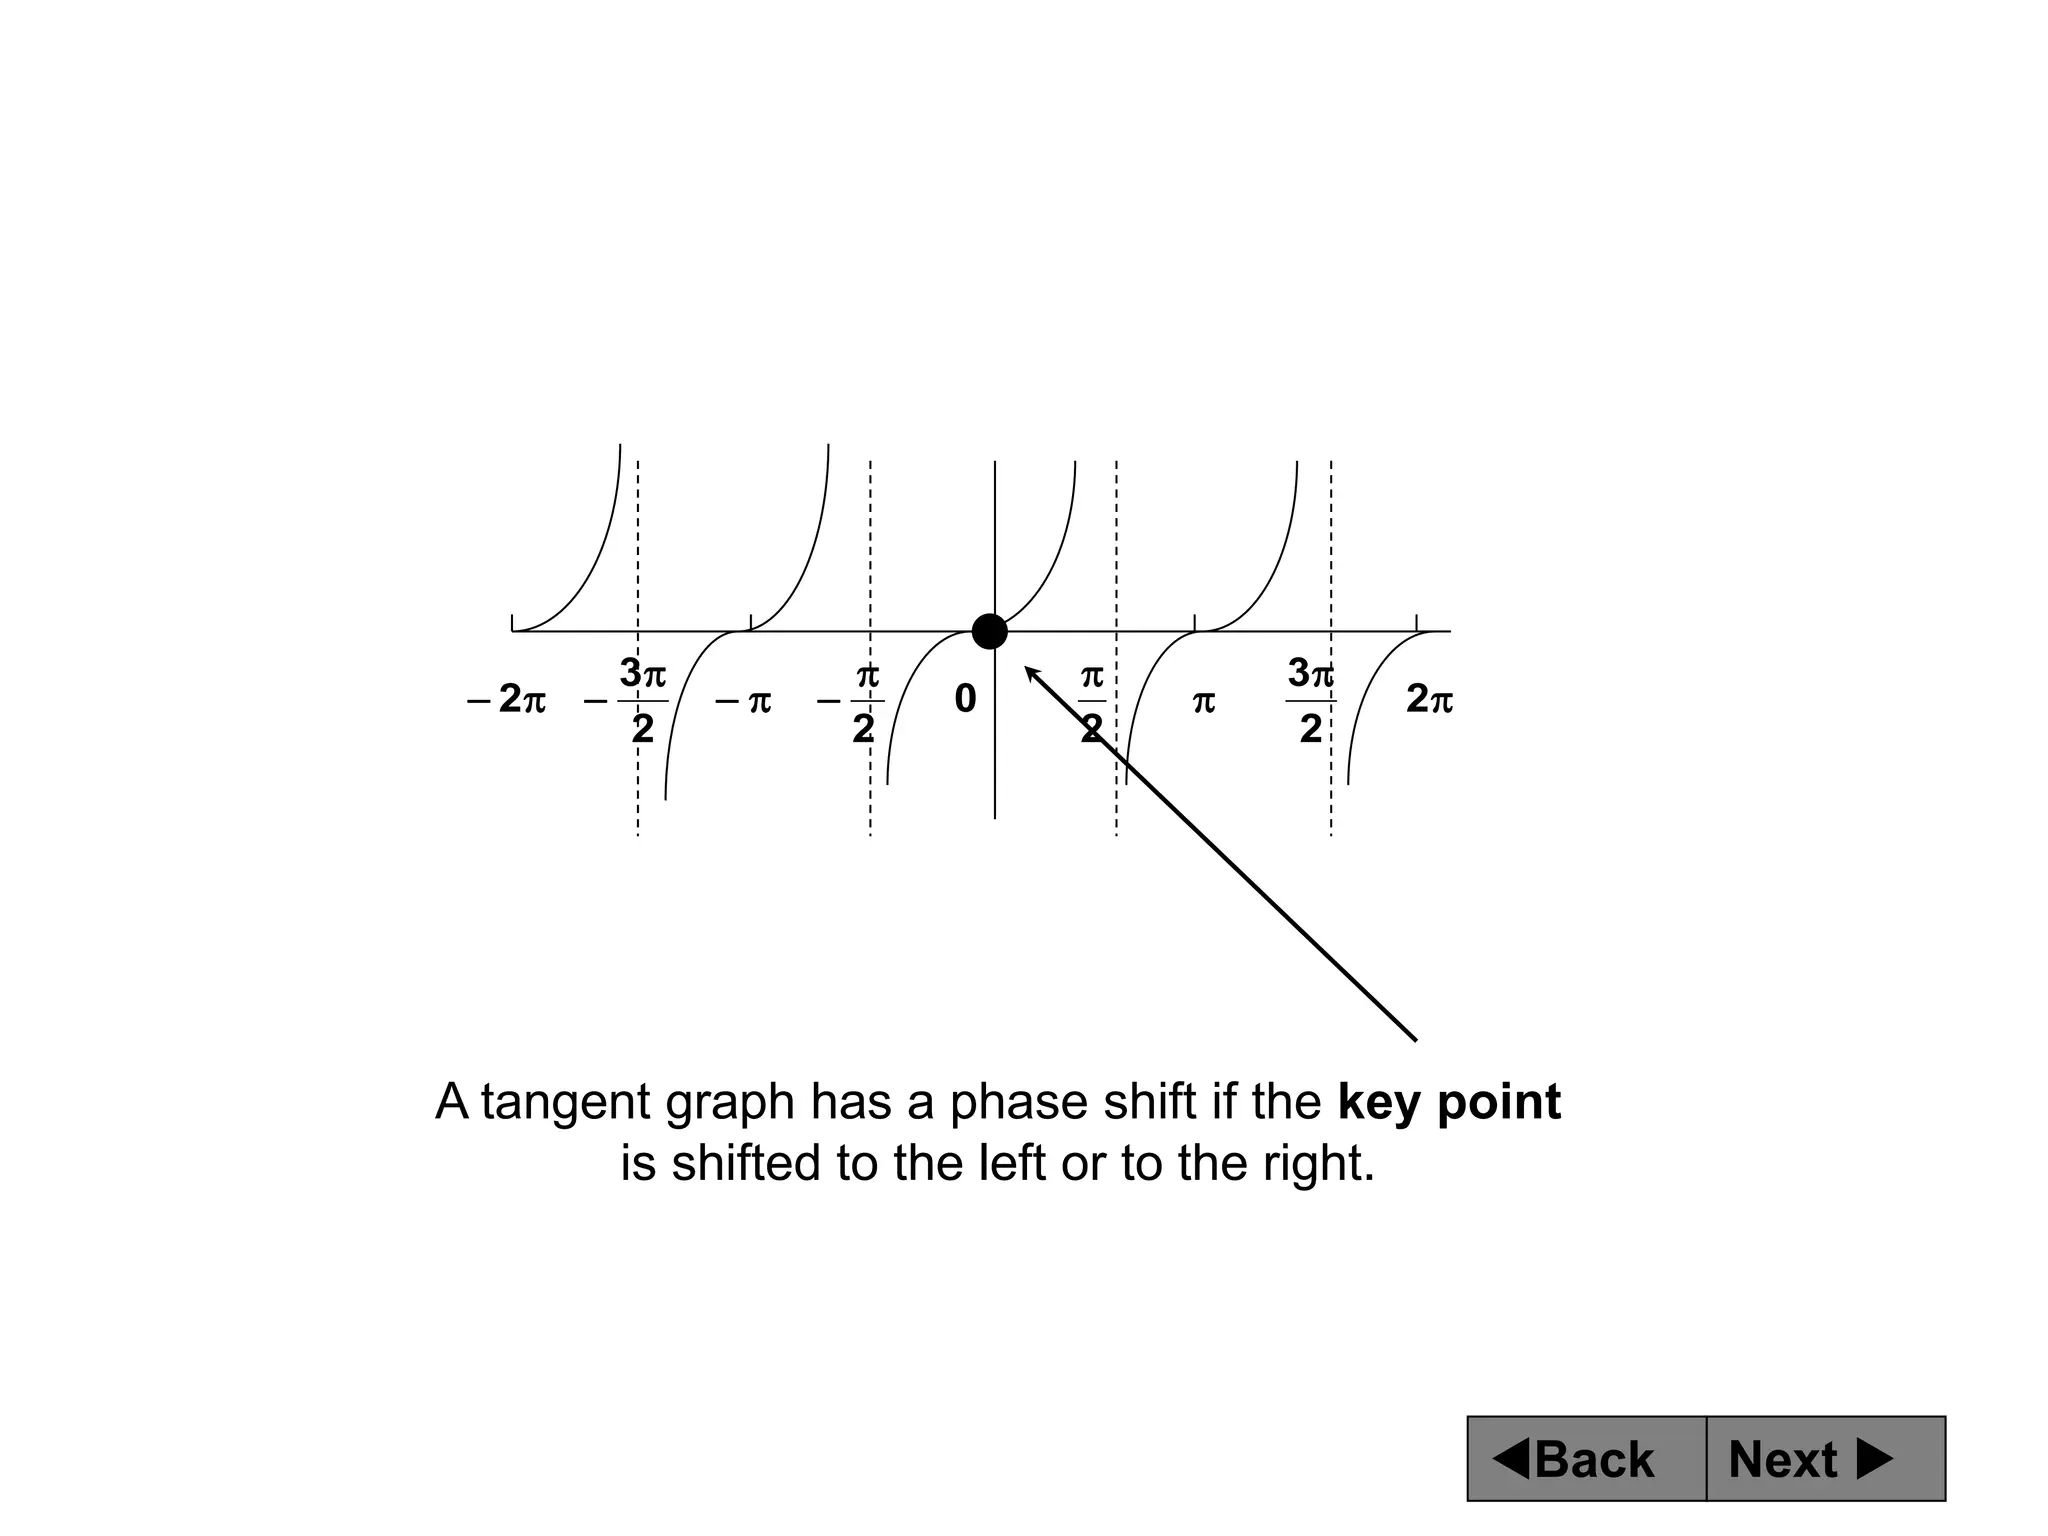
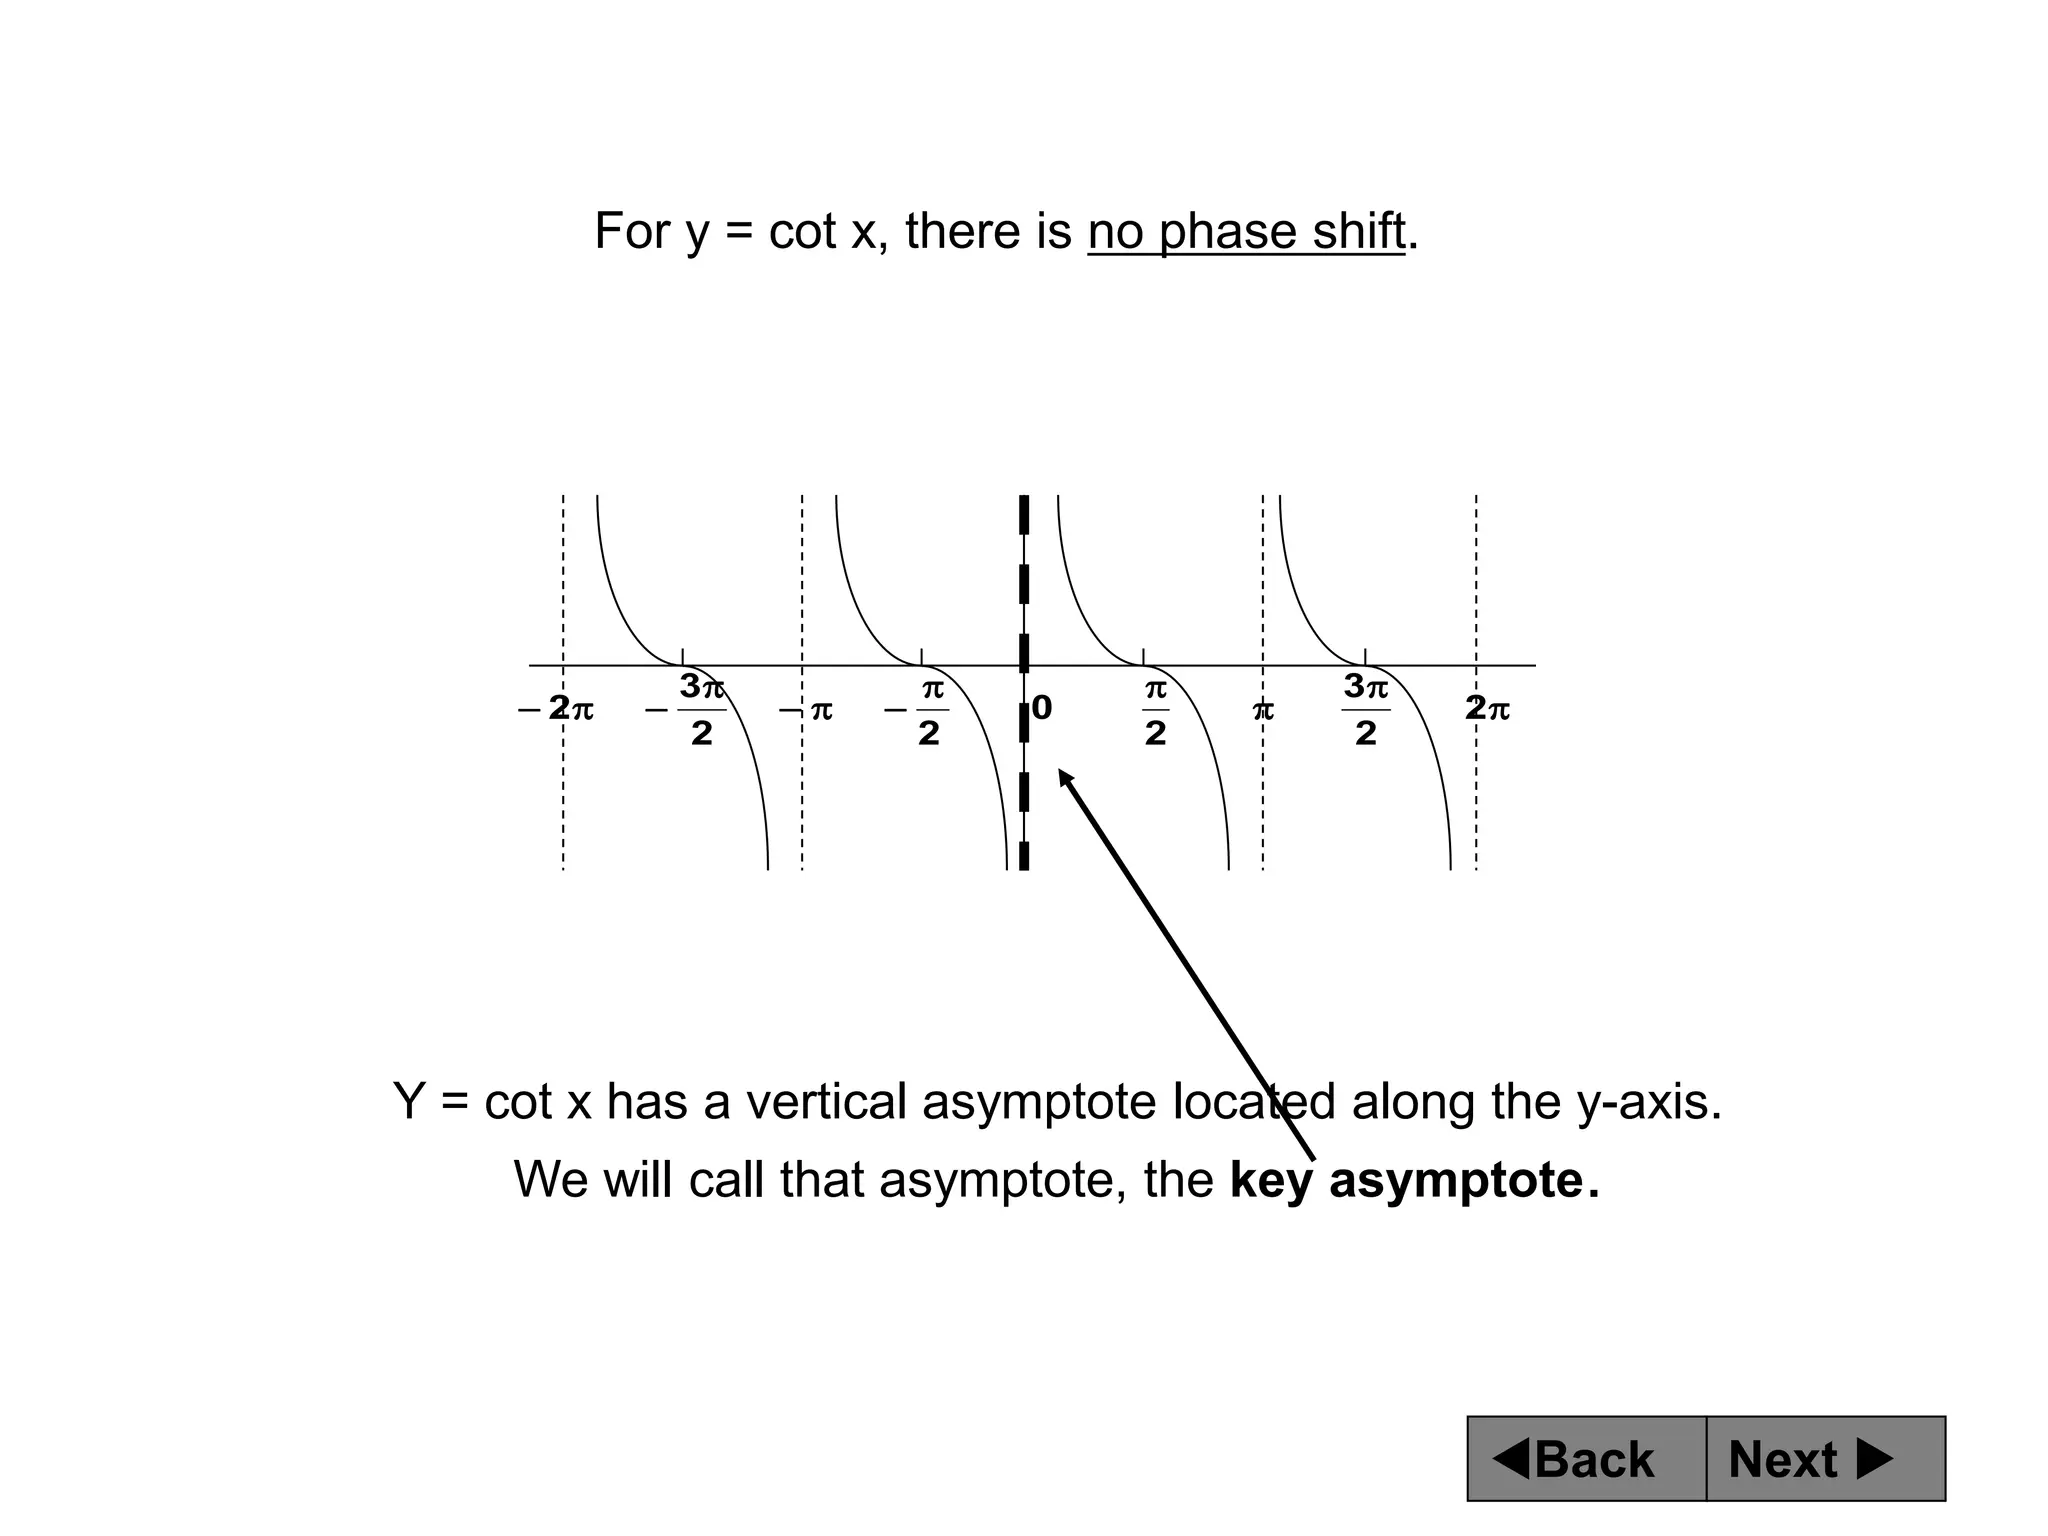
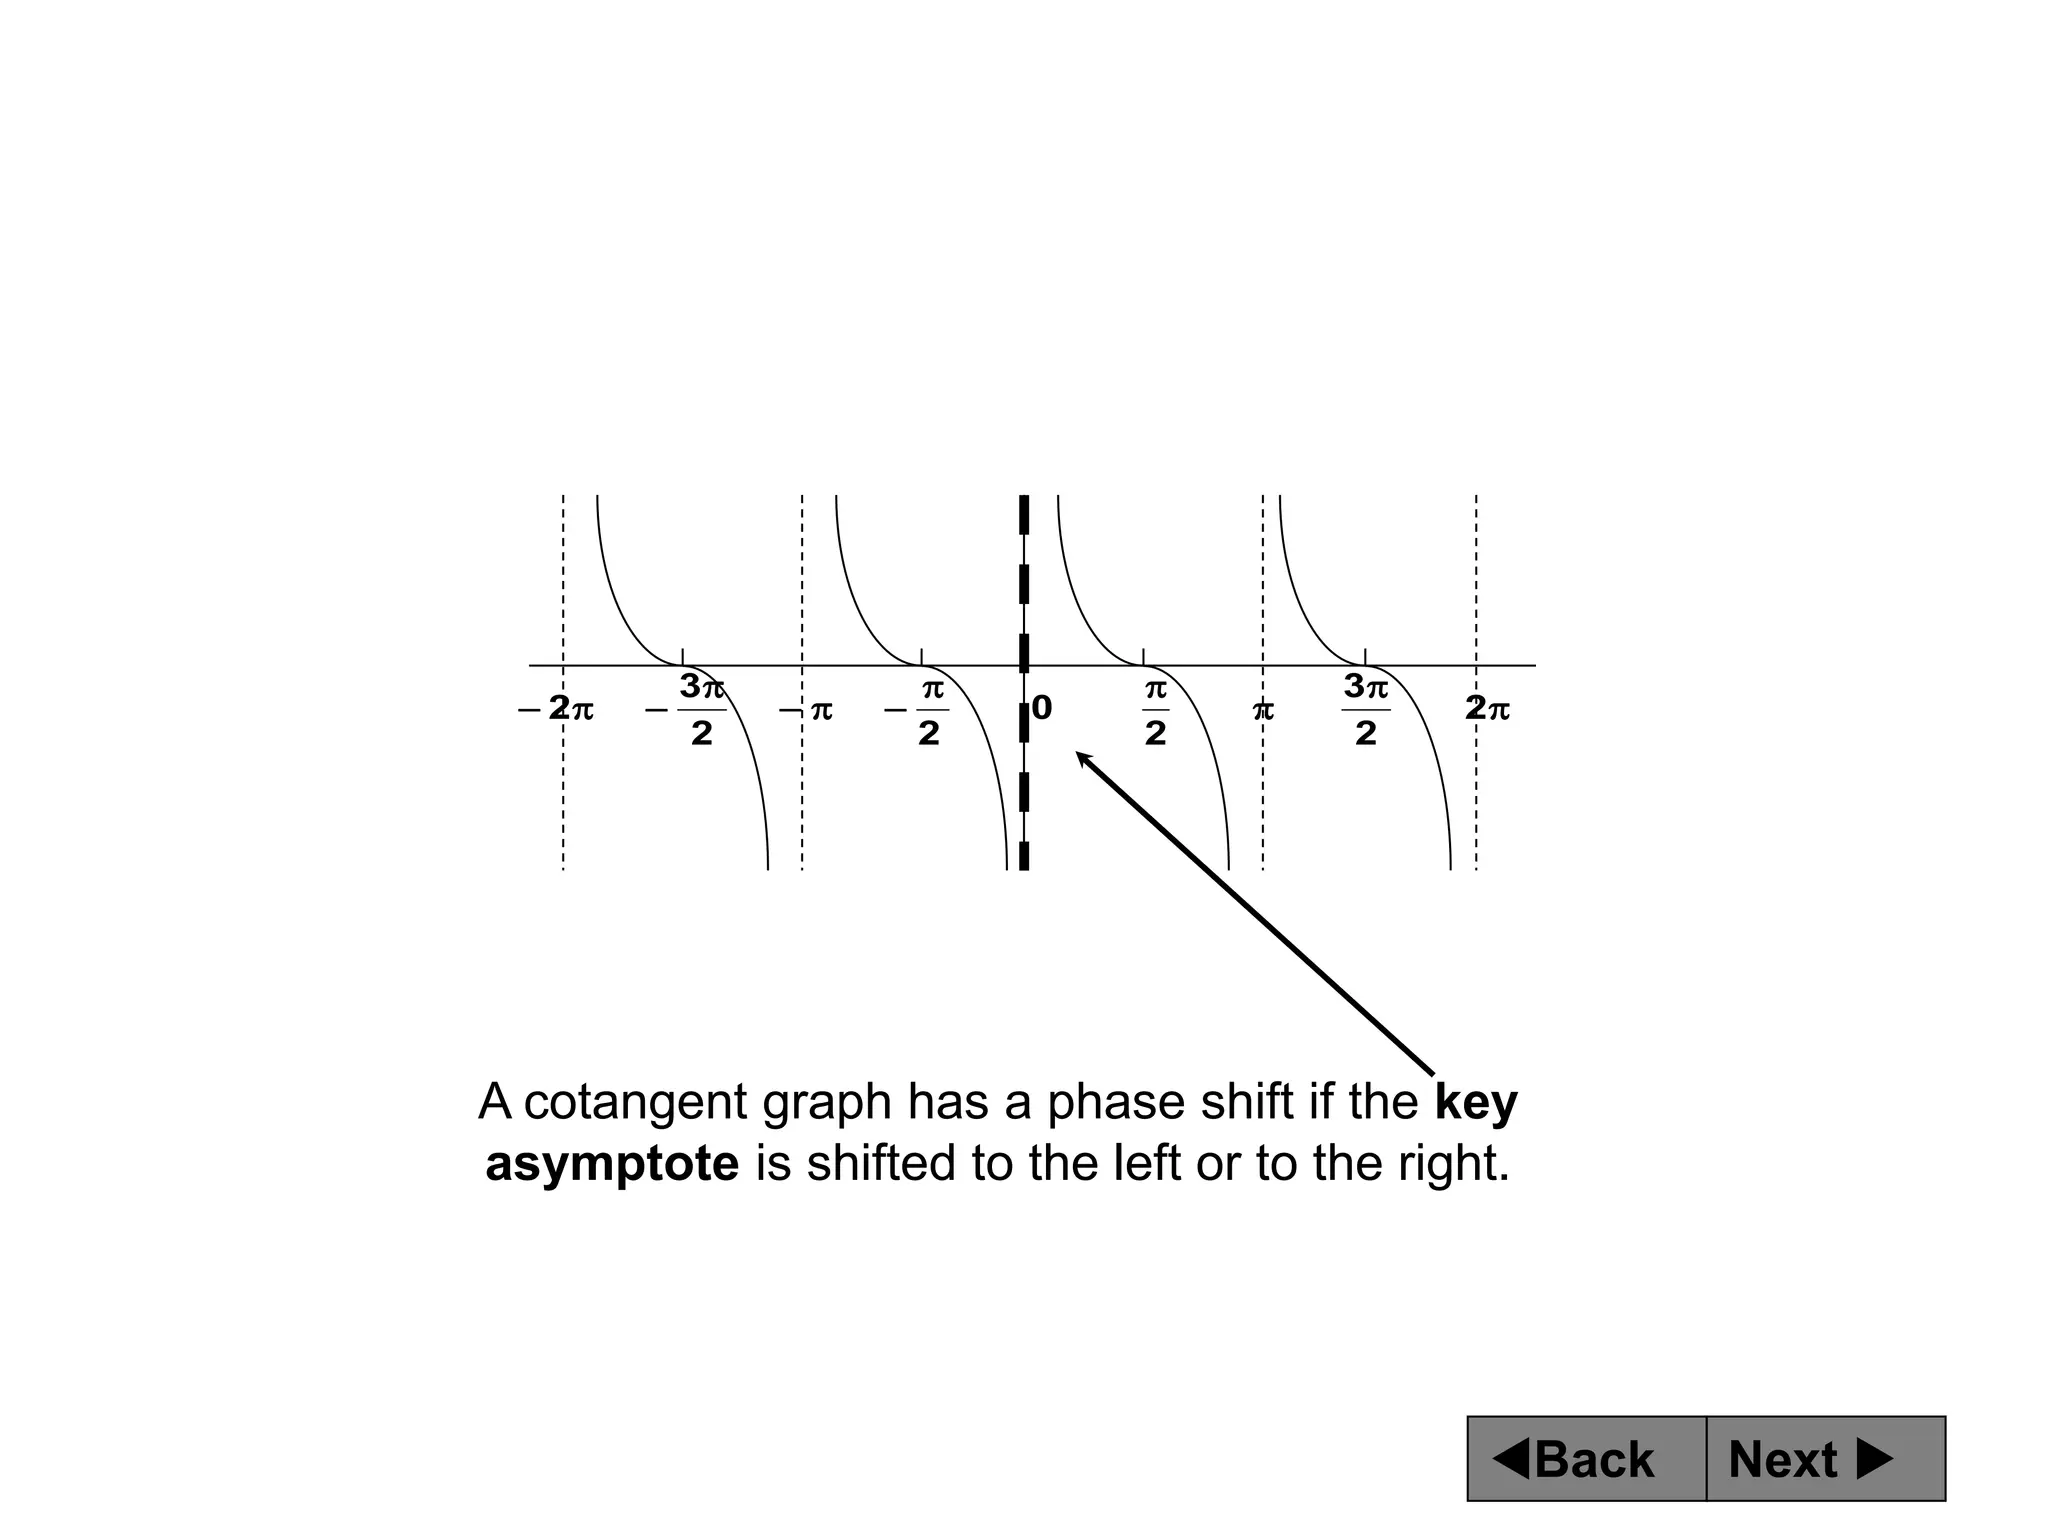
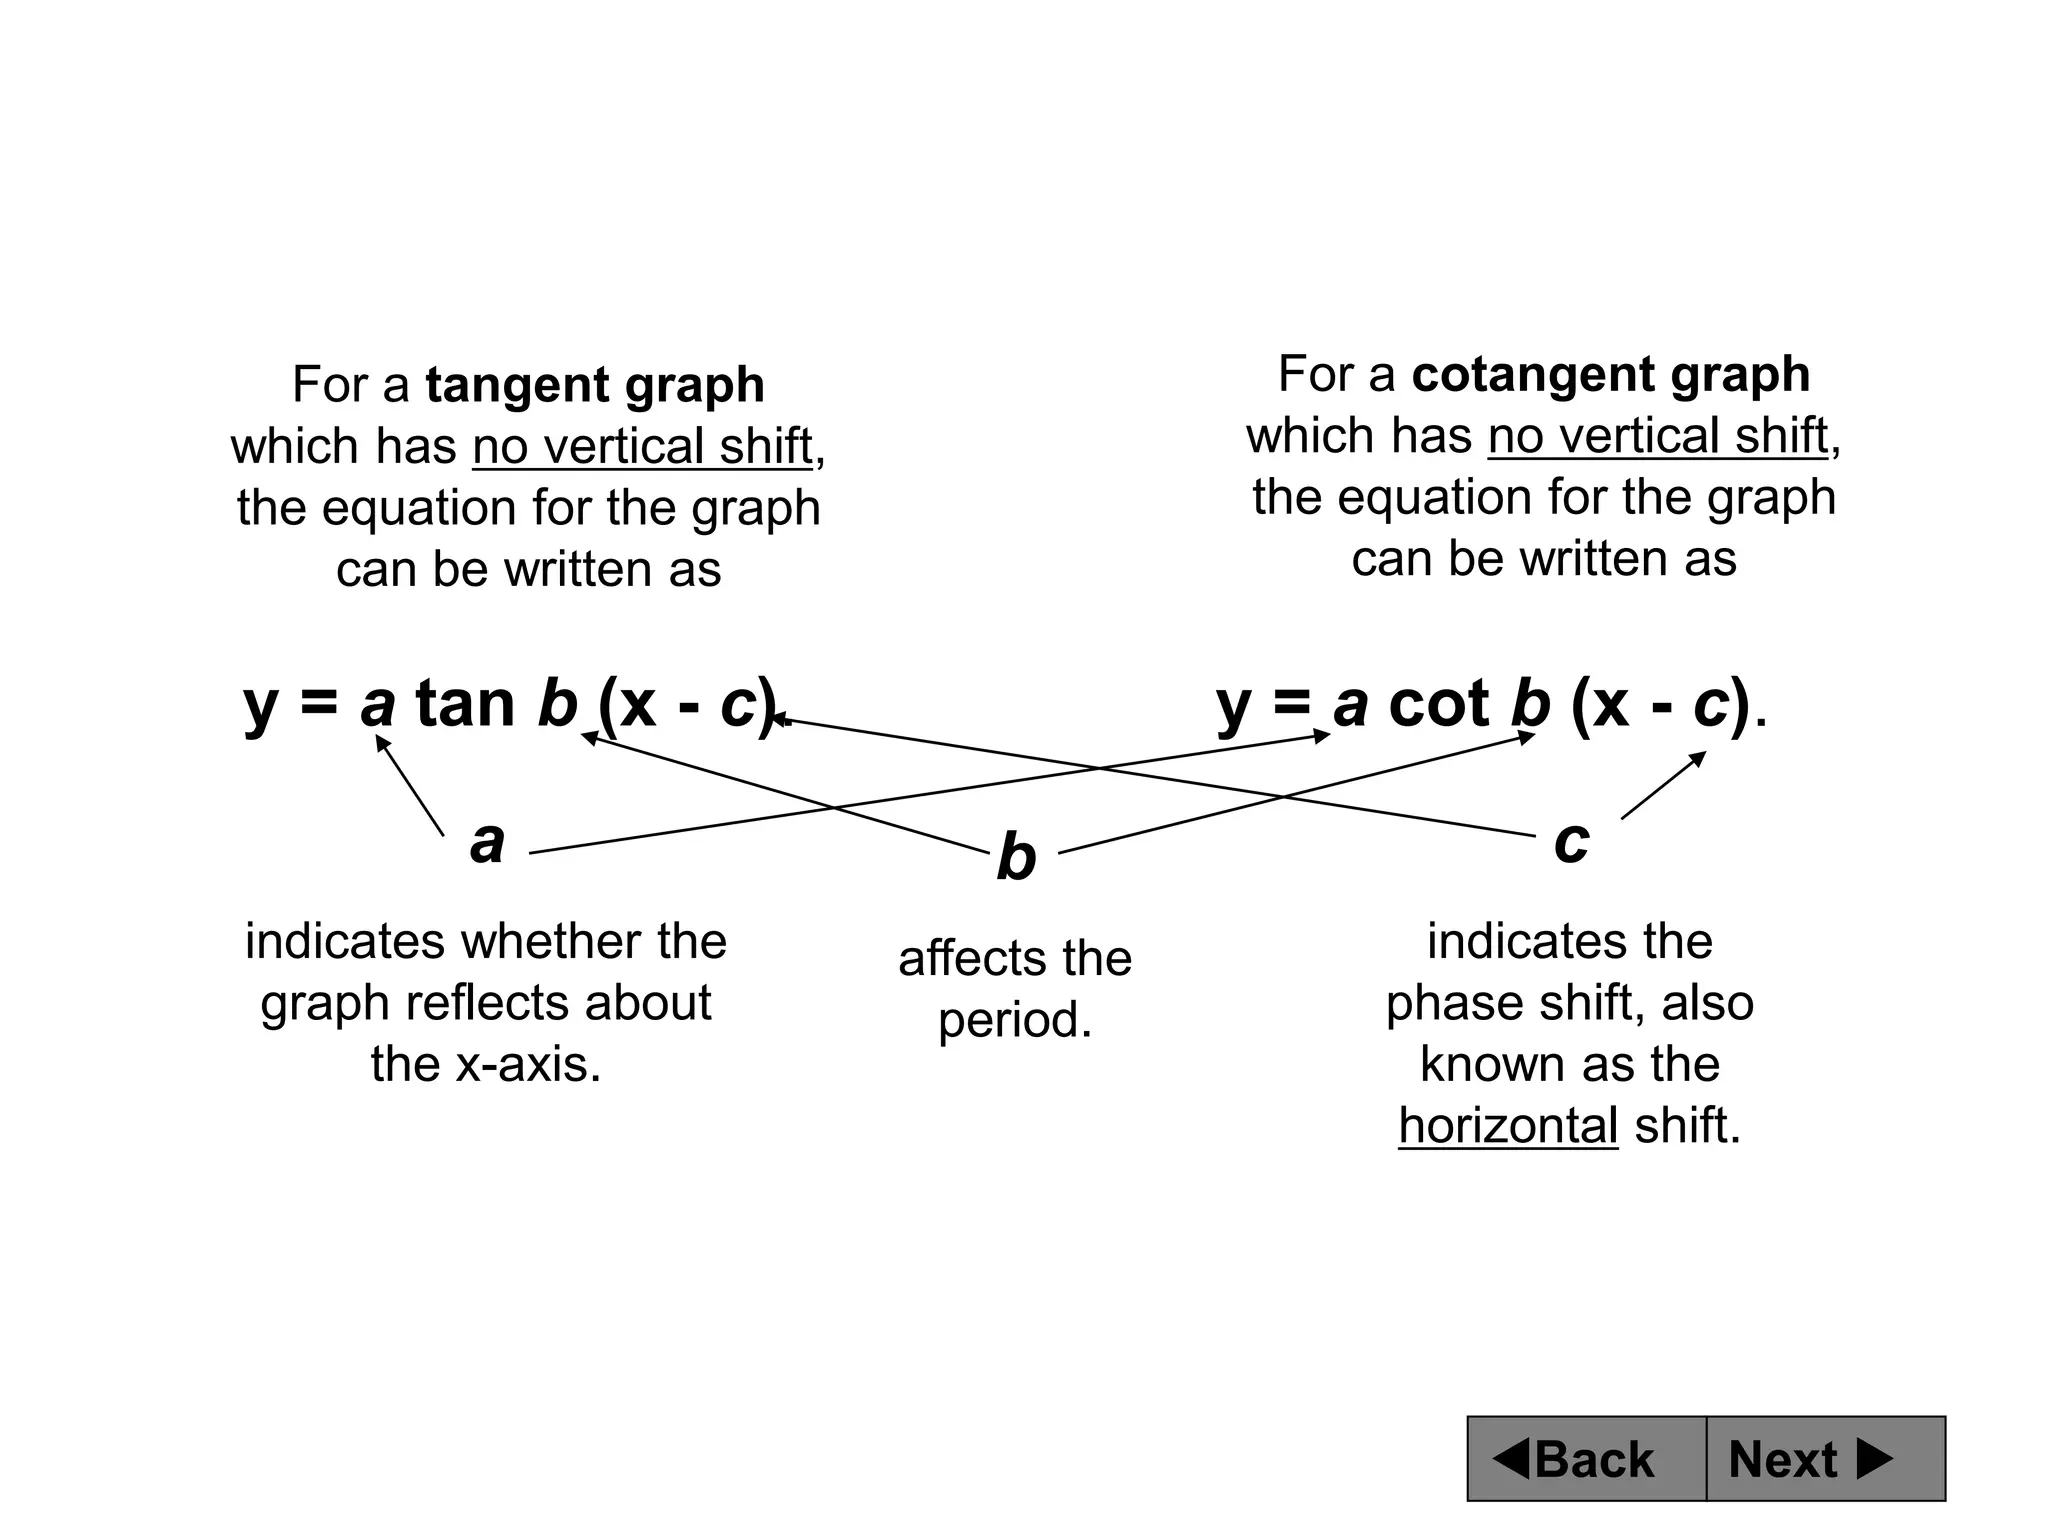
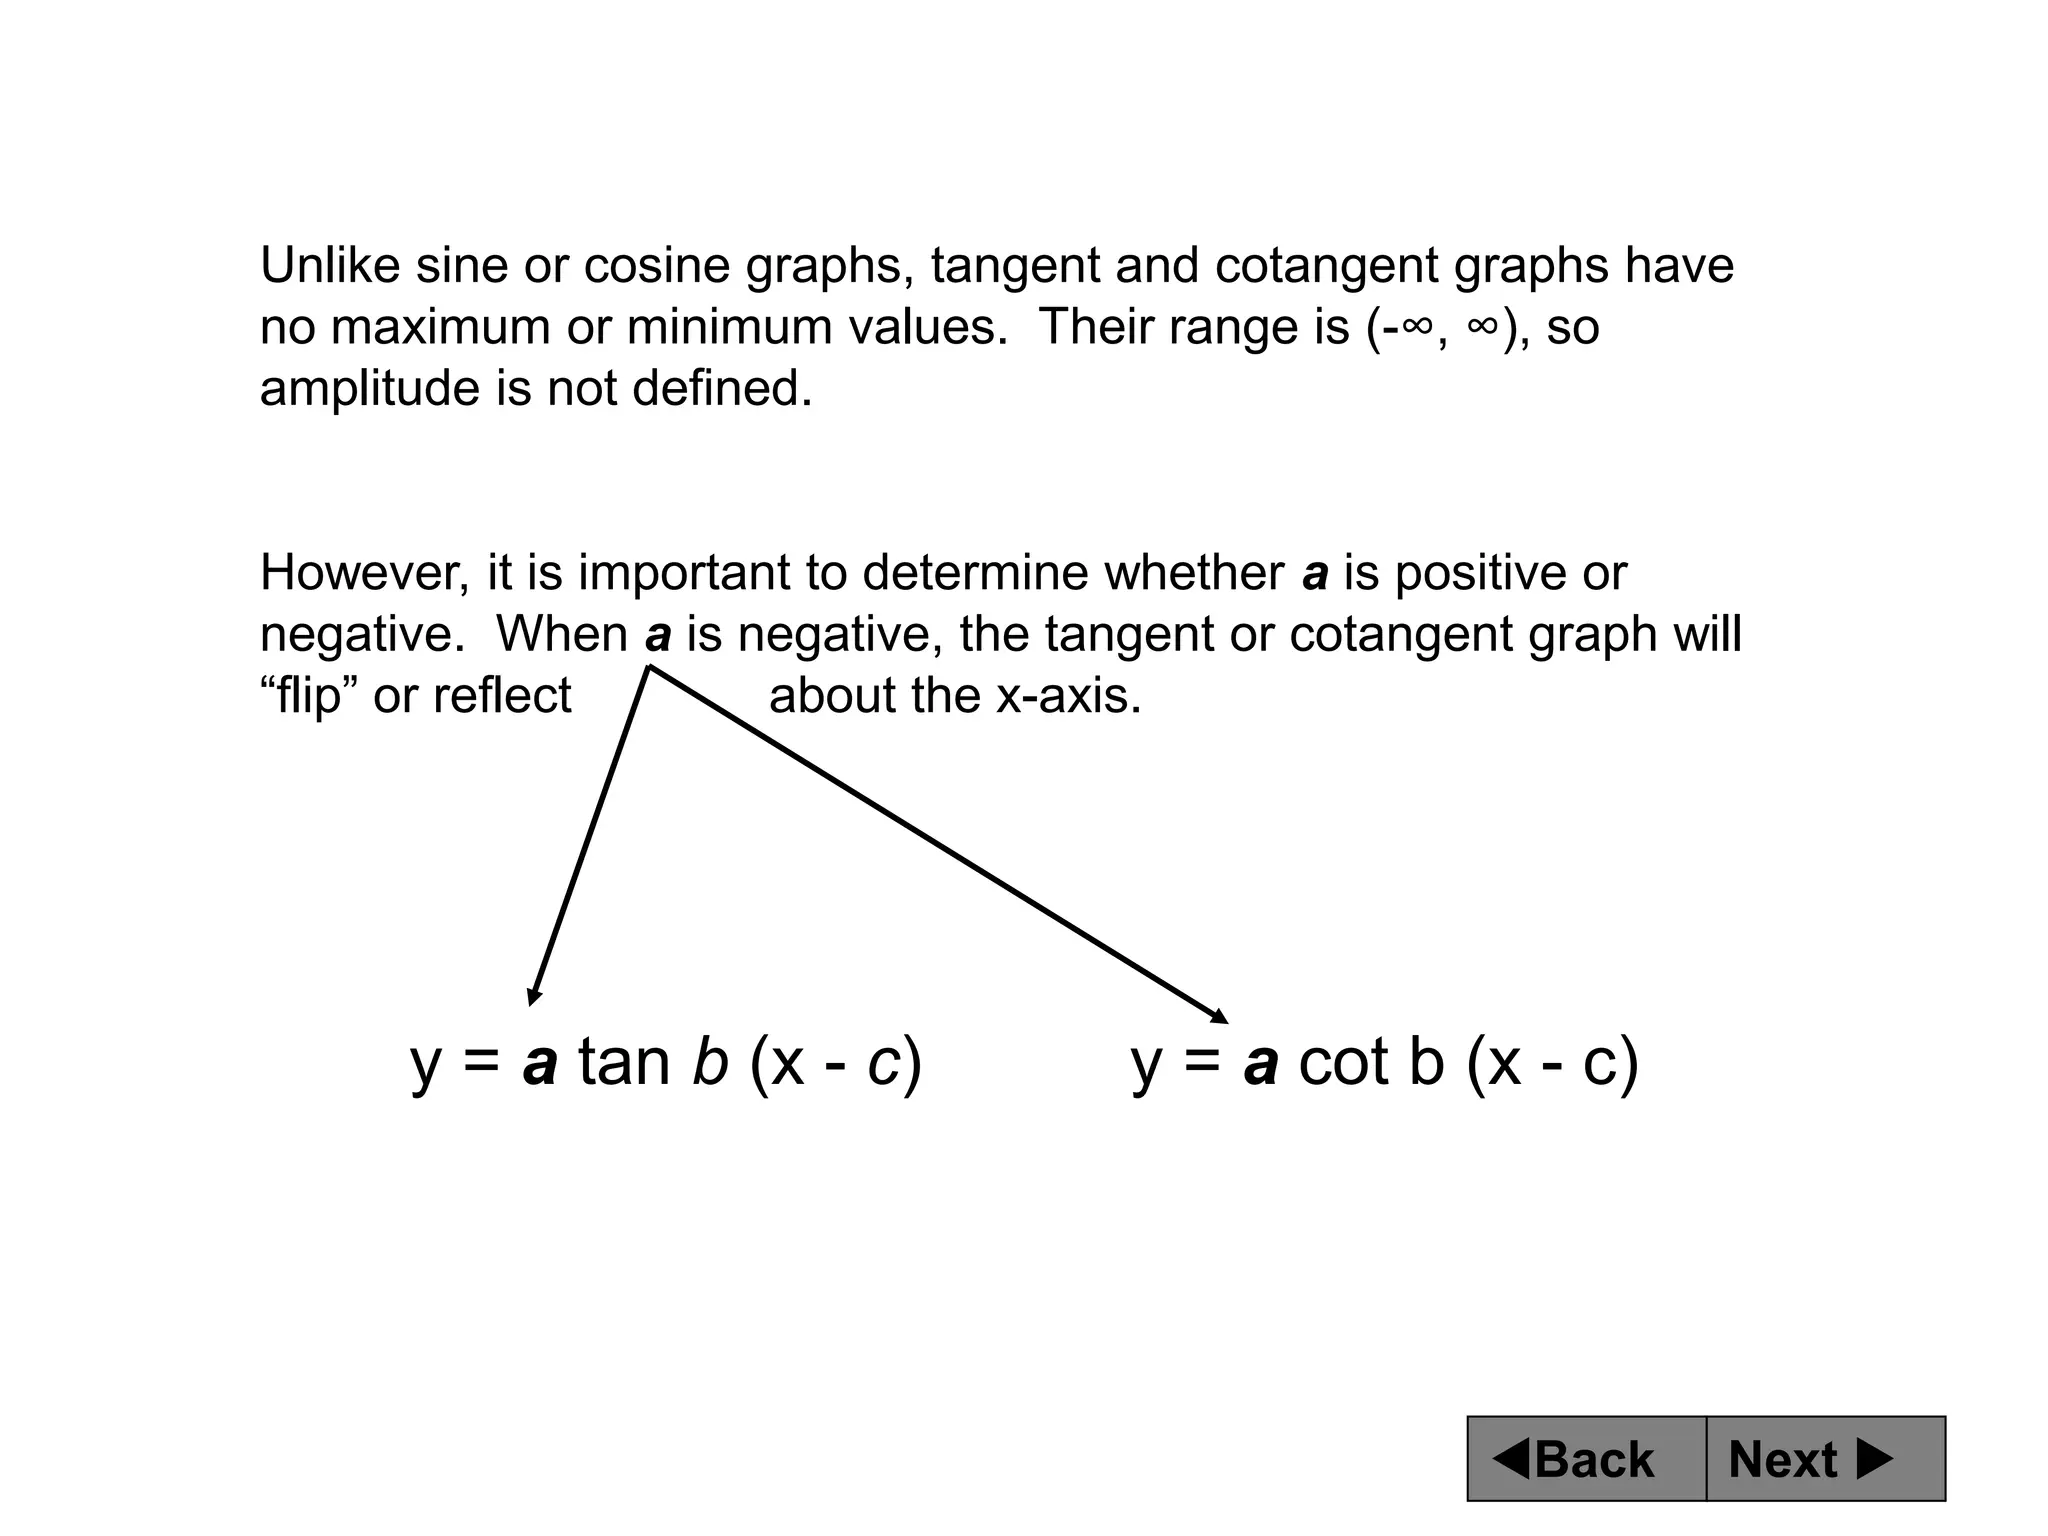
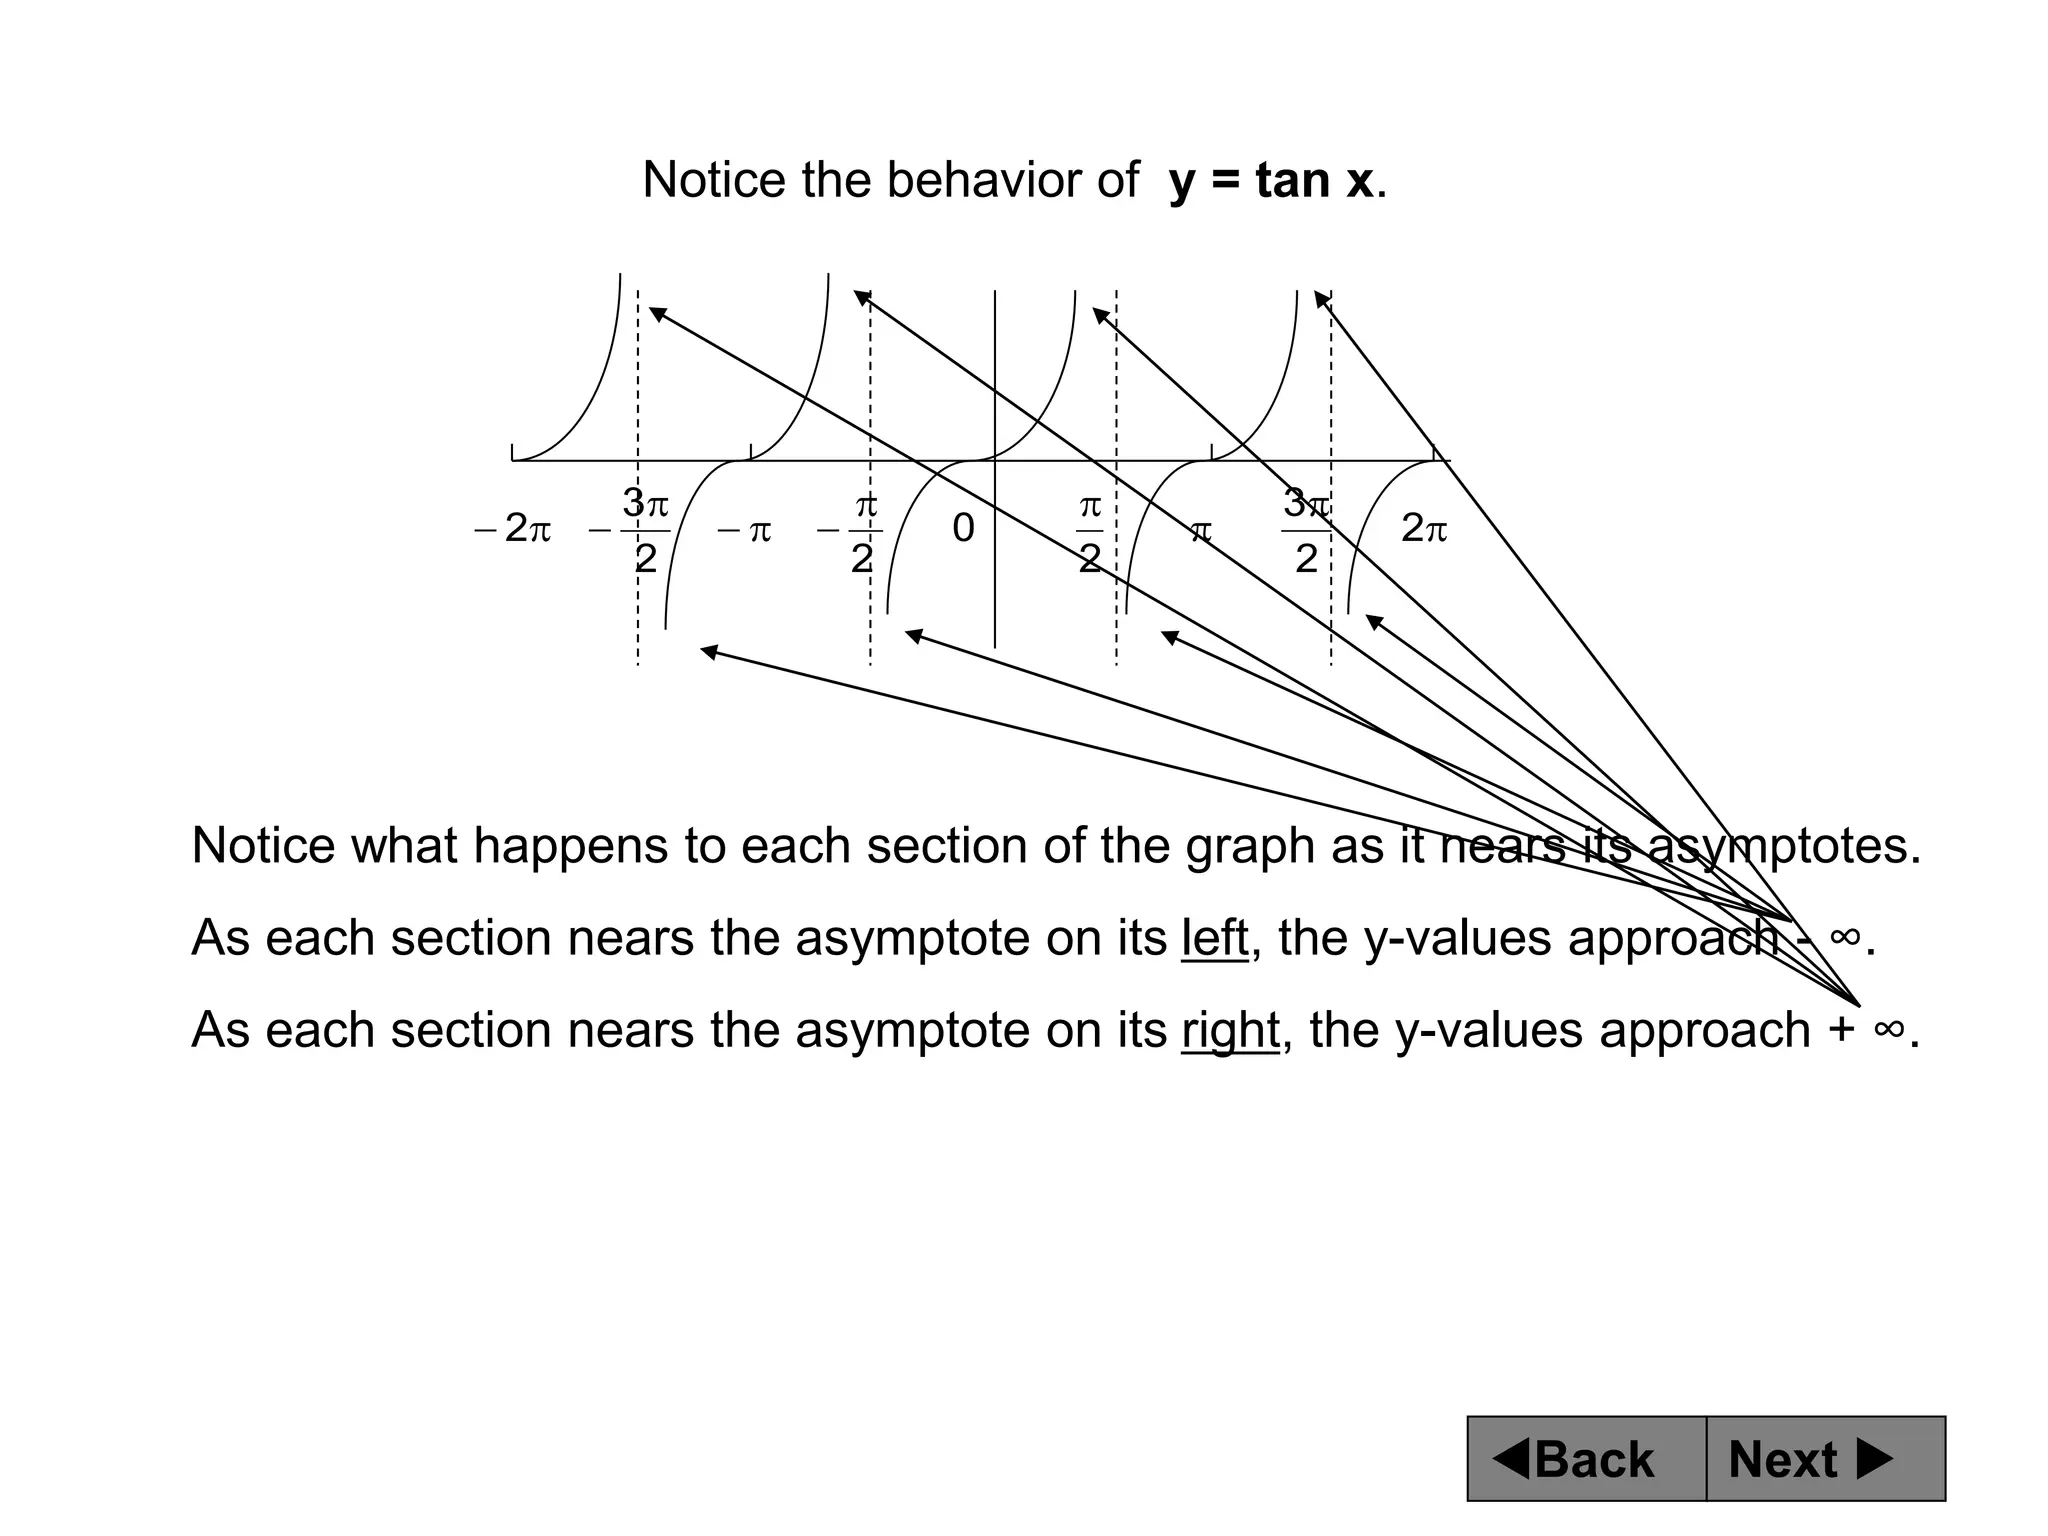
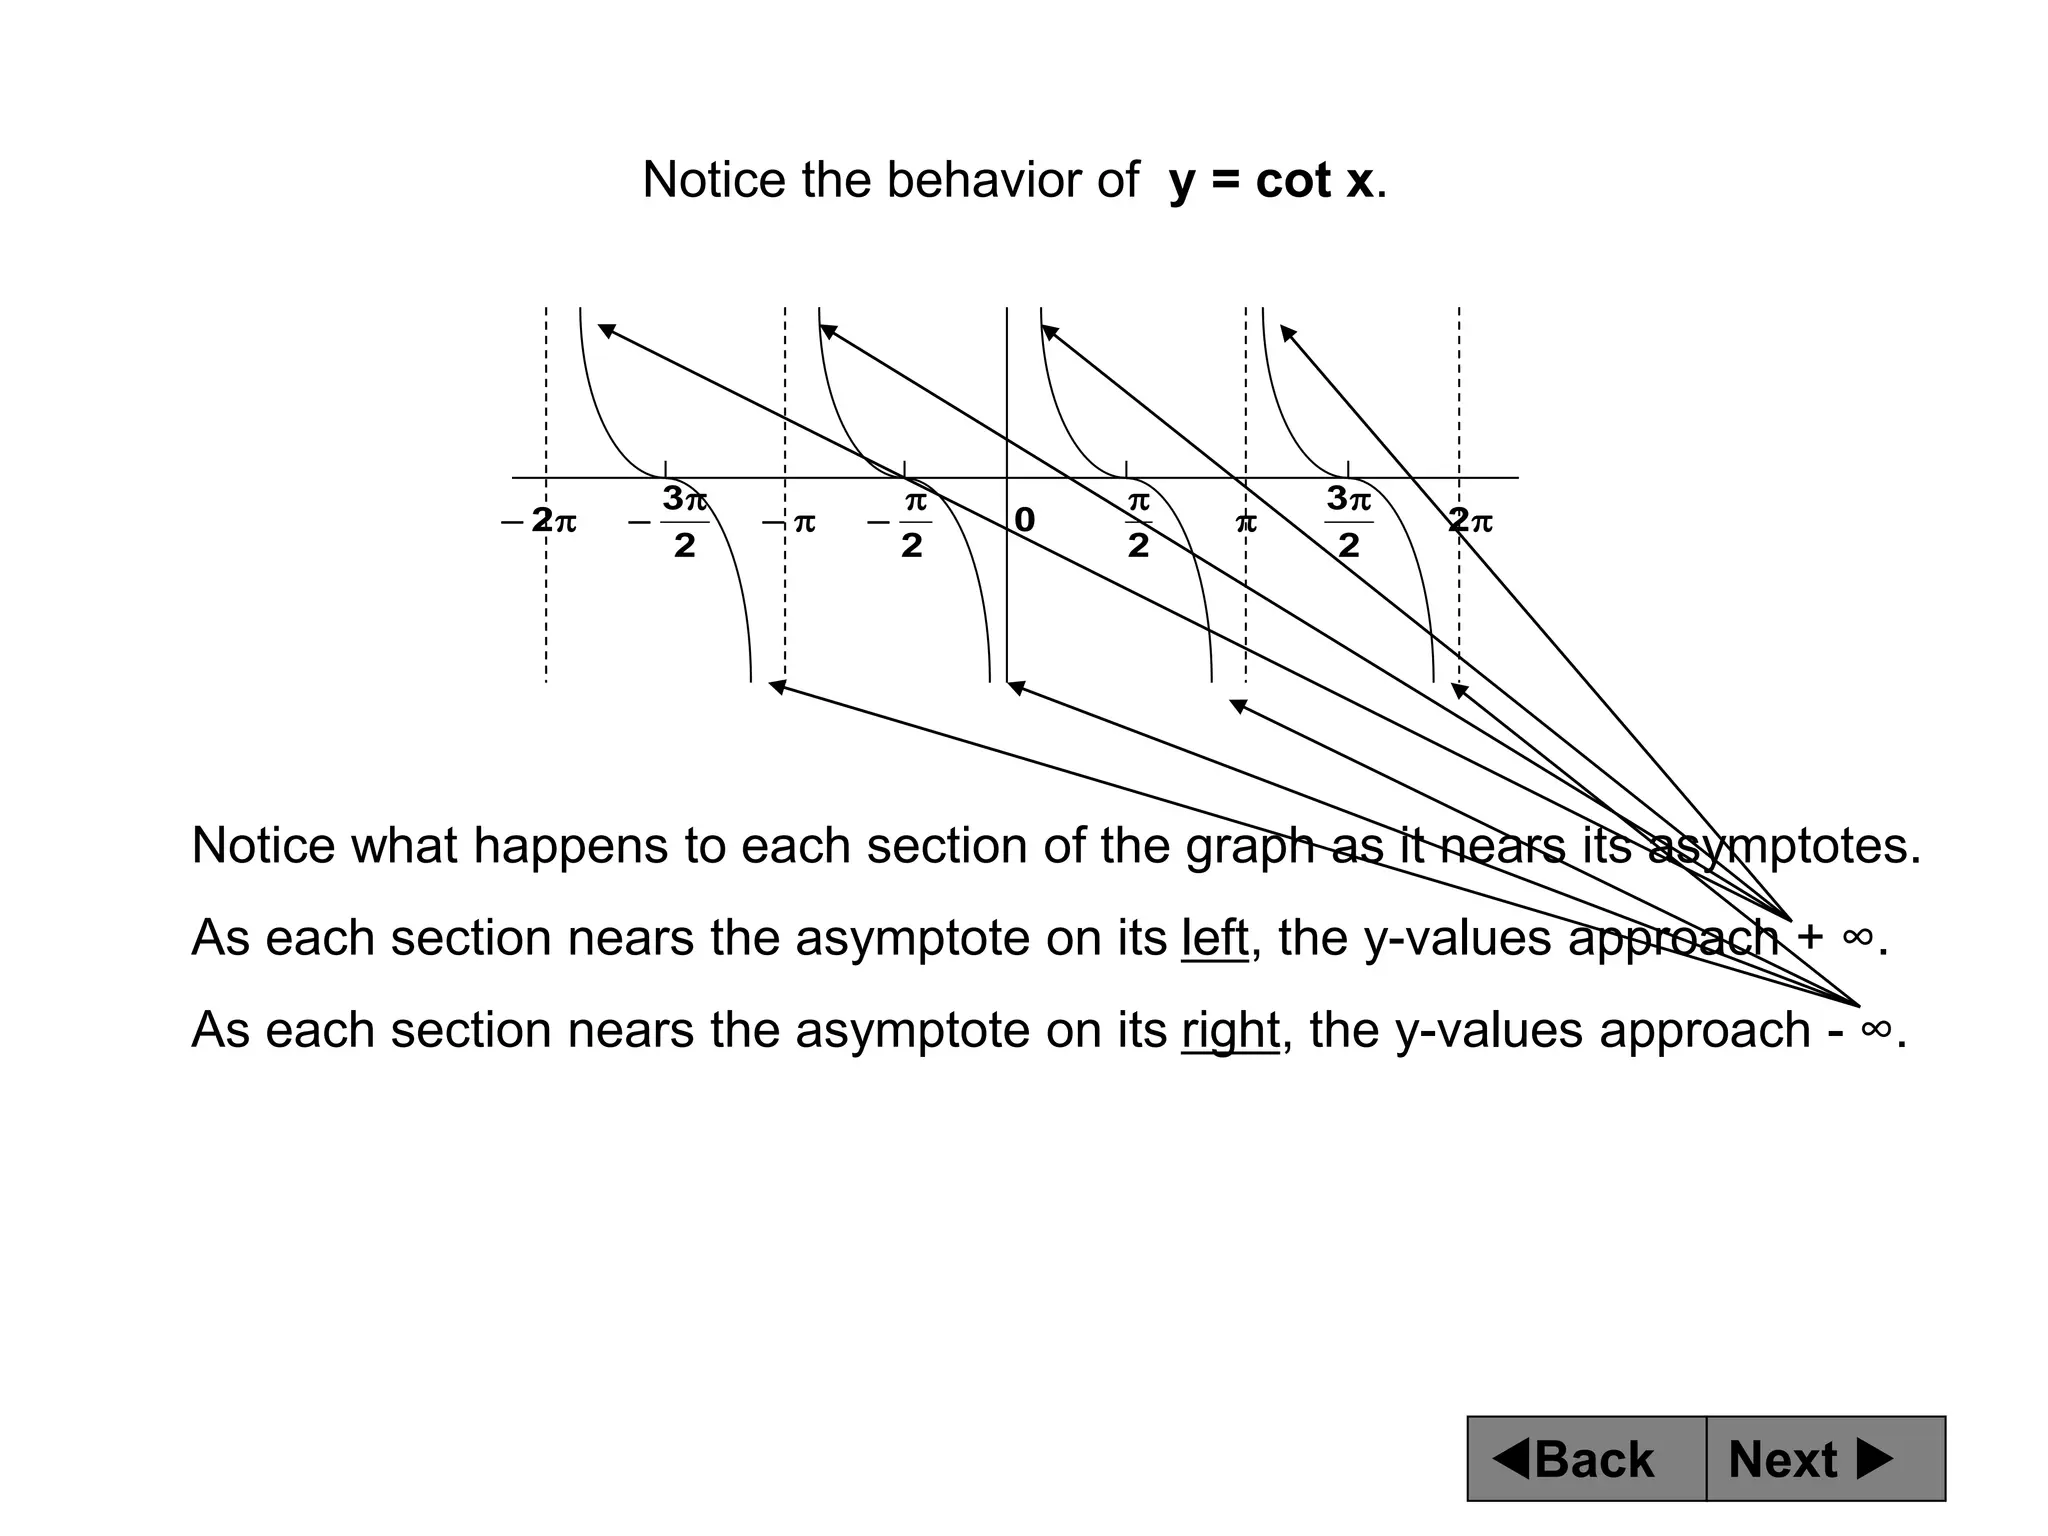
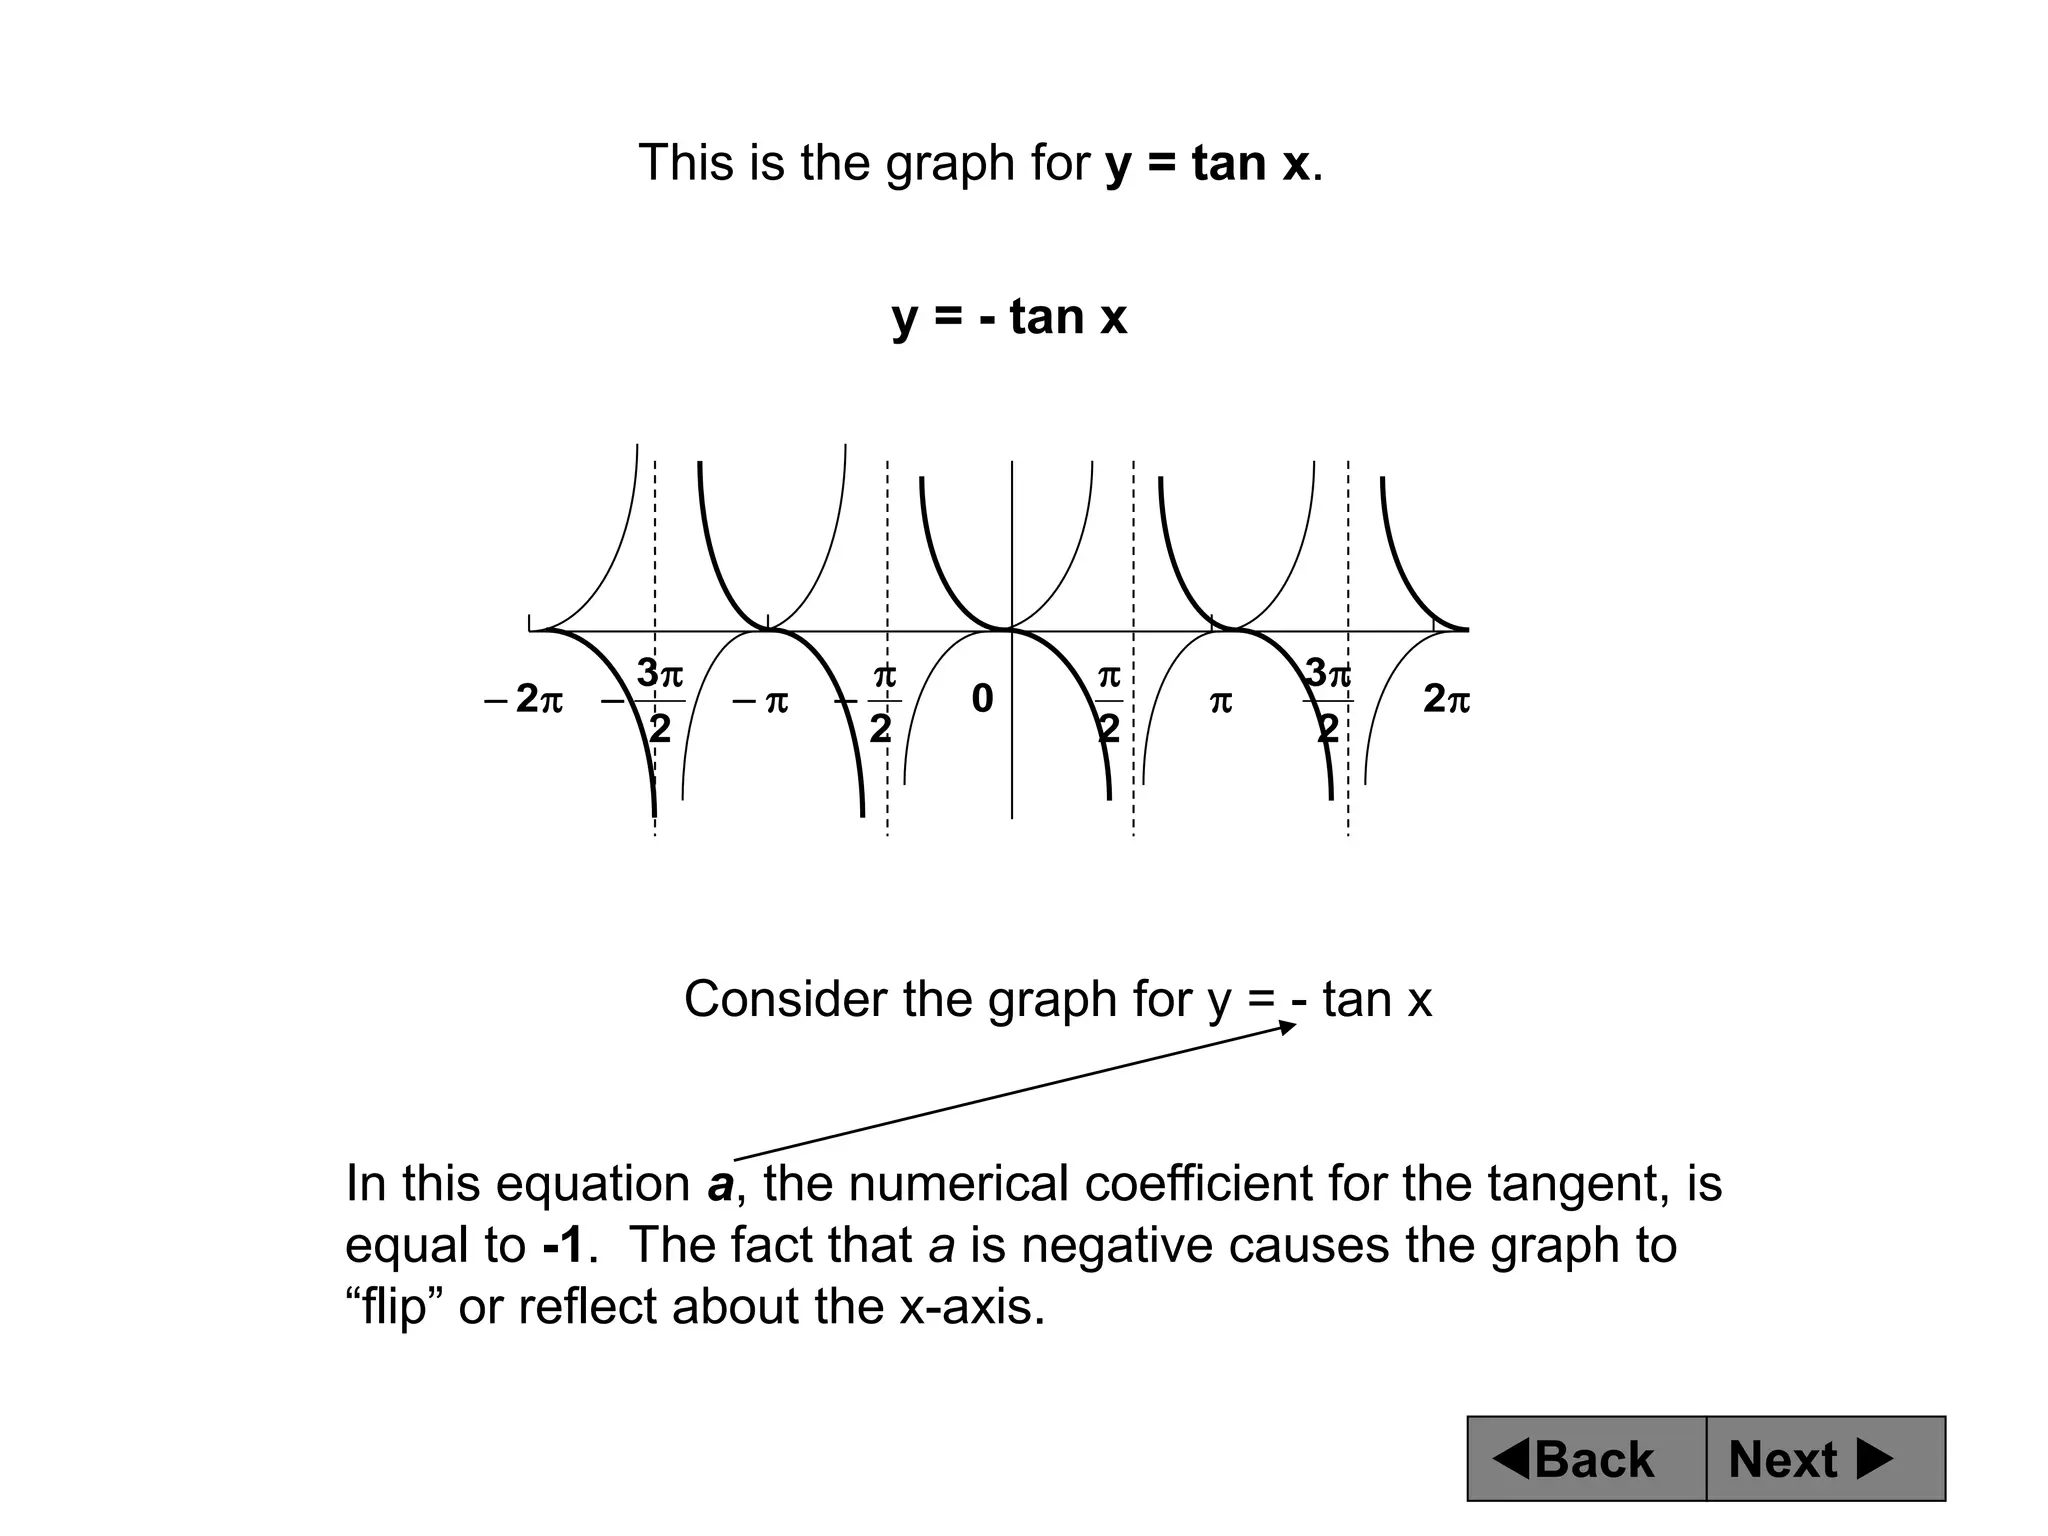
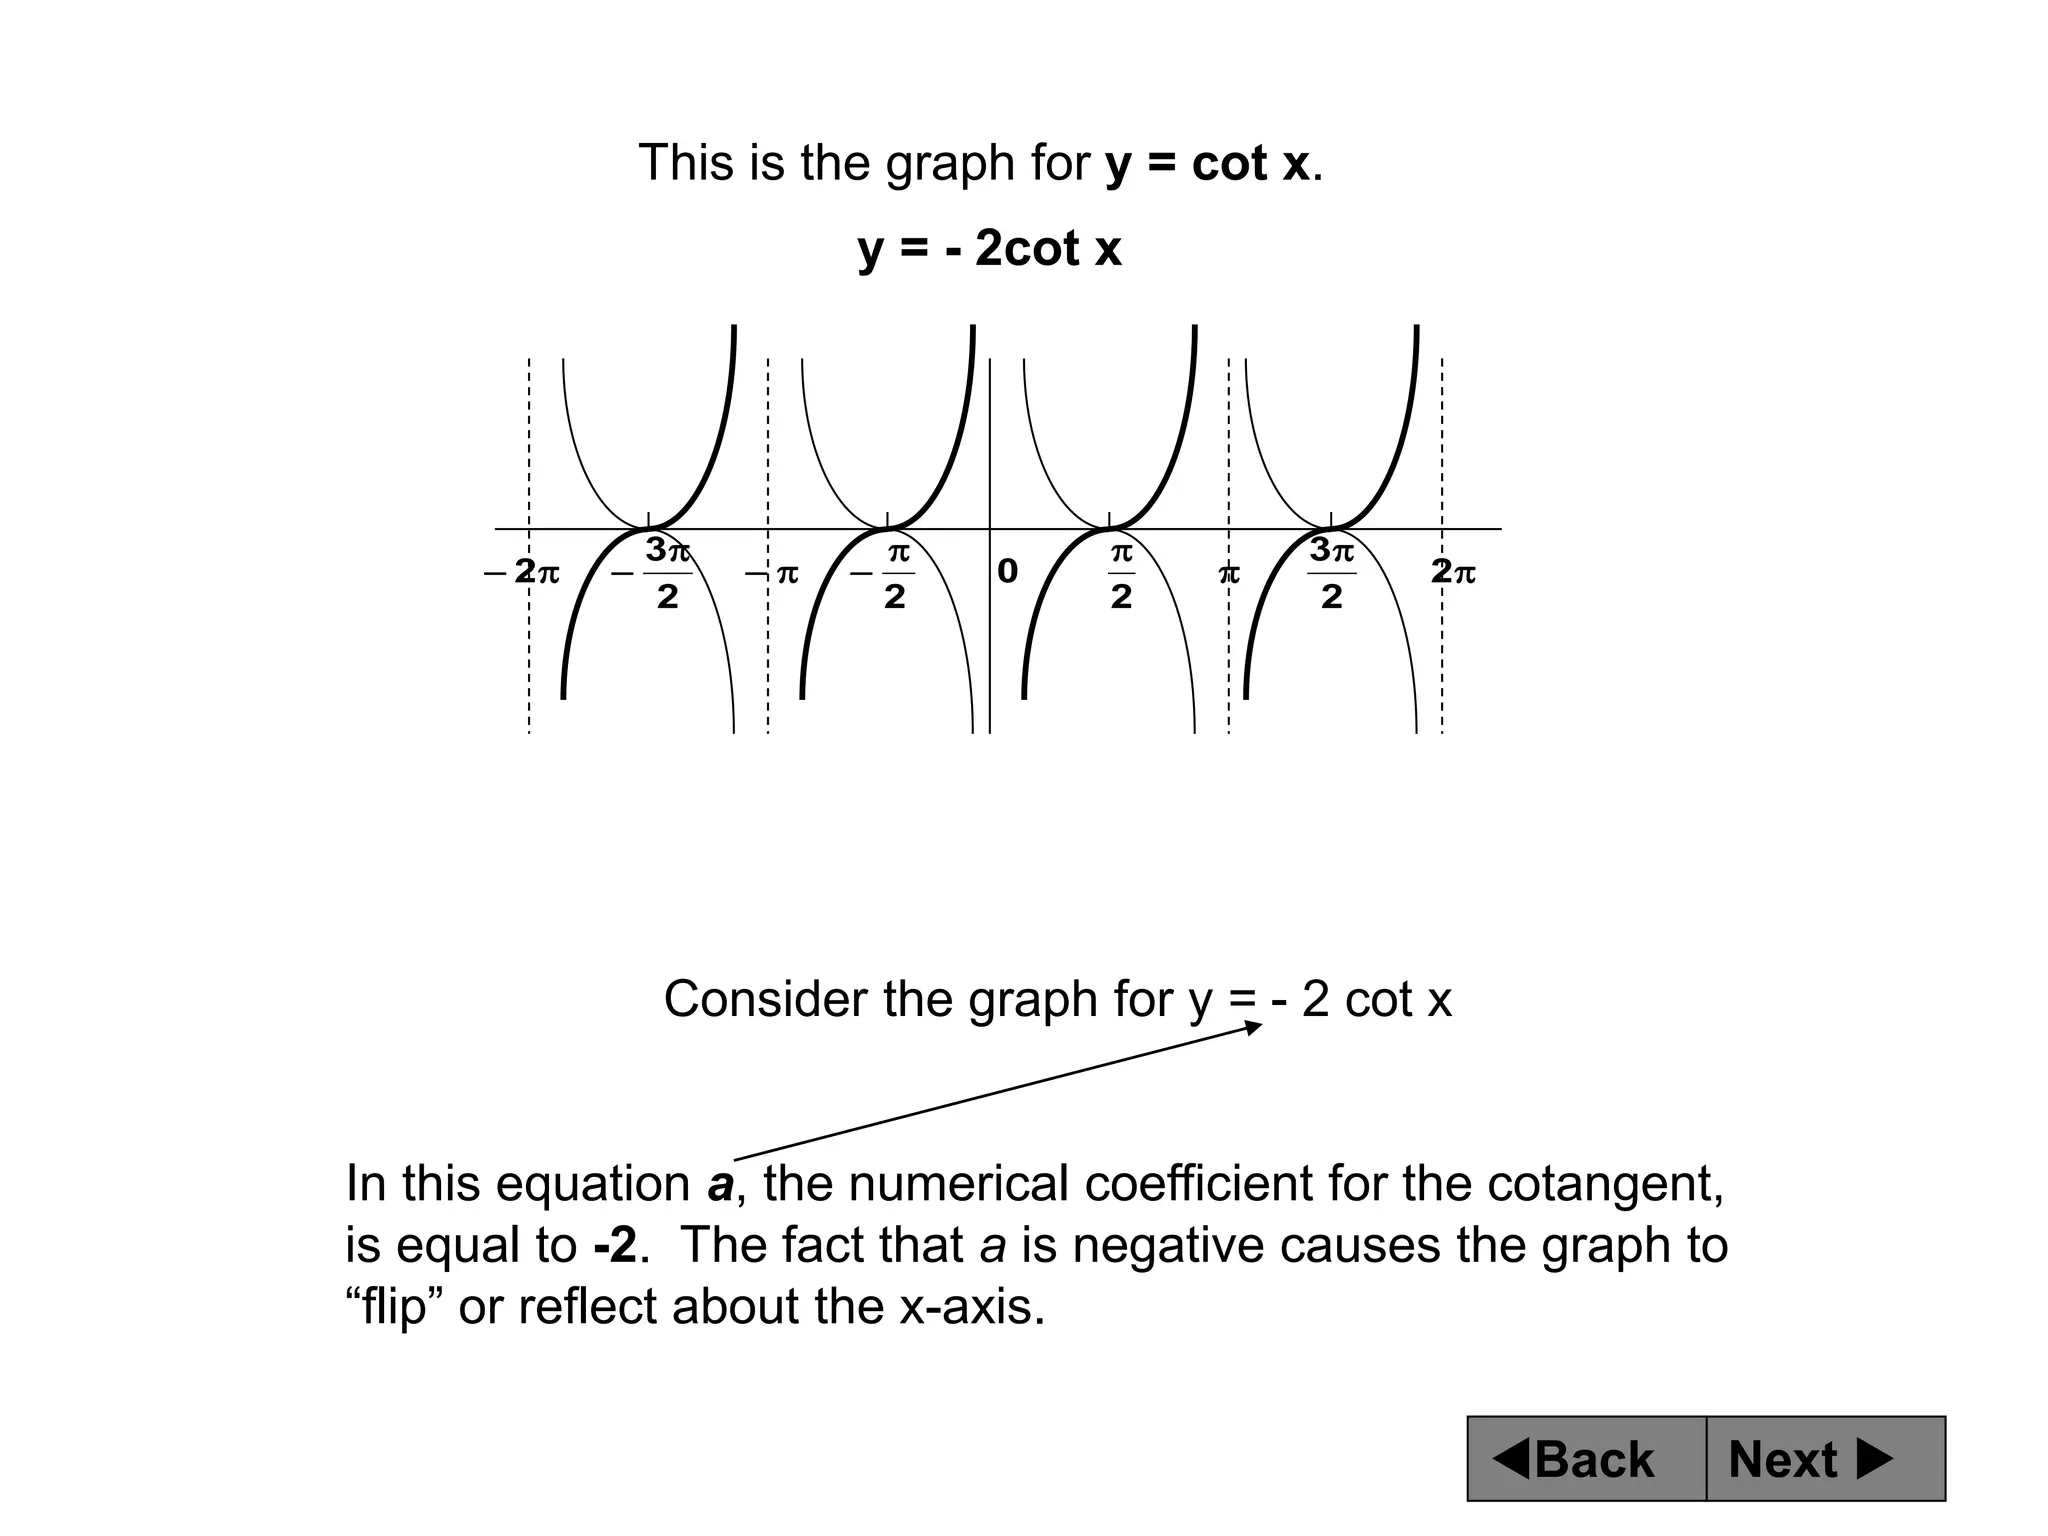
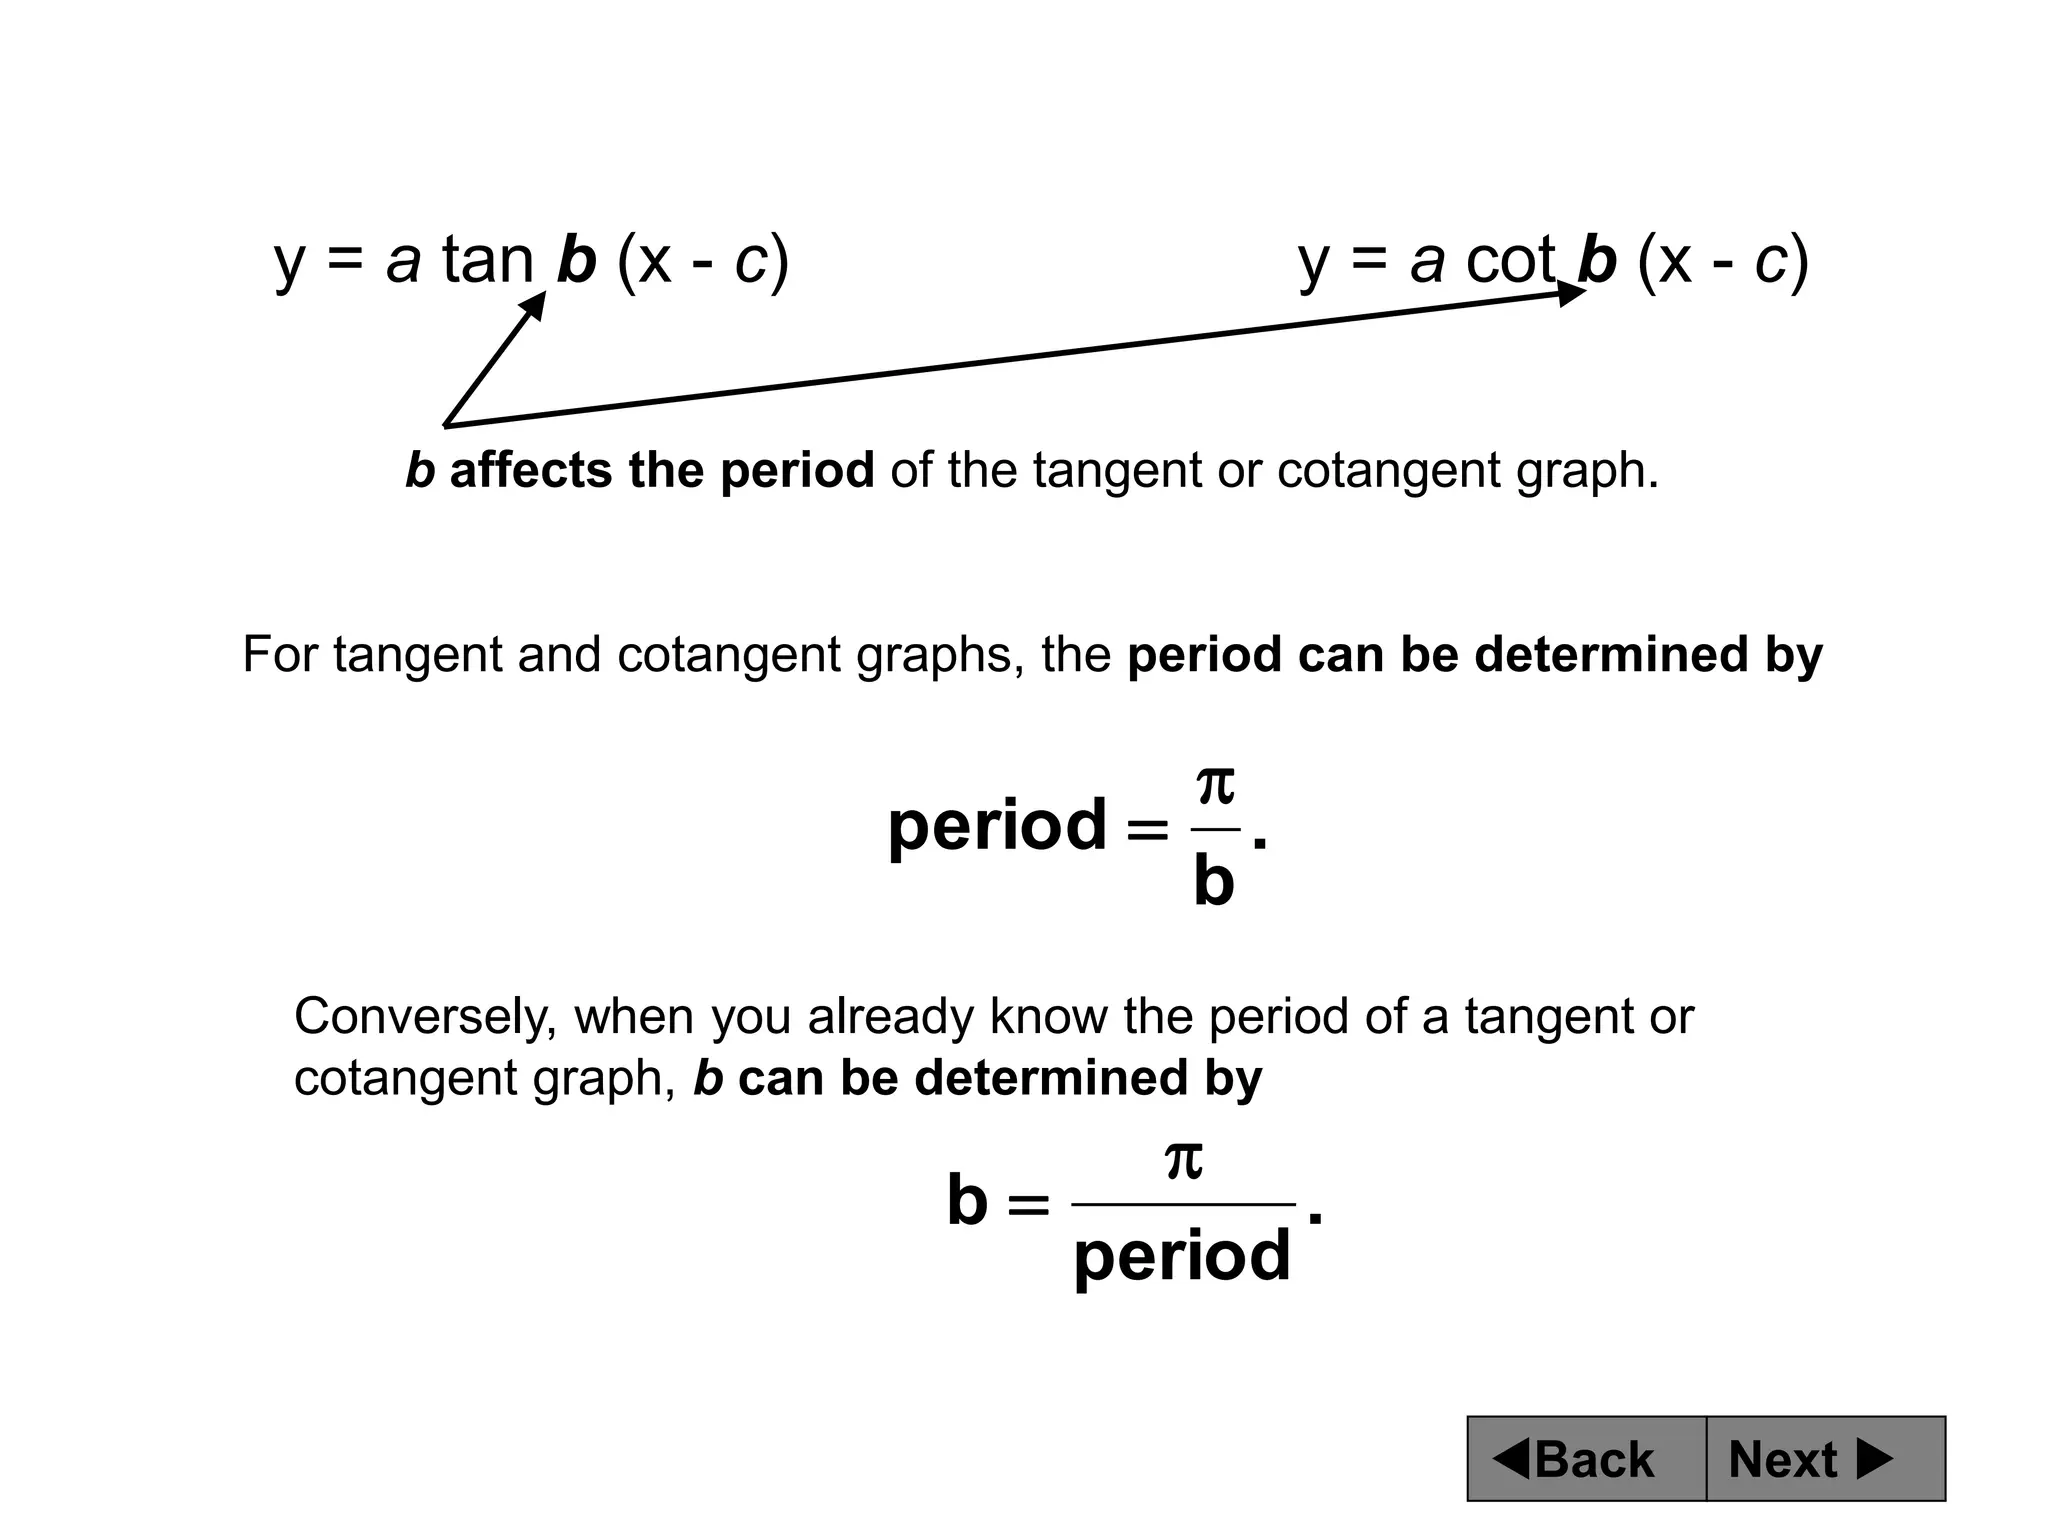
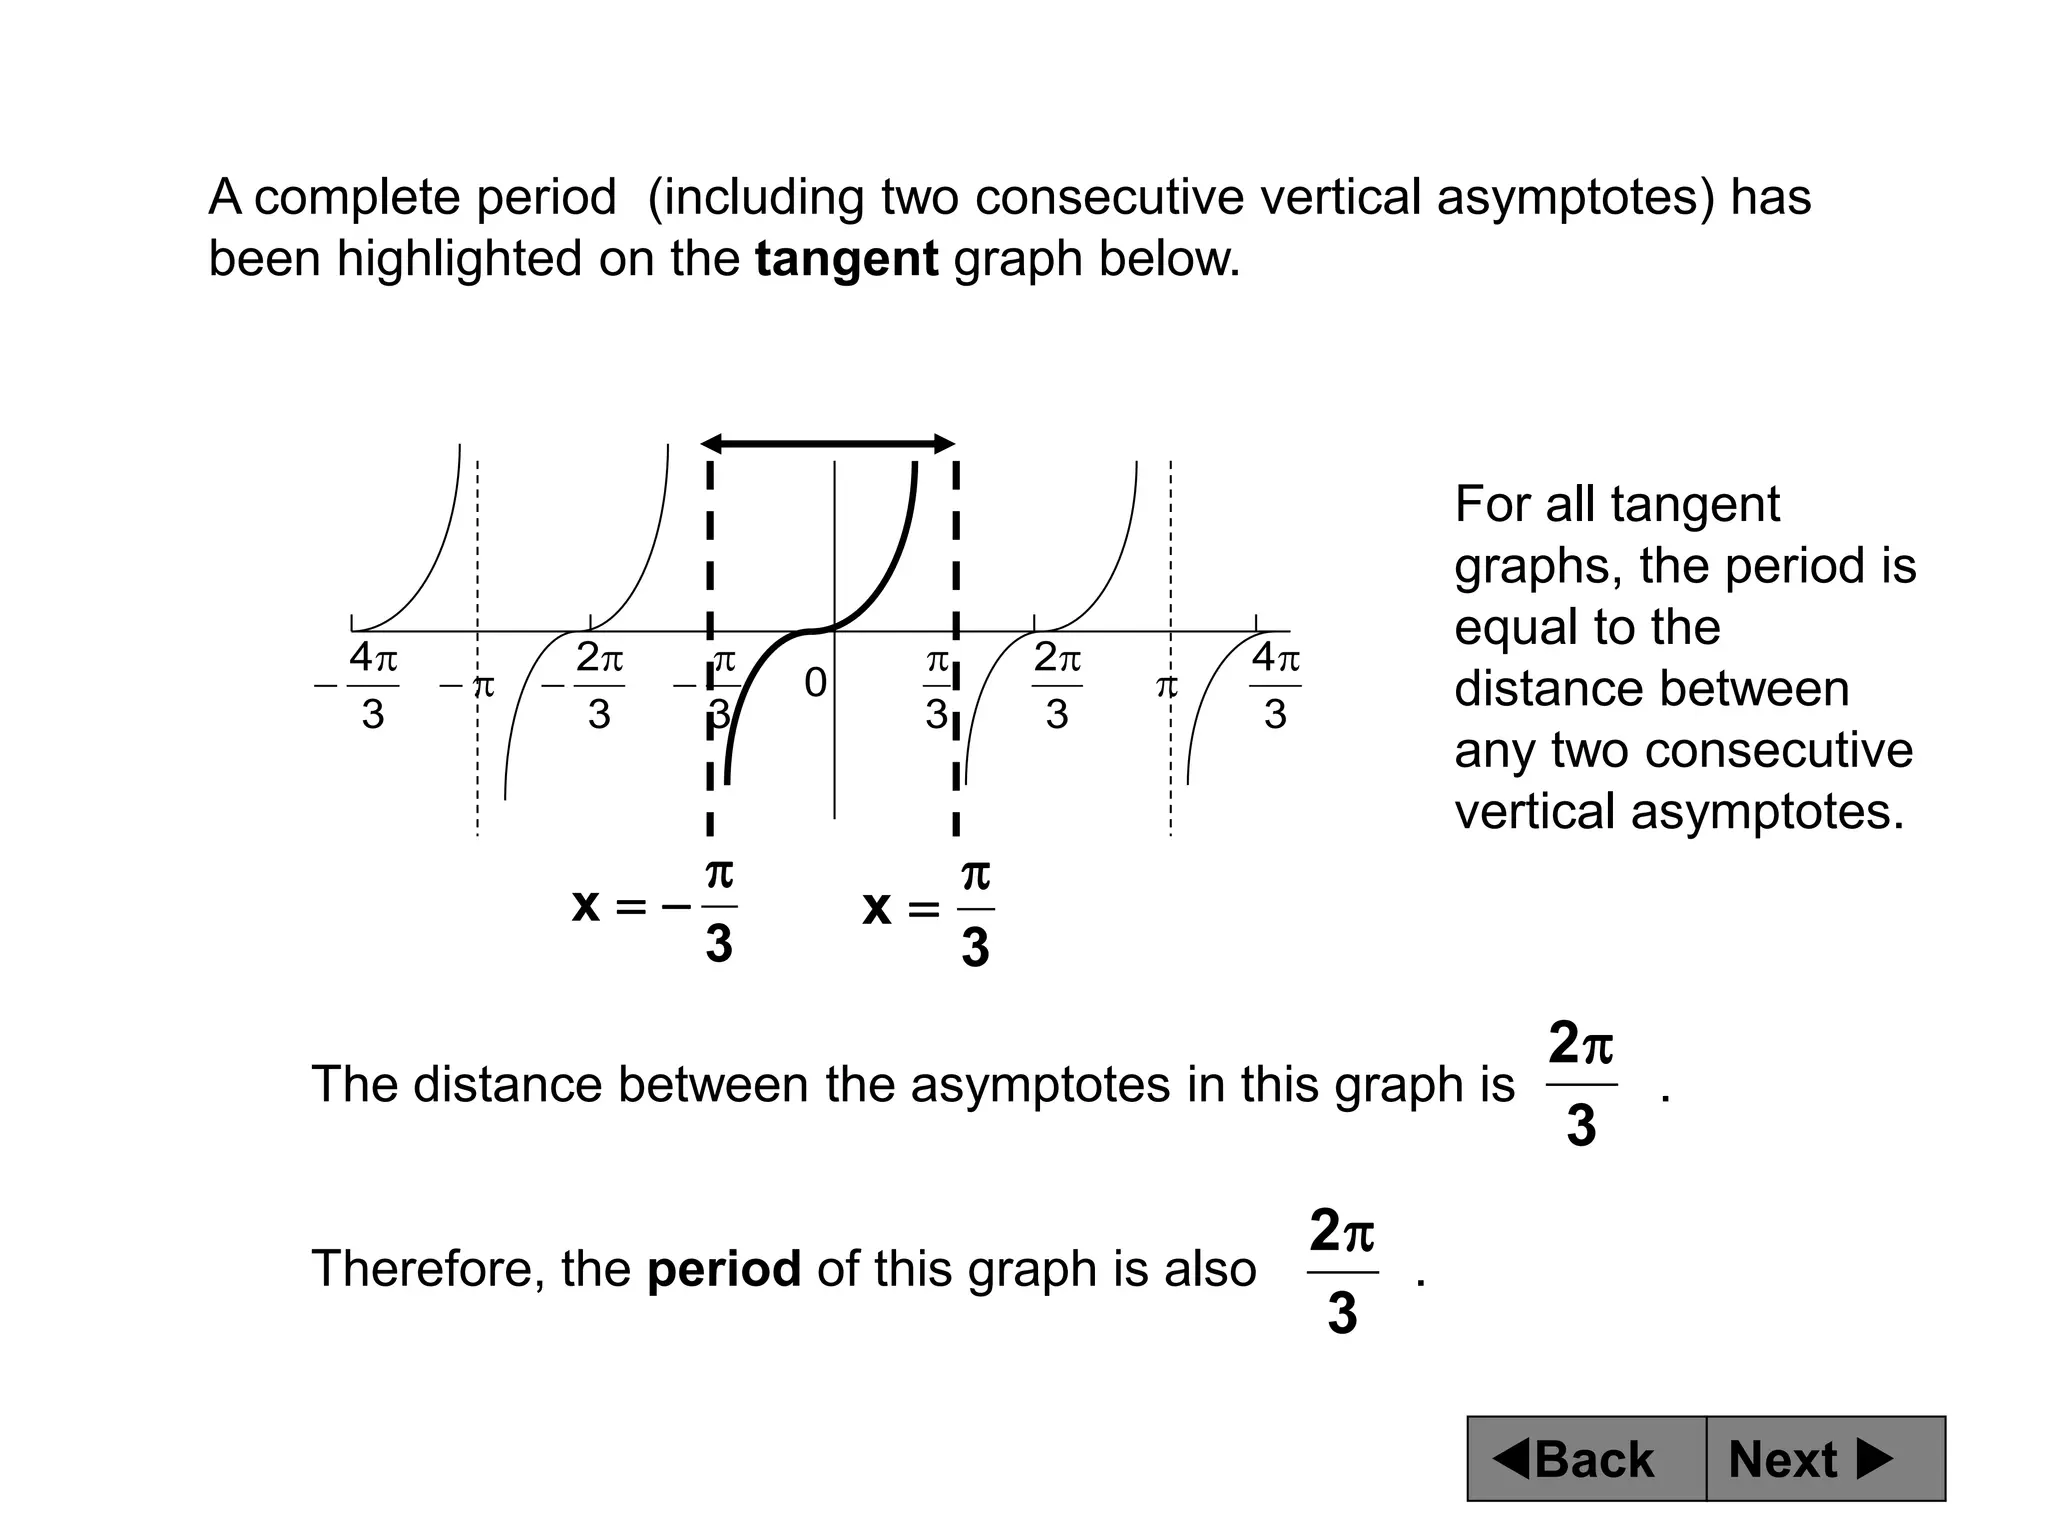
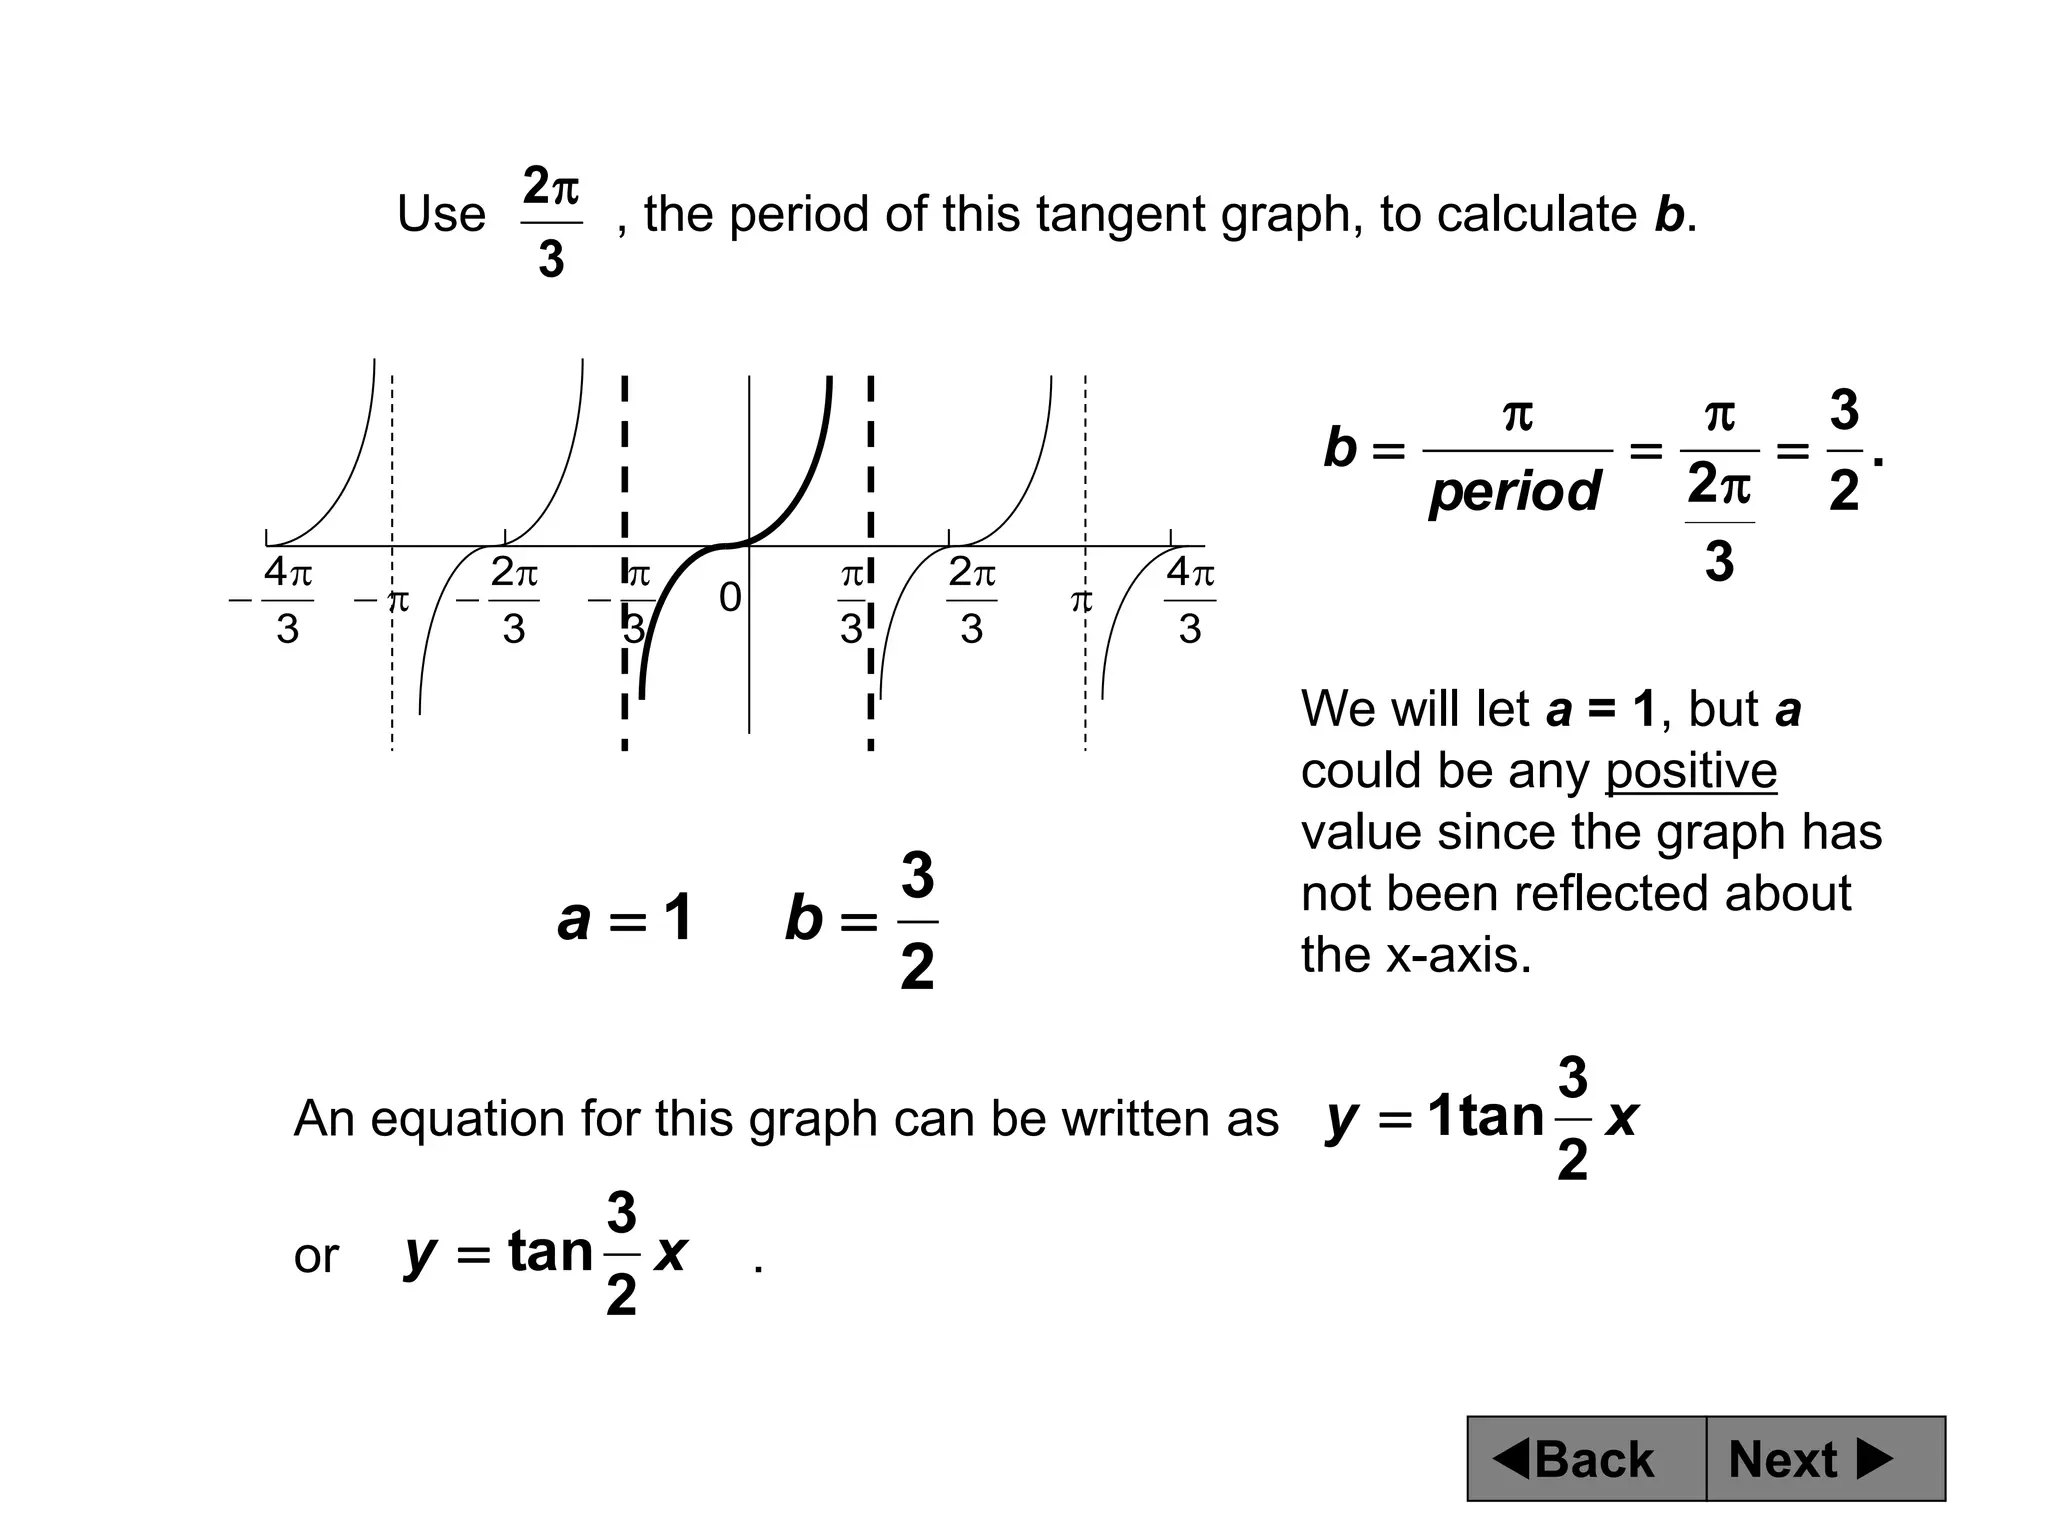
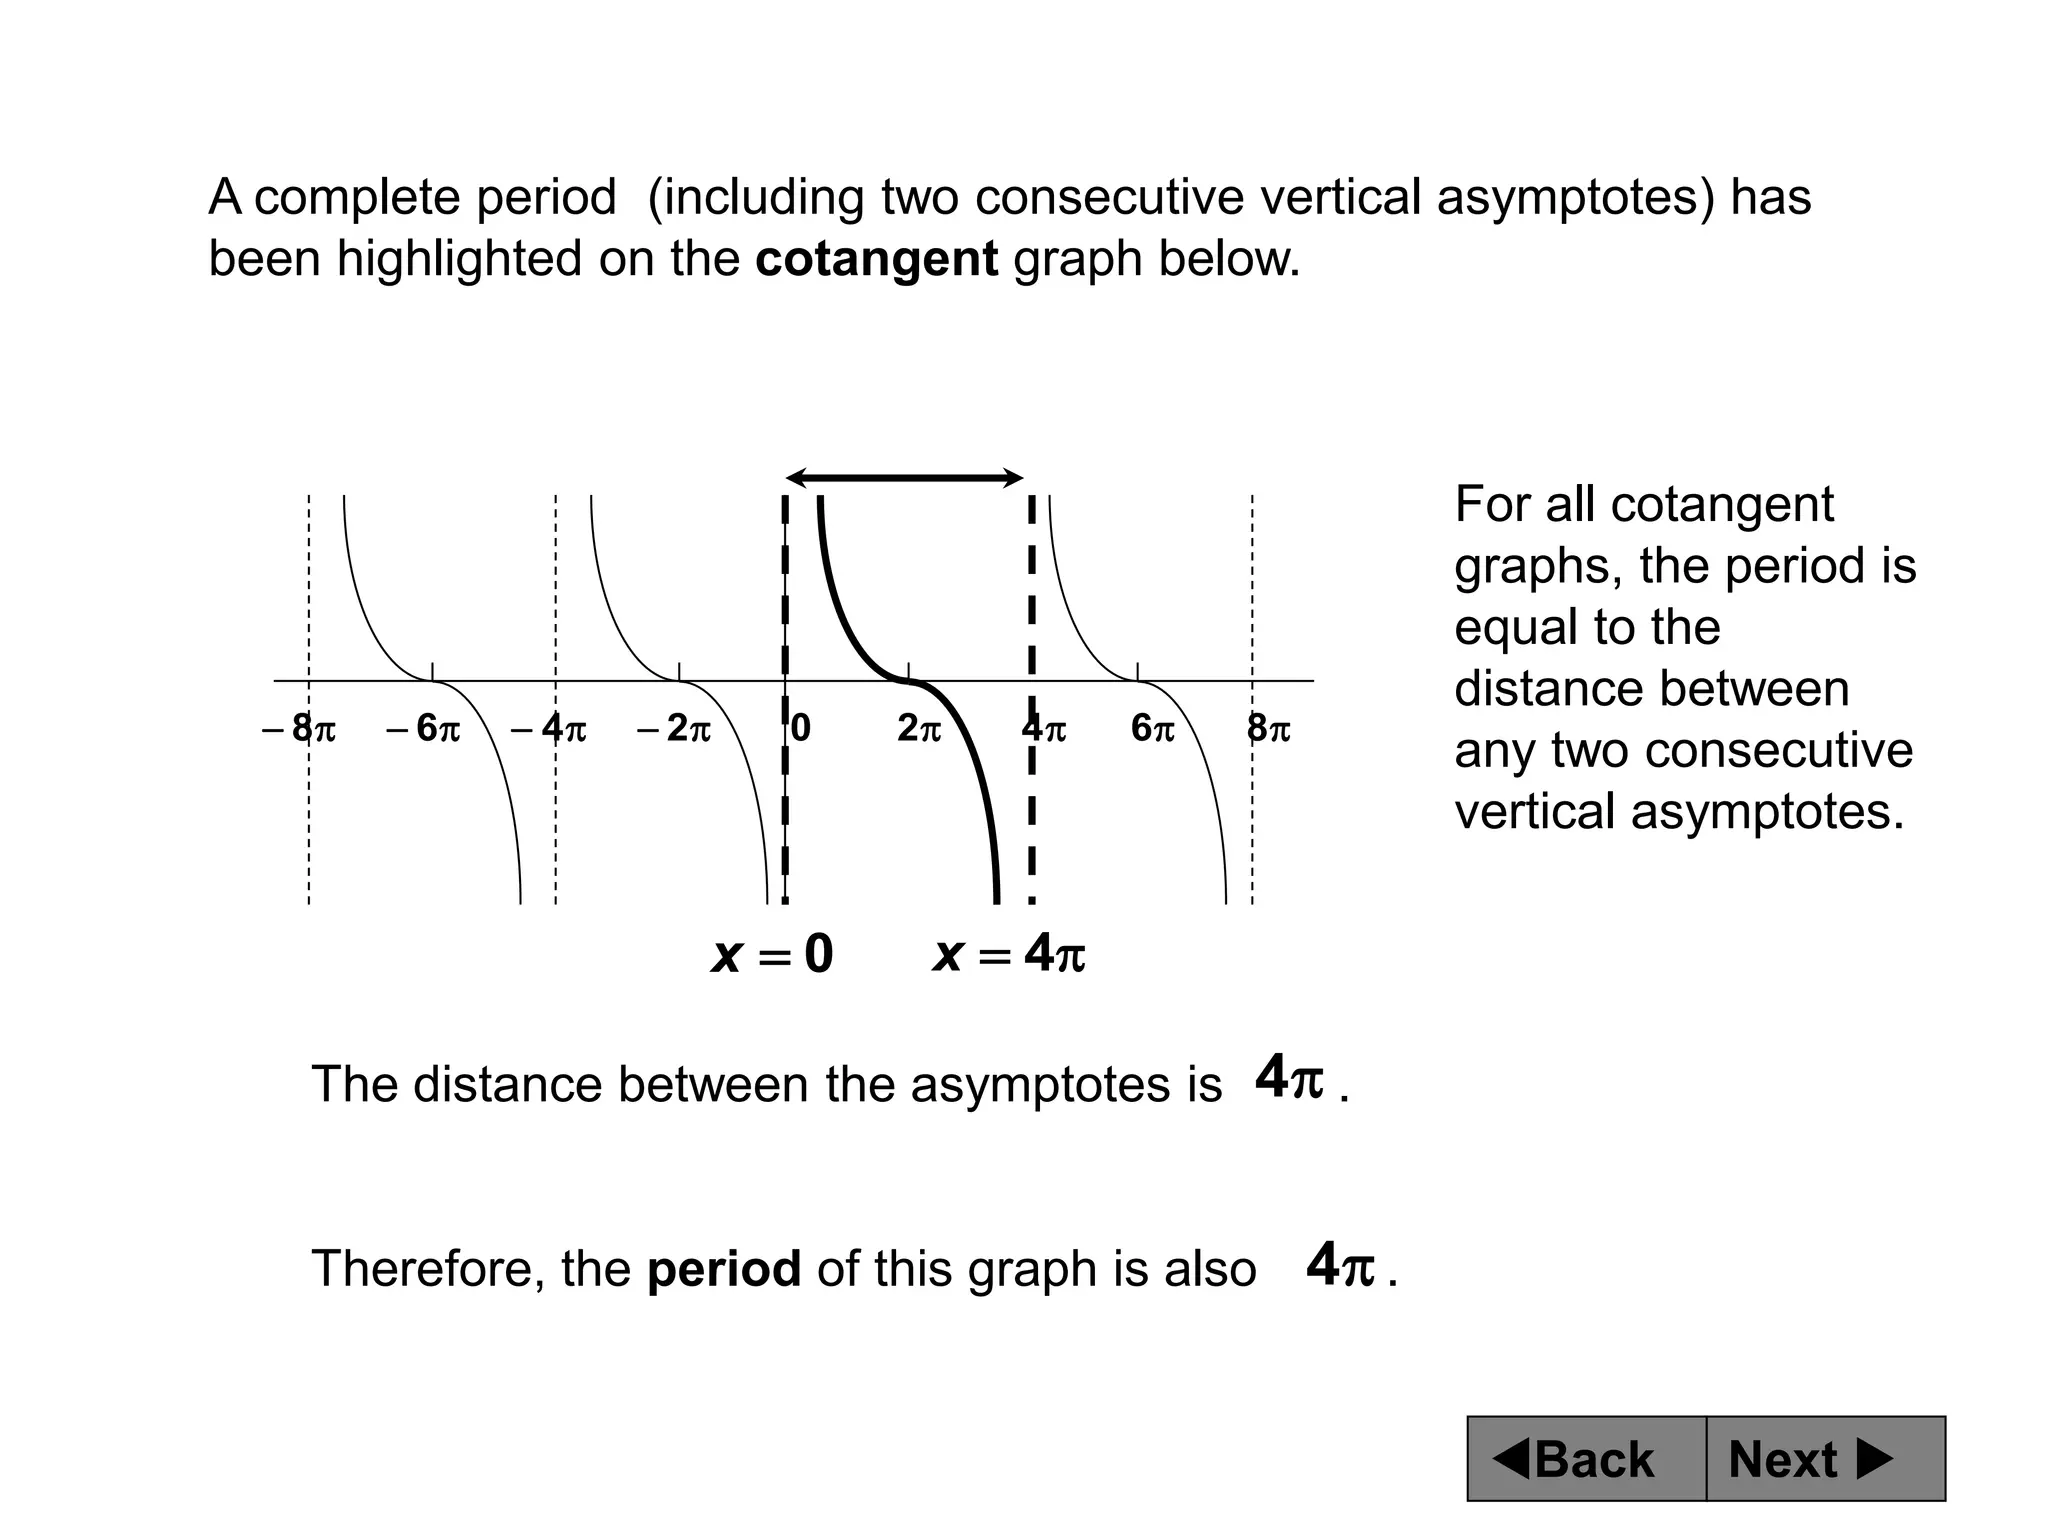
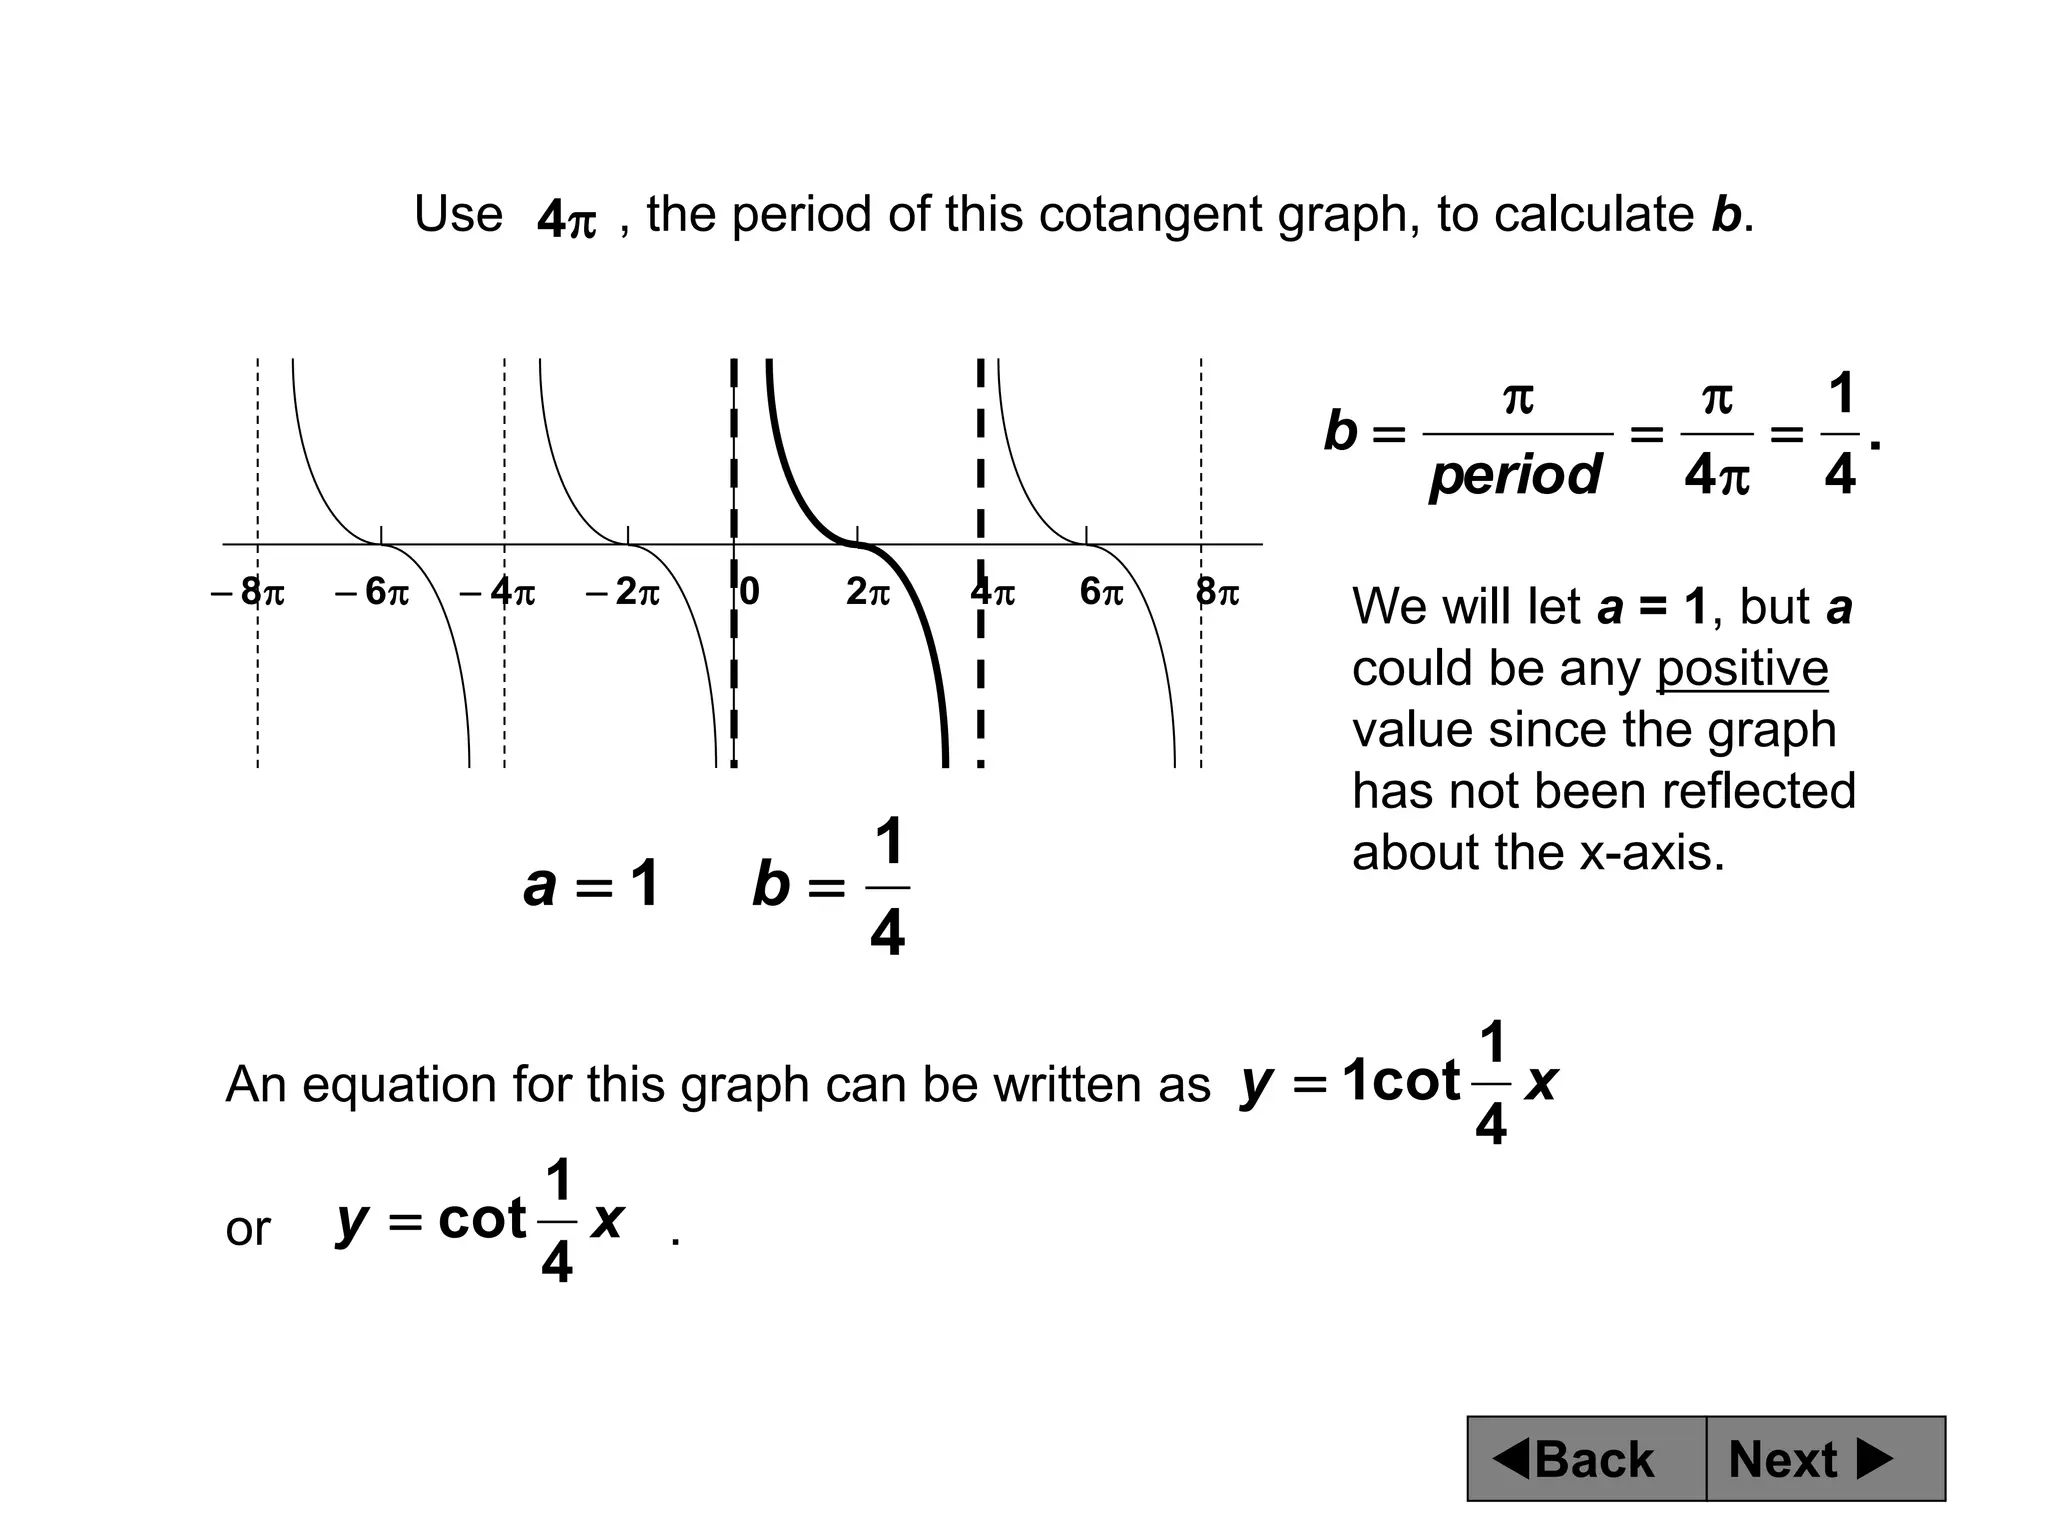
Next 
Back
Tangent and Cotangent
Graphs
Reading and Drawing
Tangent and Cotangent Graphs
Some slides in this presentation contain animation. Slides will be
more meaningful if you allow each slide to finish its presentation
before moving to the next one.
Next 
Back
This is the graph for y = tan x.
This is the graph for y = cot x.











 2
2
3
2
0
2
2
3
2











 2
2
3
2
0
2
2
3
2
Next 
Back
One definition for tangent is .
x
cos
x
sin
x
tan 
Notice that the denominator is cos x. This indicates a
relationship between a tangent graph and a cosine graph.











 2
2
3
2
0
2
2
3
2
This is the graph for y = cos x.
Next 
Back











 2
2
3
2
0
2
2
3
2
To see how the cosine and tangent graphs are related, look at what
happens when the graph for y = tan x is superimposed over y = cos x.
Next 
Back











 2
2
3
2
0
2
2
3
2
In the diagram below, y = cos x is drawn in gray while y = tan x
is drawn in black.
Notice that the tangent graph has VERTICAL asymptotes
(indicated by broken lines) everywhere the cosine graph
touches the x-axis.
Next 
Back
One definition for cotangent is .
x
sin
x
cos
x
cot 
Notice that the denominator is sin x. This indicates a
relationship between a cotangent graph and a sine graph.
This is the graph for y = sin x.











 2
2
3
2
0
2
2
3
2
Next 
Back
To see how the sine and cotangent graphs are related, look at what
happens when the graph for y = cot x is superimposed over y = sin x.











 2
2
3
2
0
2
2
3
2
Next 
Back











 2
2
3
2
0
2
2
3
2
In the diagram below, y = sin x is drawn in gray while y = cot x is
drawn in black.
Notice that the cotangent graph has VERTICAL asymptotes
(indicated by broken lines) everywhere the sine graph touches
the x-axis.
Next 
Back
y = tan x.
y = cot x.











 2
2
3
2
0
2
2
3
2











 2
2
3
2
0
2
2
3
2
For tangent and cotangent graphs, the distance between any two
consecutive vertical asymptotes represents one complete period.
Next 
Back
y = tan x.
y = cot x.











 2
2
3
2
0
2
2
3
2











 2
2
3
2
0
2
2
3
2
One complete period is
highlighted on each of
these graphs.
For both y = tan x and y = cot x, the period is π. (From the beginning of
a cycle to the end of that cycle, the distance along the x-axis is π.)
Next 
Back











 2
2
3
2
0
2
2
3
2
For y = tan x, there is no phase shift.
The y-intercept is located at the point (0,0).
We will call that point, the key point.
Next 
Back











 2
2
3
2
0
2
2
3
2
A tangent graph has a phase shift if the key point
is shifted to the left or to the right.
Next 
Back











 2
2
3
2
0
2
2
3
2
For y = cot x, there is no phase shift.
Y = cot x has a vertical asymptote located along the y-axis.
We will call that asymptote, the key asymptote.
Next 
Back











 2
2
3
2
0
2
2
3
2
A cotangent graph has a phase shift if the key
asymptote is shifted to the left or to the right.
Next 
Back
y = a tan b (x - c).
For a tangent graph
which has no vertical shift,
the equation for the graph
can be written as
For a cotangent graph
which has no vertical shift,
the equation for the graph
can be written as
y = a cot b (x - c).
c
indicates the
phase shift, also
known as the
horizontal shift.
a
indicates whether the
graph reflects about
the x-axis.
b
affects the
period.
Next 
Back
y = a tan b (x - c) y = a cot b (x - c)
Unlike sine or cosine graphs, tangent and cotangent graphs have
no maximum or minimum values. Their range is (-∞, ∞), so
amplitude is not defined.
However, it is important to determine whether a is positive or
negative. When a is negative, the tangent or cotangent graph will
“flip” or reflect about the x-axis.
Next 
Back











 2
2
3
2
0
2
2
3
2
Notice the behavior of y = tan x.
Notice what happens to each section of the graph as it nears its asymptotes.
As each section nears the asymptote on its left, the y-values approach - ∞.
As each section nears the asymptote on its right, the y-values approach + ∞.
Next 
Back
Notice what happens to each section of the graph as it nears its asymptotes.
As each section nears the asymptote on its left, the y-values approach + ∞.
As each section nears the asymptote on its right, the y-values approach - ∞.











 2
2
3
2
0
2
2
3
2
Notice the behavior of y = cot x.
Next 
Back
This is the graph for y = tan x.











 2
2
3
2
0
2
2
3
2
y = - tan x
Consider the graph for y = - tan x
In this equation a, the numerical coefficient for the tangent, is
equal to -1. The fact that a is negative causes the graph to
“flip” or reflect about the x-axis.
Next 
Back
This is the graph for y = cot x.











 2
2
3
2
0
2
2
3
2
y = - 2cot x
Consider the graph for y = - 2 cot x
In this equation a, the numerical coefficient for the cotangent,
is equal to -2. The fact that a is negative causes the graph to
“flip” or reflect about the x-axis.
Next 
Back
y = a tan b (x - c) y = a cot b (x - c)
b affects the period of the tangent or cotangent graph.
For tangent and cotangent graphs, the period can be determined by
.
b
period


Conversely, when you already know the period of a tangent or
cotangent graph, b can be determined by
.
period
b


Next 
Back
A complete period (including two consecutive vertical asymptotes) has
been highlighted on the tangent graph below.
The distance between the asymptotes in this graph is .
Therefore, the period of this graph is also .
3
x



3
x


3
2
3
4
3
2
3
0
3
3
2
3
4 











For all tangent
graphs, the period is
equal to the
distance between
any two consecutive
vertical asymptotes.
3
2
Next 
Back
.
2
3
3
2






period
b
We will let a = 1, but a
could be any positive
value since the graph has
not been reflected about
the x-axis.
3
2
Use , the period of this tangent graph, to calculate b.
3
4
3
2
3
0
3
3
2
3
4 











2
3
1 
 b
a
An equation for this graph can be written as x
y
2
3
tan
1

or .
x
y
2
3
tan

Next 
Back
A complete period (including two consecutive vertical asymptotes) has
been highlighted on the cotangent graph below.
The distance between the asymptotes is .
Therefore, the period of this graph is also .
0

x 
 4
x

4
For all cotangent
graphs, the period is
equal to the
distance between
any two consecutive
vertical asymptotes.

4











 8
6
4
2
0
2
4
6
8
Next 
Back
.
4
1
4






period
b
We will let a = 1, but a
could be any positive
value since the graph
has not been reflected
about the x-axis.

4
Use , the period of this cotangent graph, to calculate b.
4
1
1 
 b
a
An equation for this graph can be written as
or .
x
y
4
1
cot
1












 8
6
4
2
0
2
4
6
8
x
y
4
1
cot


Graphs and properties of Tangent and Cotangent

  • 1.
    Next  Back Tangent andCotangent Graphs Reading and Drawing Tangent and Cotangent Graphs Some slides in this presentation contain animation. Slides will be more meaningful if you allow each slide to finish its presentation before moving to the next one.
  • 2.
    Next  Back This isthe graph for y = tan x. This is the graph for y = cot x.             2 2 3 2 0 2 2 3 2             2 2 3 2 0 2 2 3 2
  • 3.
    Next  Back One definitionfor tangent is . x cos x sin x tan  Notice that the denominator is cos x. This indicates a relationship between a tangent graph and a cosine graph.             2 2 3 2 0 2 2 3 2 This is the graph for y = cos x.
  • 4.
    Next  Back             2 2 3 2 0 2 2 3 2 Tosee how the cosine and tangent graphs are related, look at what happens when the graph for y = tan x is superimposed over y = cos x.
  • 5.
    Next  Back             2 2 3 2 0 2 2 3 2 Inthe diagram below, y = cos x is drawn in gray while y = tan x is drawn in black. Notice that the tangent graph has VERTICAL asymptotes (indicated by broken lines) everywhere the cosine graph touches the x-axis.
  • 6.
    Next  Back One definitionfor cotangent is . x sin x cos x cot  Notice that the denominator is sin x. This indicates a relationship between a cotangent graph and a sine graph. This is the graph for y = sin x.             2 2 3 2 0 2 2 3 2
  • 7.
    Next  Back To seehow the sine and cotangent graphs are related, look at what happens when the graph for y = cot x is superimposed over y = sin x.             2 2 3 2 0 2 2 3 2
  • 8.
    Next  Back             2 2 3 2 0 2 2 3 2 Inthe diagram below, y = sin x is drawn in gray while y = cot x is drawn in black. Notice that the cotangent graph has VERTICAL asymptotes (indicated by broken lines) everywhere the sine graph touches the x-axis.
  • 9.
    Next  Back y =tan x. y = cot x.             2 2 3 2 0 2 2 3 2             2 2 3 2 0 2 2 3 2 For tangent and cotangent graphs, the distance between any two consecutive vertical asymptotes represents one complete period.
  • 10.
    Next  Back y =tan x. y = cot x.             2 2 3 2 0 2 2 3 2             2 2 3 2 0 2 2 3 2 One complete period is highlighted on each of these graphs. For both y = tan x and y = cot x, the period is π. (From the beginning of a cycle to the end of that cycle, the distance along the x-axis is π.)
  • 11.
    Next  Back             2 2 3 2 0 2 2 3 2 Fory = tan x, there is no phase shift. The y-intercept is located at the point (0,0). We will call that point, the key point.
  • 12.
    Next  Back             2 2 3 2 0 2 2 3 2 Atangent graph has a phase shift if the key point is shifted to the left or to the right.
  • 13.
    Next  Back             2 2 3 2 0 2 2 3 2 Fory = cot x, there is no phase shift. Y = cot x has a vertical asymptote located along the y-axis. We will call that asymptote, the key asymptote.
  • 14.
    Next  Back             2 2 3 2 0 2 2 3 2 Acotangent graph has a phase shift if the key asymptote is shifted to the left or to the right.
  • 15.
    Next  Back y =a tan b (x - c). For a tangent graph which has no vertical shift, the equation for the graph can be written as For a cotangent graph which has no vertical shift, the equation for the graph can be written as y = a cot b (x - c). c indicates the phase shift, also known as the horizontal shift. a indicates whether the graph reflects about the x-axis. b affects the period.
  • 16.
    Next  Back y =a tan b (x - c) y = a cot b (x - c) Unlike sine or cosine graphs, tangent and cotangent graphs have no maximum or minimum values. Their range is (-∞, ∞), so amplitude is not defined. However, it is important to determine whether a is positive or negative. When a is negative, the tangent or cotangent graph will “flip” or reflect about the x-axis.
  • 17.
    Next  Back             2 2 3 2 0 2 2 3 2 Noticethe behavior of y = tan x. Notice what happens to each section of the graph as it nears its asymptotes. As each section nears the asymptote on its left, the y-values approach - ∞. As each section nears the asymptote on its right, the y-values approach + ∞.
  • 18.
    Next  Back Notice whathappens to each section of the graph as it nears its asymptotes. As each section nears the asymptote on its left, the y-values approach + ∞. As each section nears the asymptote on its right, the y-values approach - ∞.             2 2 3 2 0 2 2 3 2 Notice the behavior of y = cot x.
  • 19.
    Next  Back This isthe graph for y = tan x.             2 2 3 2 0 2 2 3 2 y = - tan x Consider the graph for y = - tan x In this equation a, the numerical coefficient for the tangent, is equal to -1. The fact that a is negative causes the graph to “flip” or reflect about the x-axis.
  • 20.
    Next  Back This isthe graph for y = cot x.             2 2 3 2 0 2 2 3 2 y = - 2cot x Consider the graph for y = - 2 cot x In this equation a, the numerical coefficient for the cotangent, is equal to -2. The fact that a is negative causes the graph to “flip” or reflect about the x-axis.
  • 21.
    Next  Back y =a tan b (x - c) y = a cot b (x - c) b affects the period of the tangent or cotangent graph. For tangent and cotangent graphs, the period can be determined by . b period   Conversely, when you already know the period of a tangent or cotangent graph, b can be determined by . period b  
  • 22.
    Next  Back A completeperiod (including two consecutive vertical asymptotes) has been highlighted on the tangent graph below. The distance between the asymptotes in this graph is . Therefore, the period of this graph is also . 3 x    3 x   3 2 3 4 3 2 3 0 3 3 2 3 4             For all tangent graphs, the period is equal to the distance between any two consecutive vertical asymptotes. 3 2
  • 23.
    Next  Back . 2 3 3 2       period b We willlet a = 1, but a could be any positive value since the graph has not been reflected about the x-axis. 3 2 Use , the period of this tangent graph, to calculate b. 3 4 3 2 3 0 3 3 2 3 4             2 3 1   b a An equation for this graph can be written as x y 2 3 tan 1  or . x y 2 3 tan 
  • 24.
    Next  Back A completeperiod (including two consecutive vertical asymptotes) has been highlighted on the cotangent graph below. The distance between the asymptotes is . Therefore, the period of this graph is also . 0  x   4 x  4 For all cotangent graphs, the period is equal to the distance between any two consecutive vertical asymptotes.  4             8 6 4 2 0 2 4 6 8
  • 25.
    Next  Back . 4 1 4       period b We willlet a = 1, but a could be any positive value since the graph has not been reflected about the x-axis.  4 Use , the period of this cotangent graph, to calculate b. 4 1 1   b a An equation for this graph can be written as or . x y 4 1 cot 1              8 6 4 2 0 2 4 6 8 x y 4 1 cot 