Download as PDF, PPTX
![Function plugins
| 14
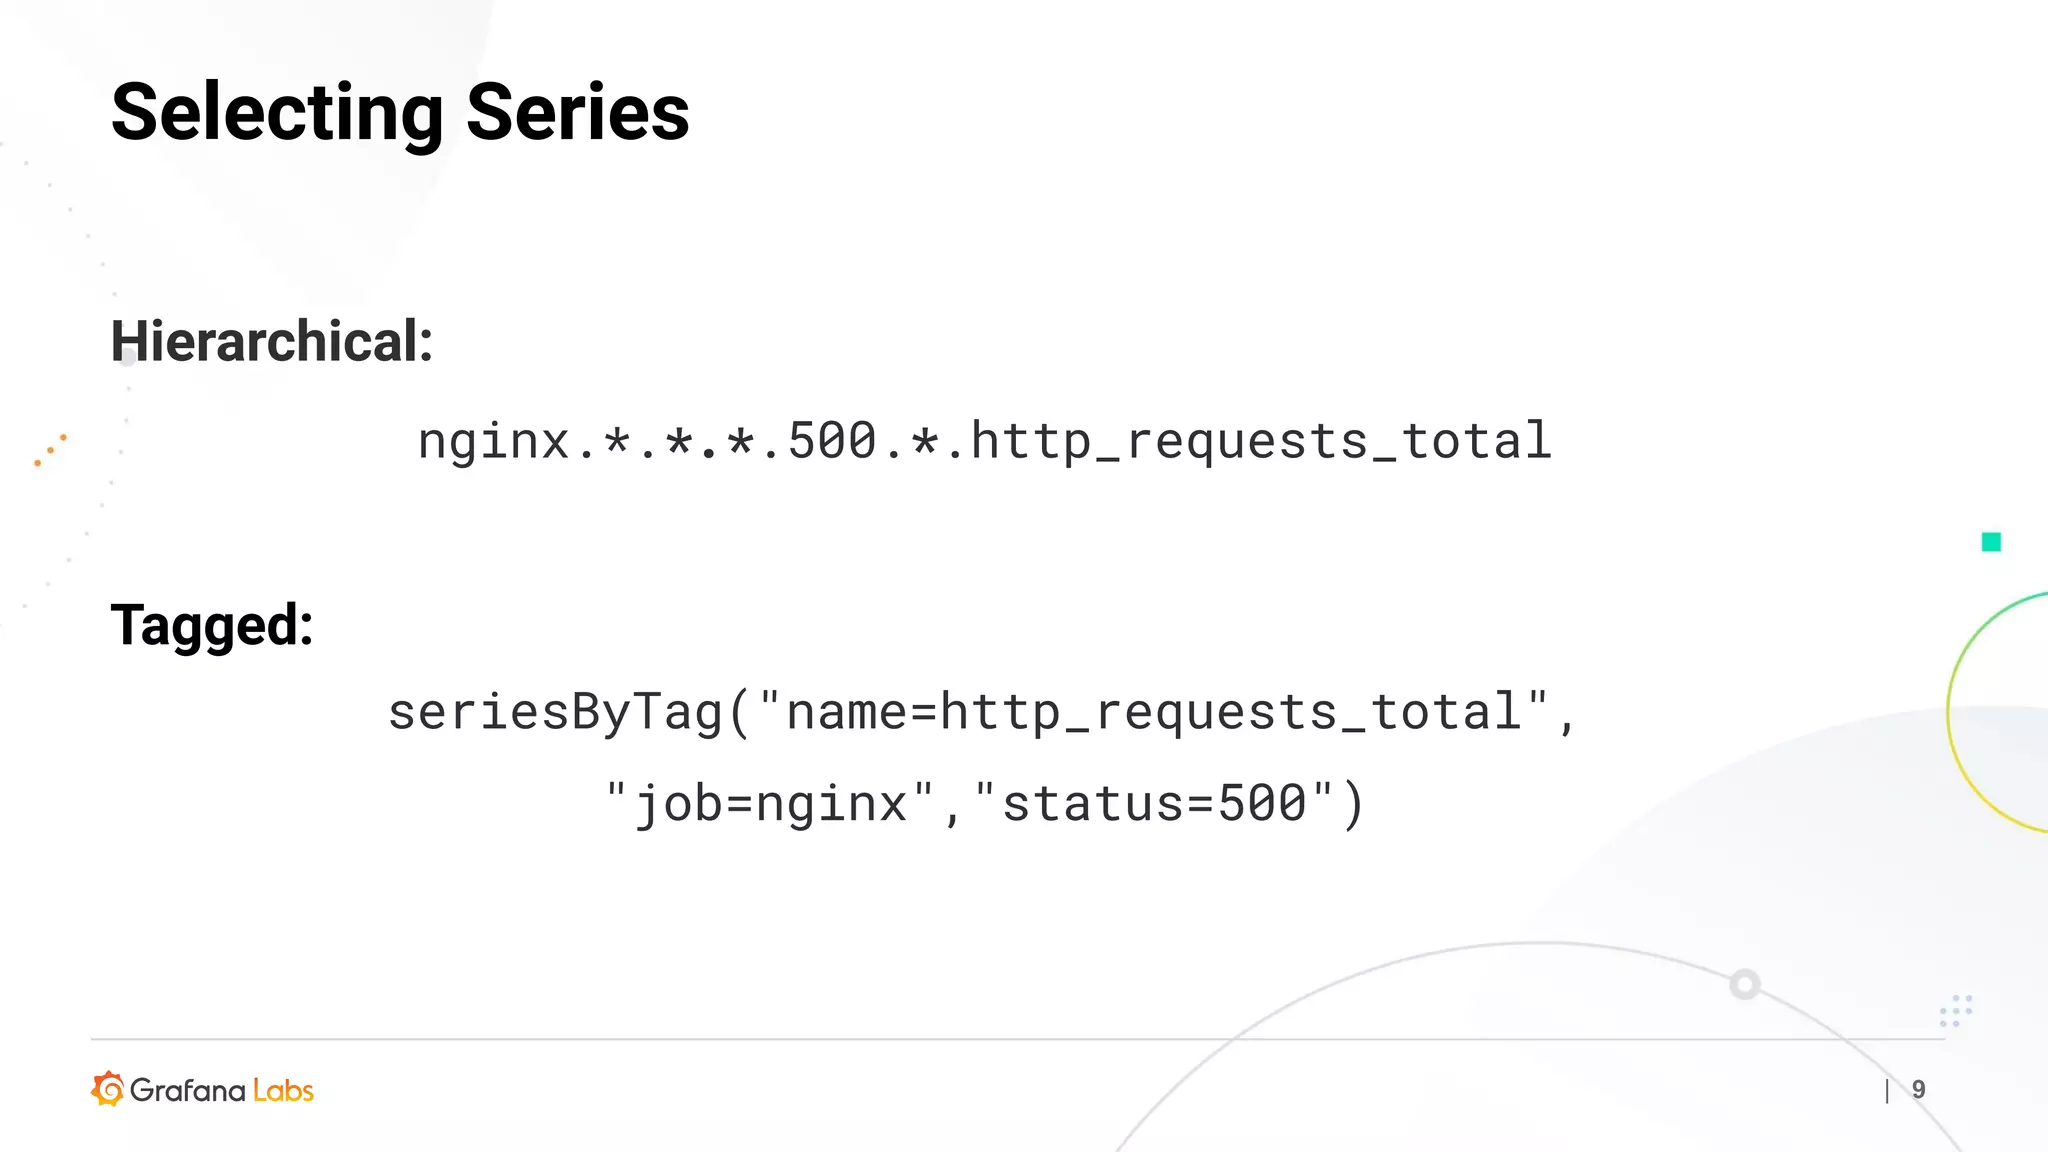
Example:
from graphite.functions.params import Param, ParamTypes
def toUpperCase(requestContext, seriesList):
"""Custom function that changes series names to UPPERCASE"""
for series in seriesList:
series.name = series.name.upper()
return seriesList
toUpperCase.group = 'Custom'
toUpperCase.params = [
Param('seriesList', ParamTypes.seriesList, required=True),
]
SeriesFunctions = {
'upper': toUpperCase,
}](https://image.slidesharecdn.com/presentationgraphite-metrictanktelaviv-200317154801/75/Graphite-Metrictank-Meetup-Tel-Aviv-Yafo-14-2048.jpg)

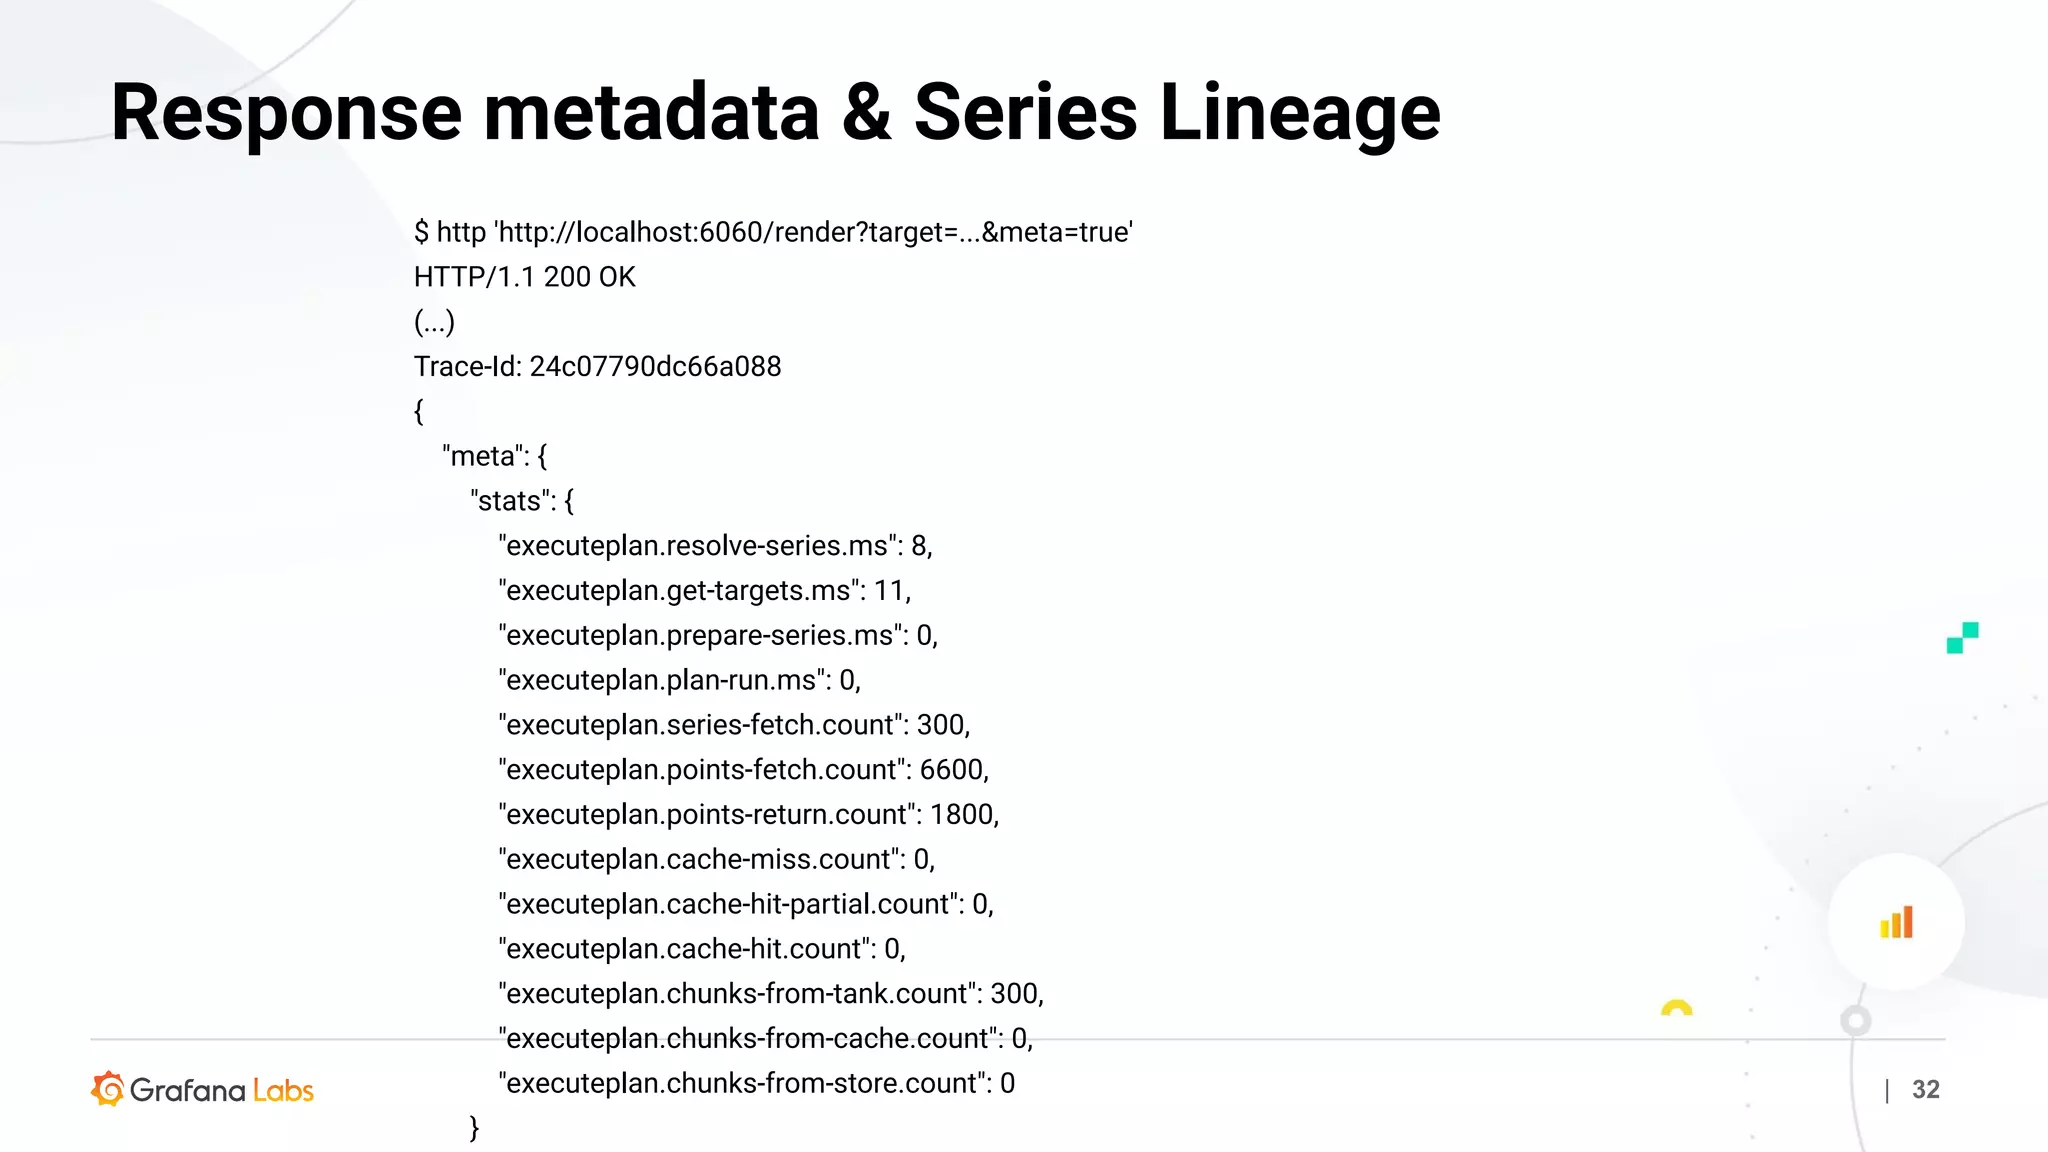
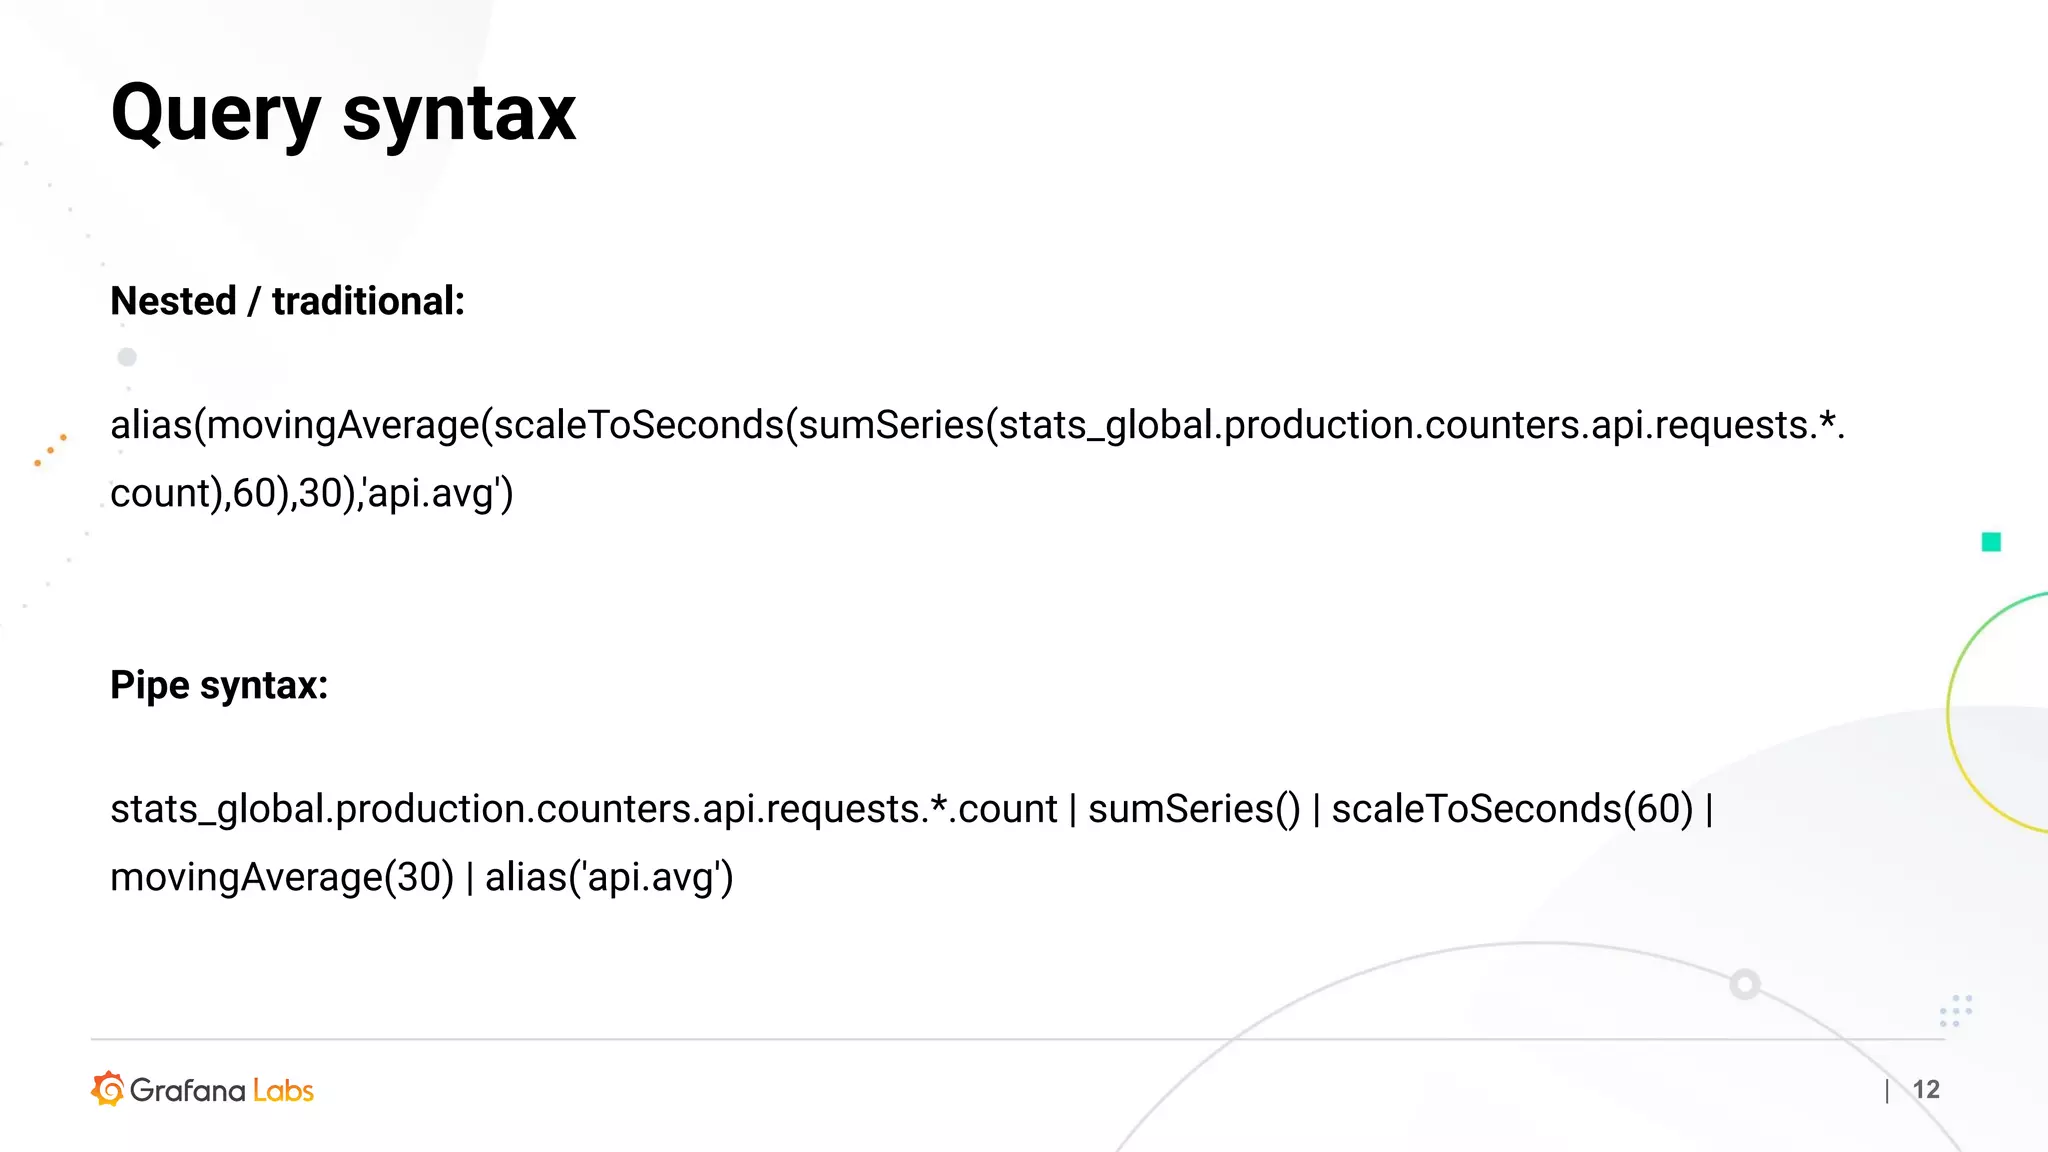
![| 33
Response metadata & Series Lineage
"series": [
{
"target": "sumSeries(some.id.of.a.metric.*)",
"datapoints": [[123456, 1234567890], [123, 1234567895], … ],
"meta": [
{
"schema-name": "default-1",
"schema-retentions": "1s:6h:2min:2,1min:35d:6h:1",
"archive-read": 0,
"archive-interval": 5,
"aggnum-norm": 1,
"consolidate-normfetch": "AverageConsolidator",
"aggnum-rc": 0,
"consolidate-rc": "NoneConsolidator",
"count": 20
},](https://image.slidesharecdn.com/presentationgraphite-metrictanktelaviv-200317154801/75/Graphite-Metrictank-Meetup-Tel-Aviv-Yafo-33-2048.jpg)

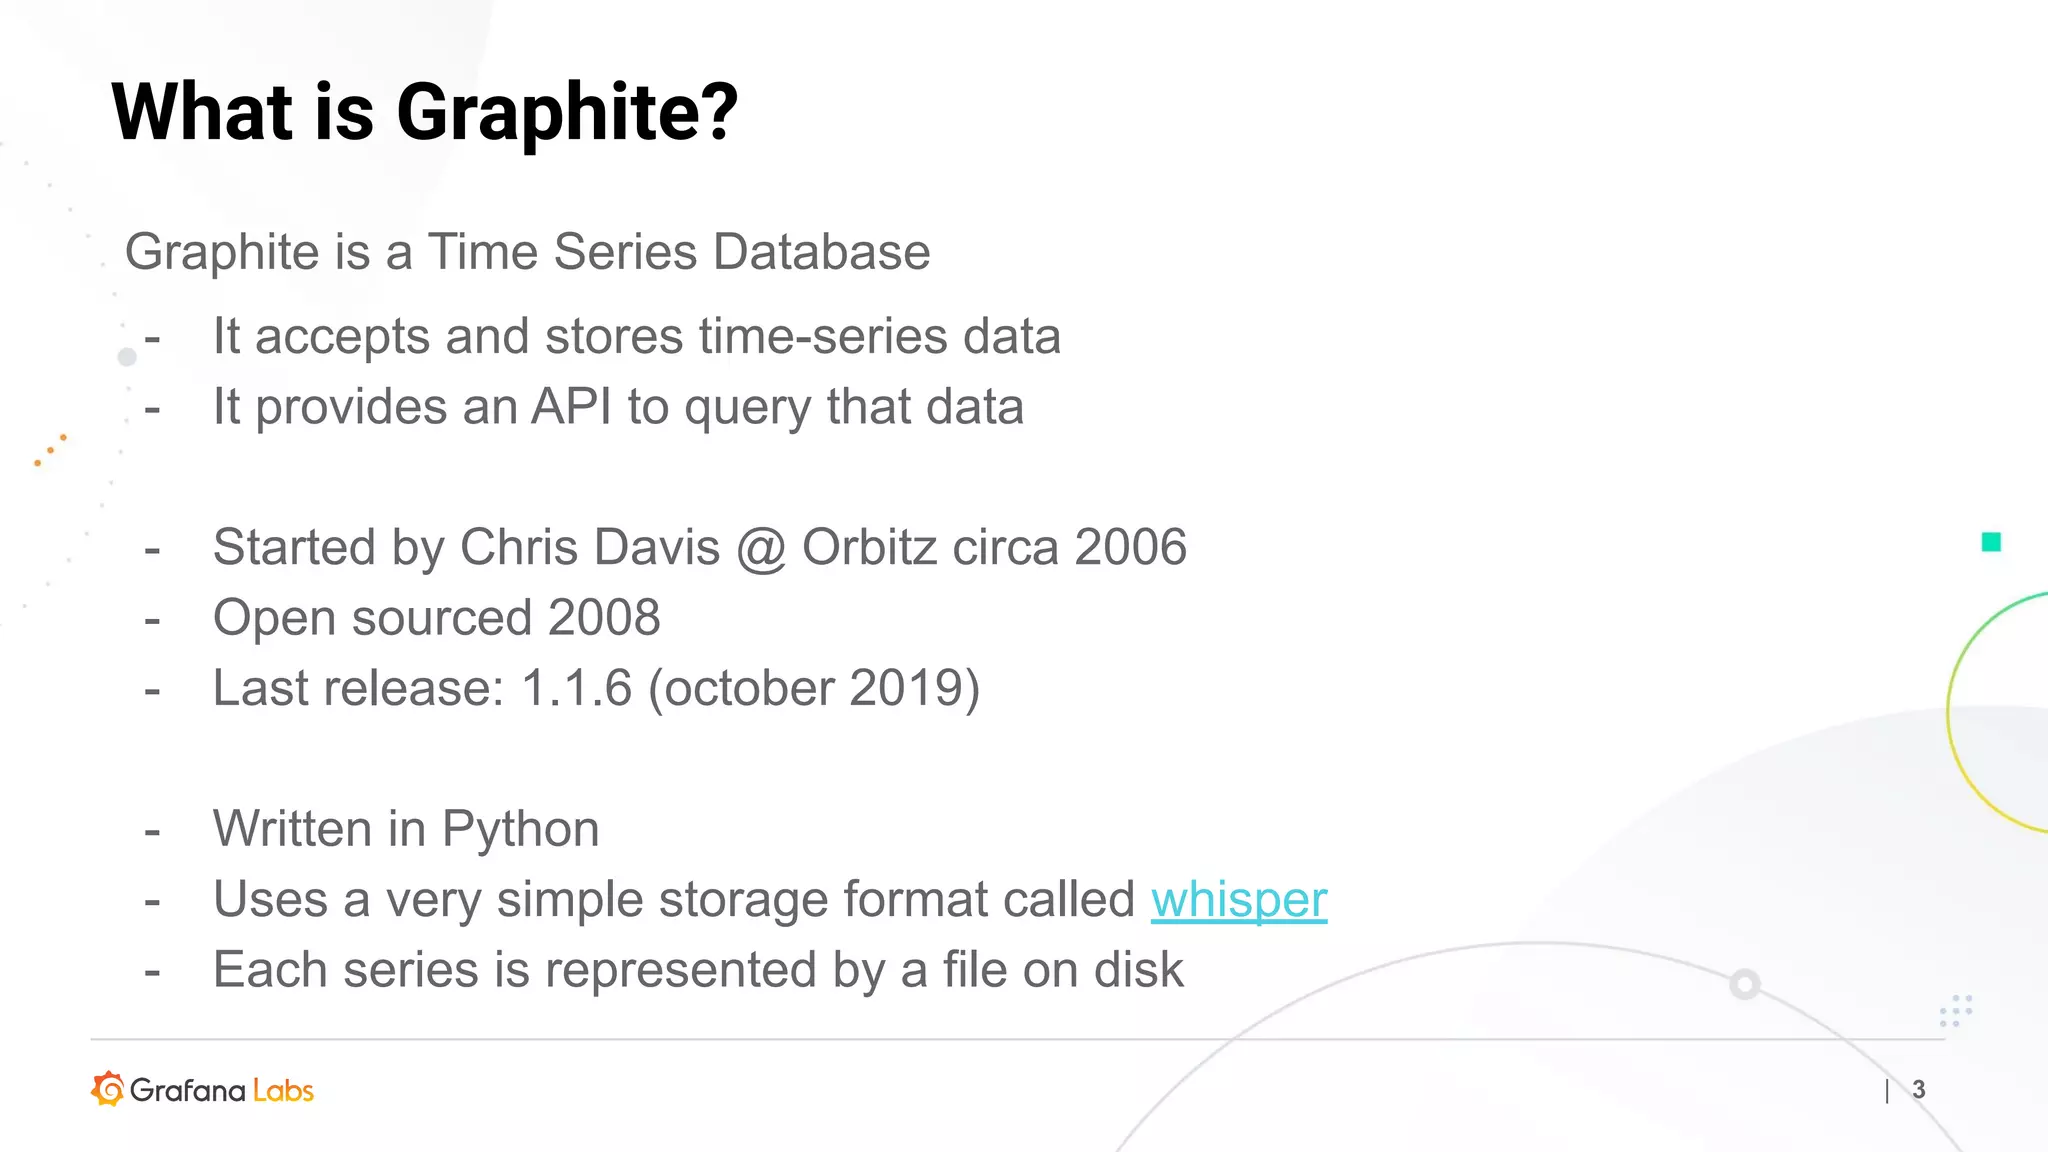
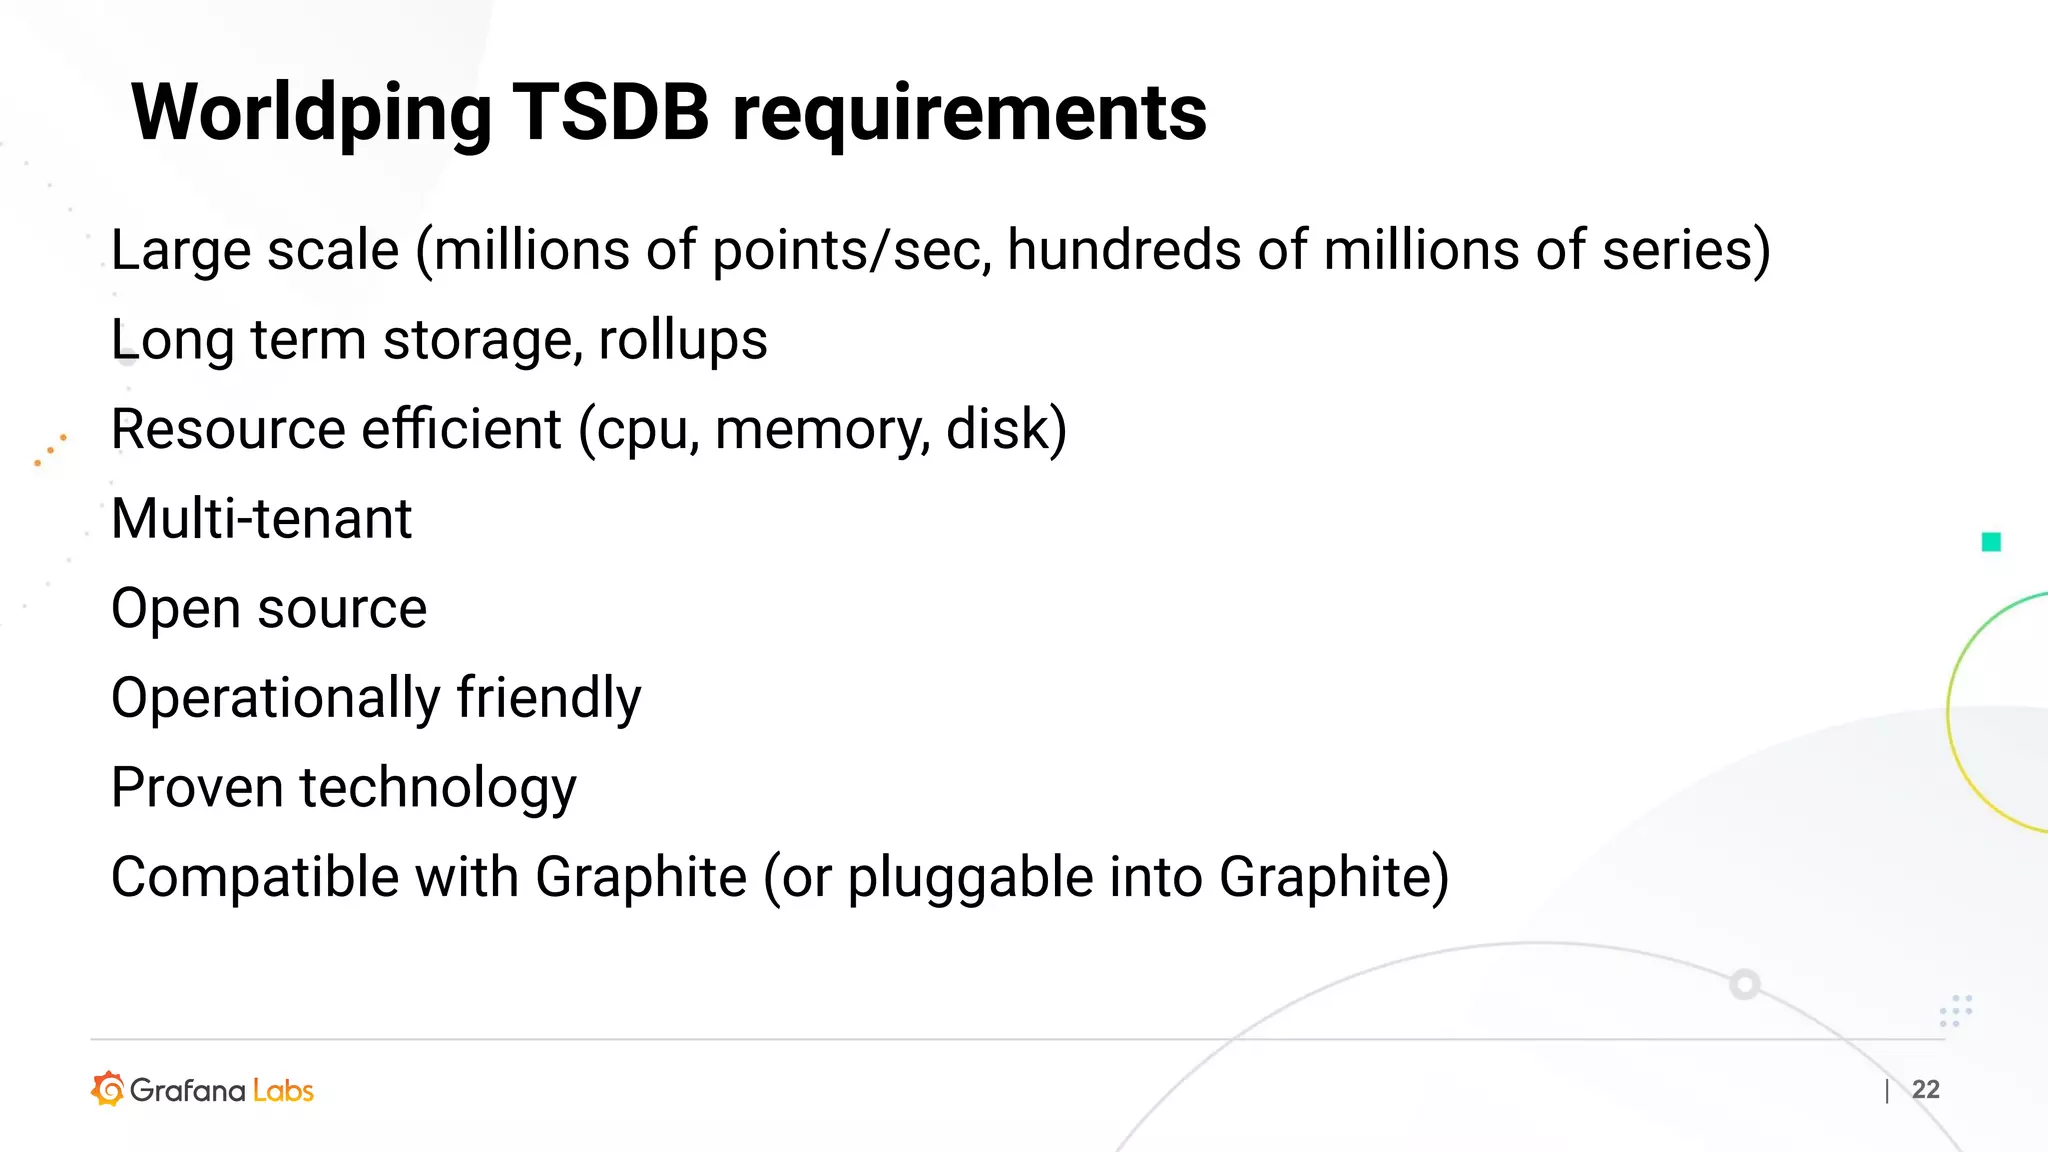
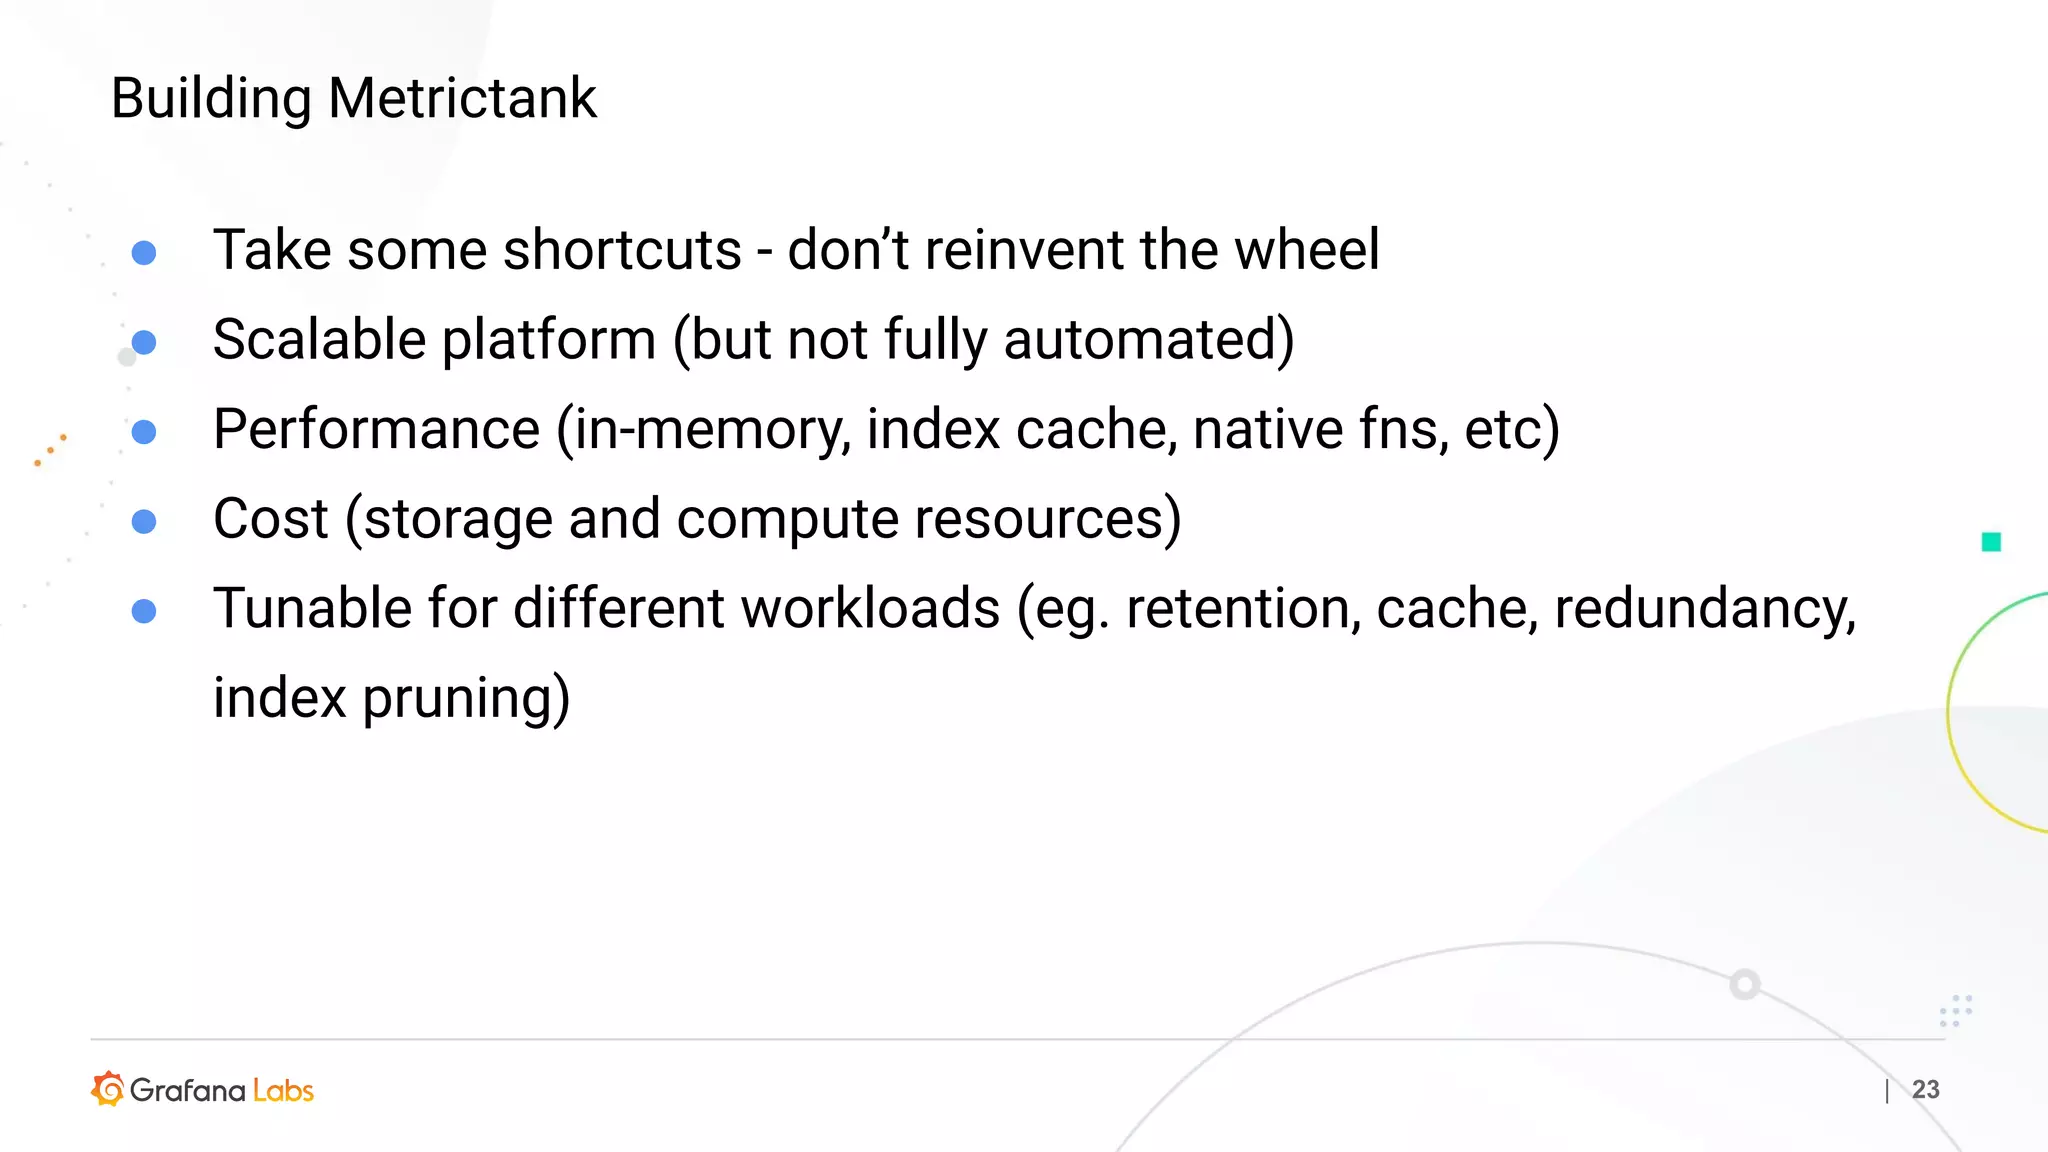
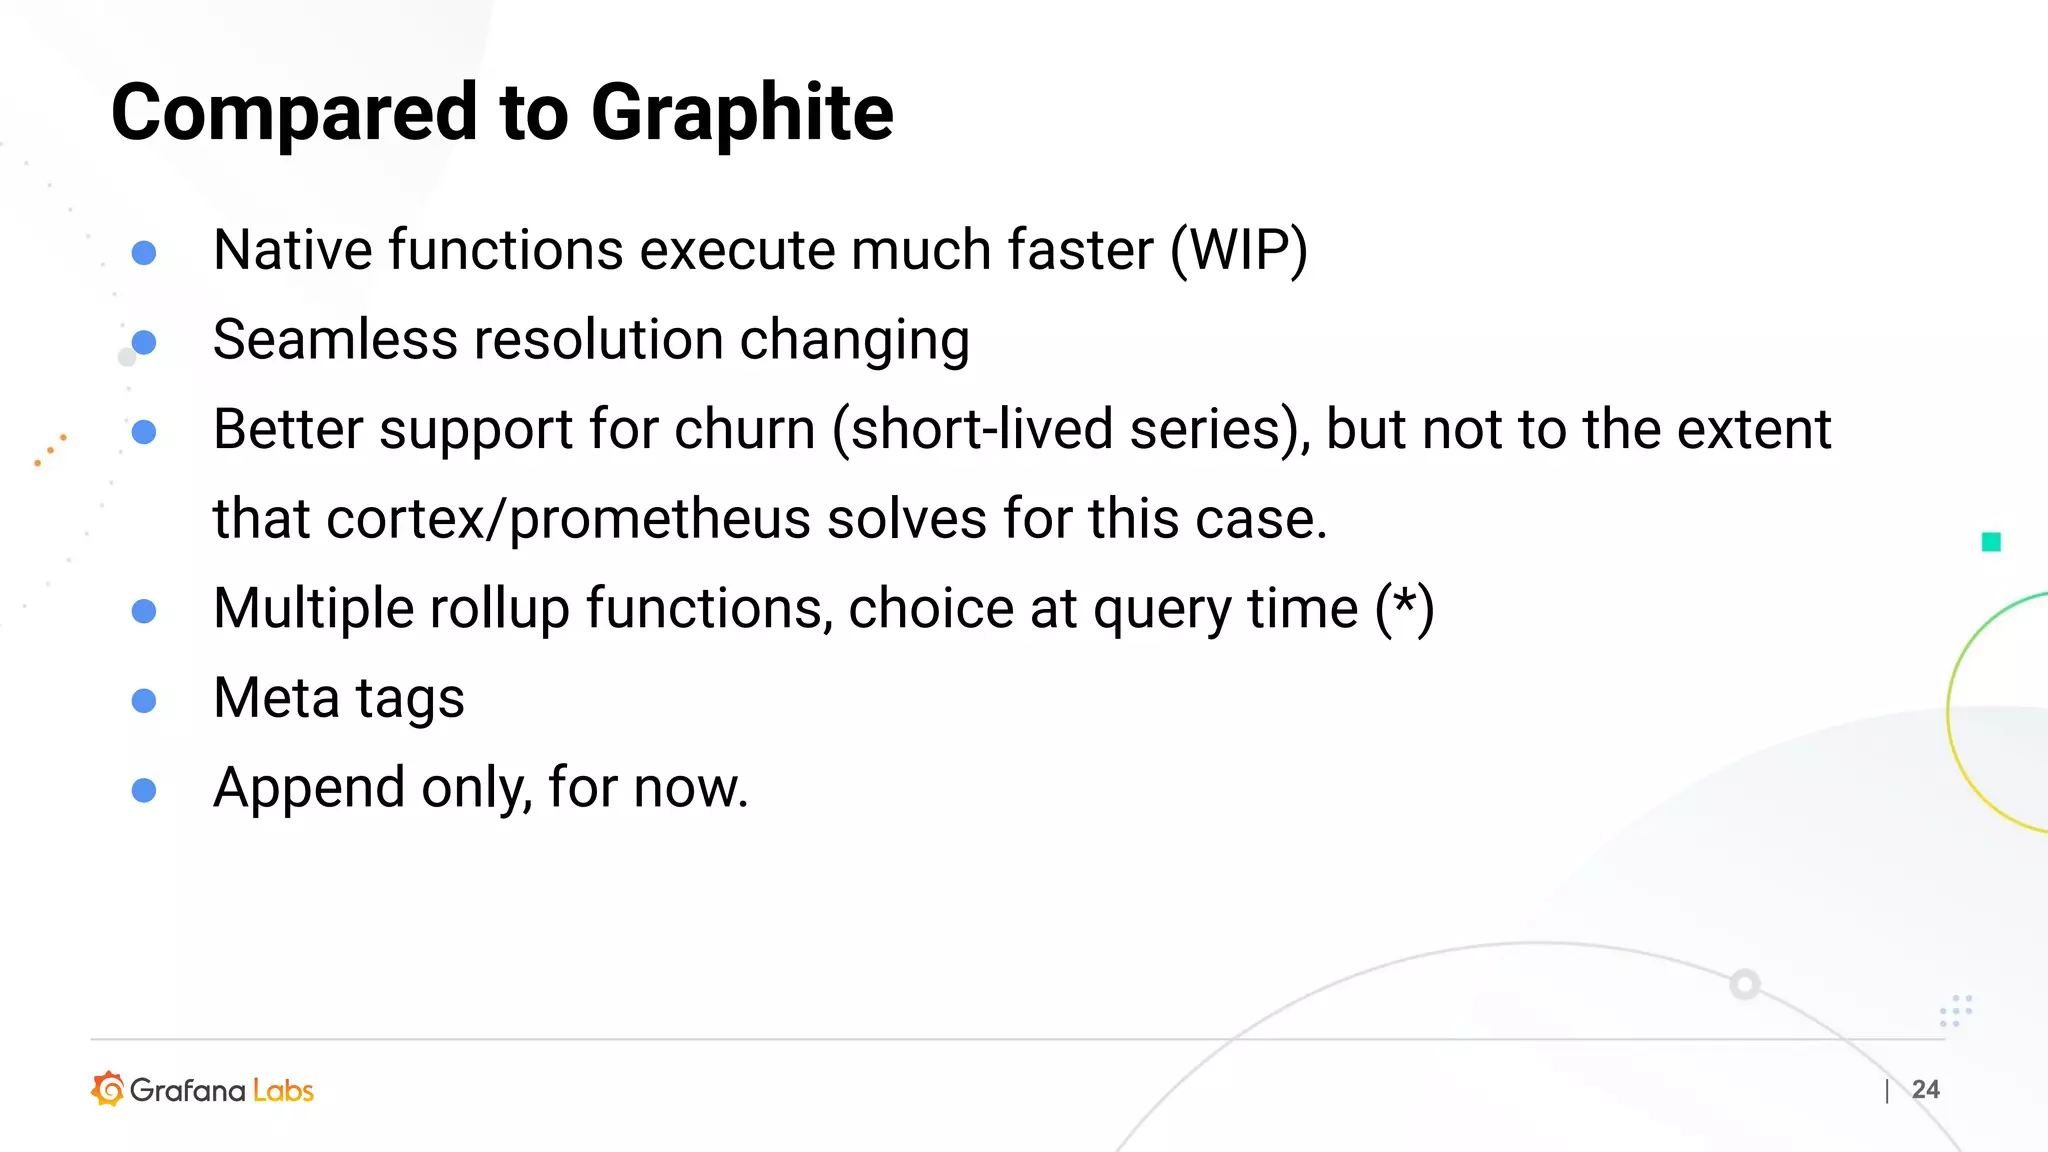
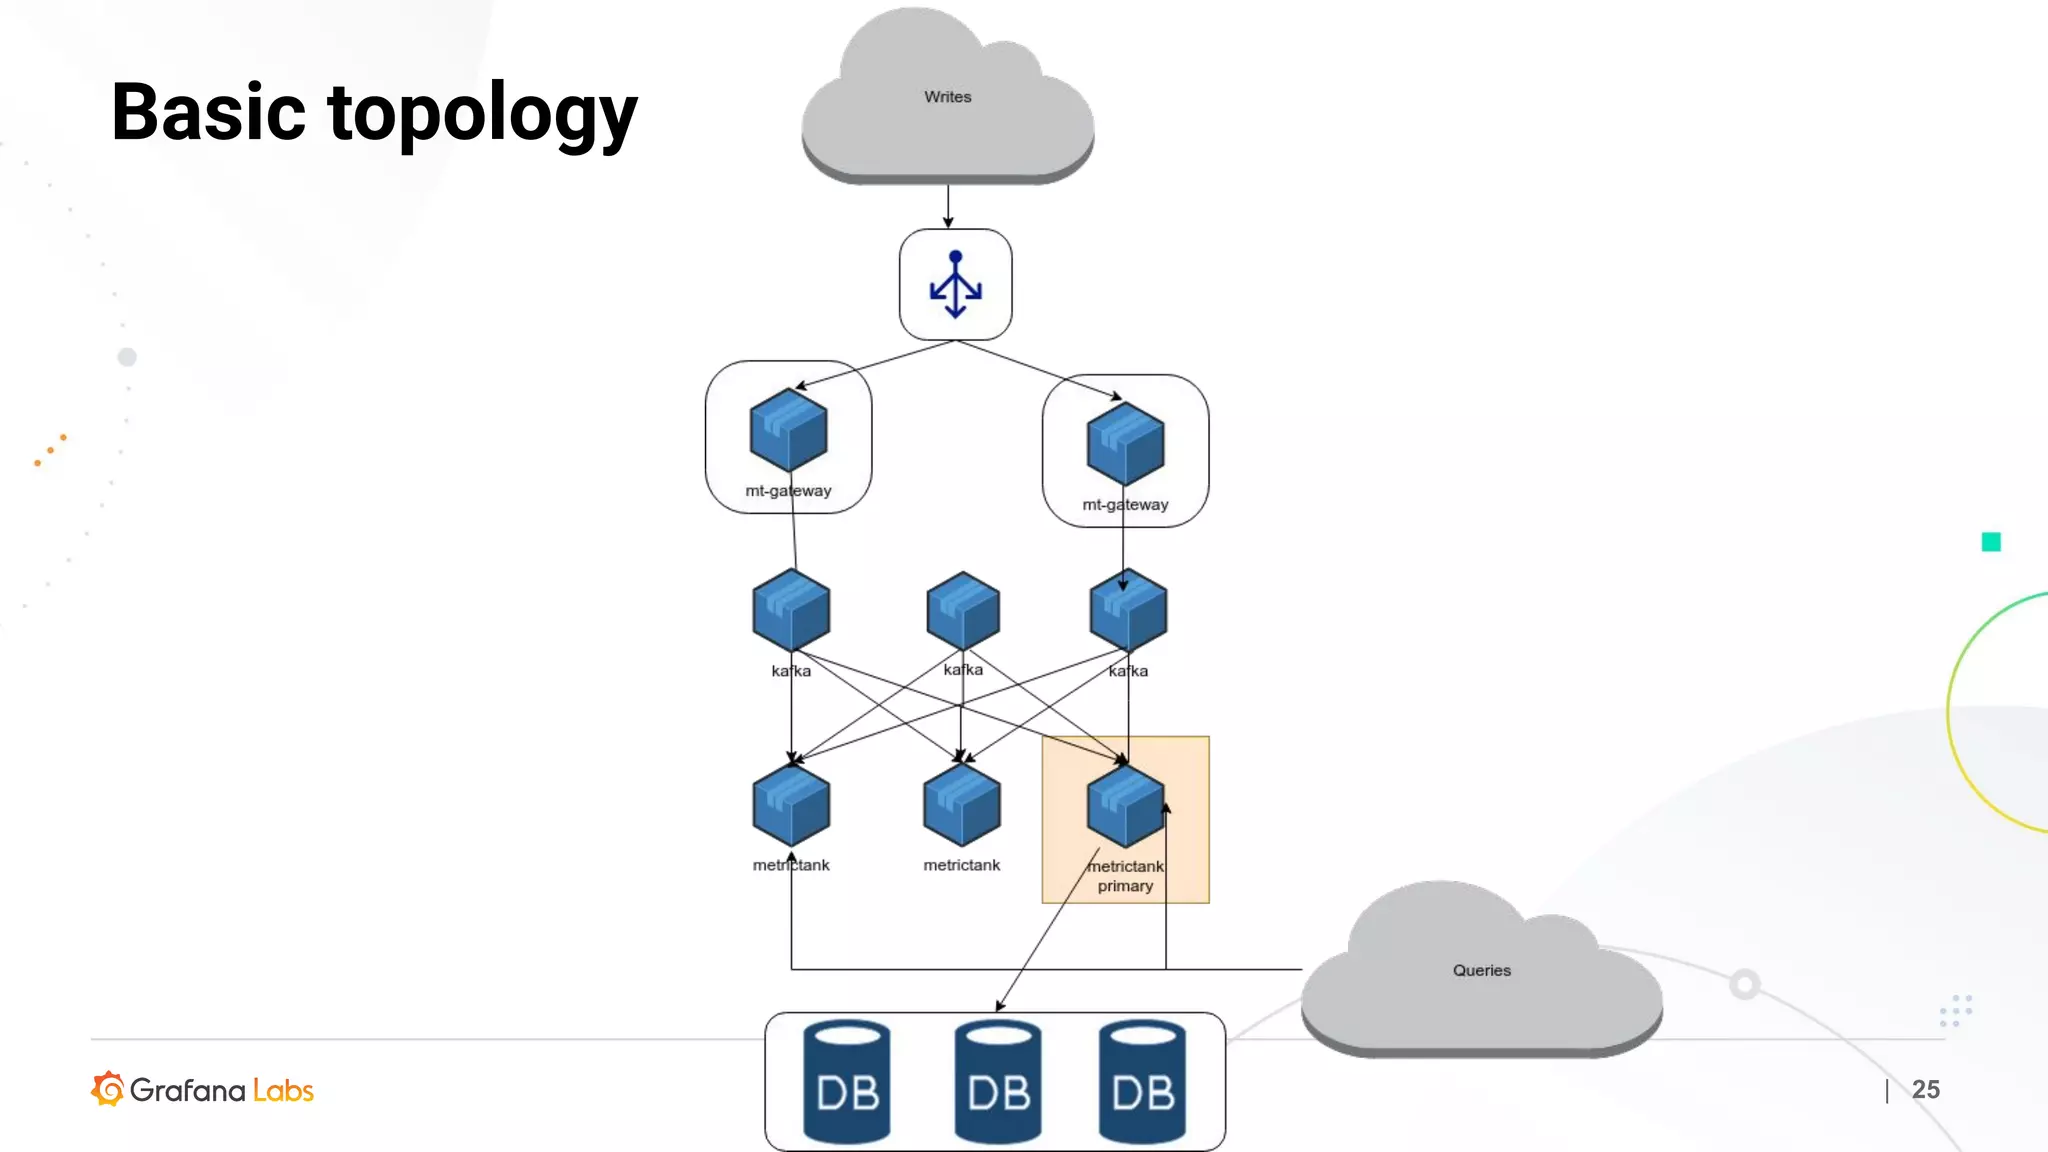
Graphite is a time series database that stores metric data in a simple format on disk. It uses a hierarchical naming scheme or tagging to organize metrics. Graphite accepts incoming metric data and provides an API to query the stored time series data. While powerful, it does not handle high-volume or high-churn data well. Metrictank is an alternative time series database that is more scalable and resource-efficient for storing and querying large volumes of metrics data over long periods of time.