Download as PDF, PPTX

![Auto Tune (Work in Progress)
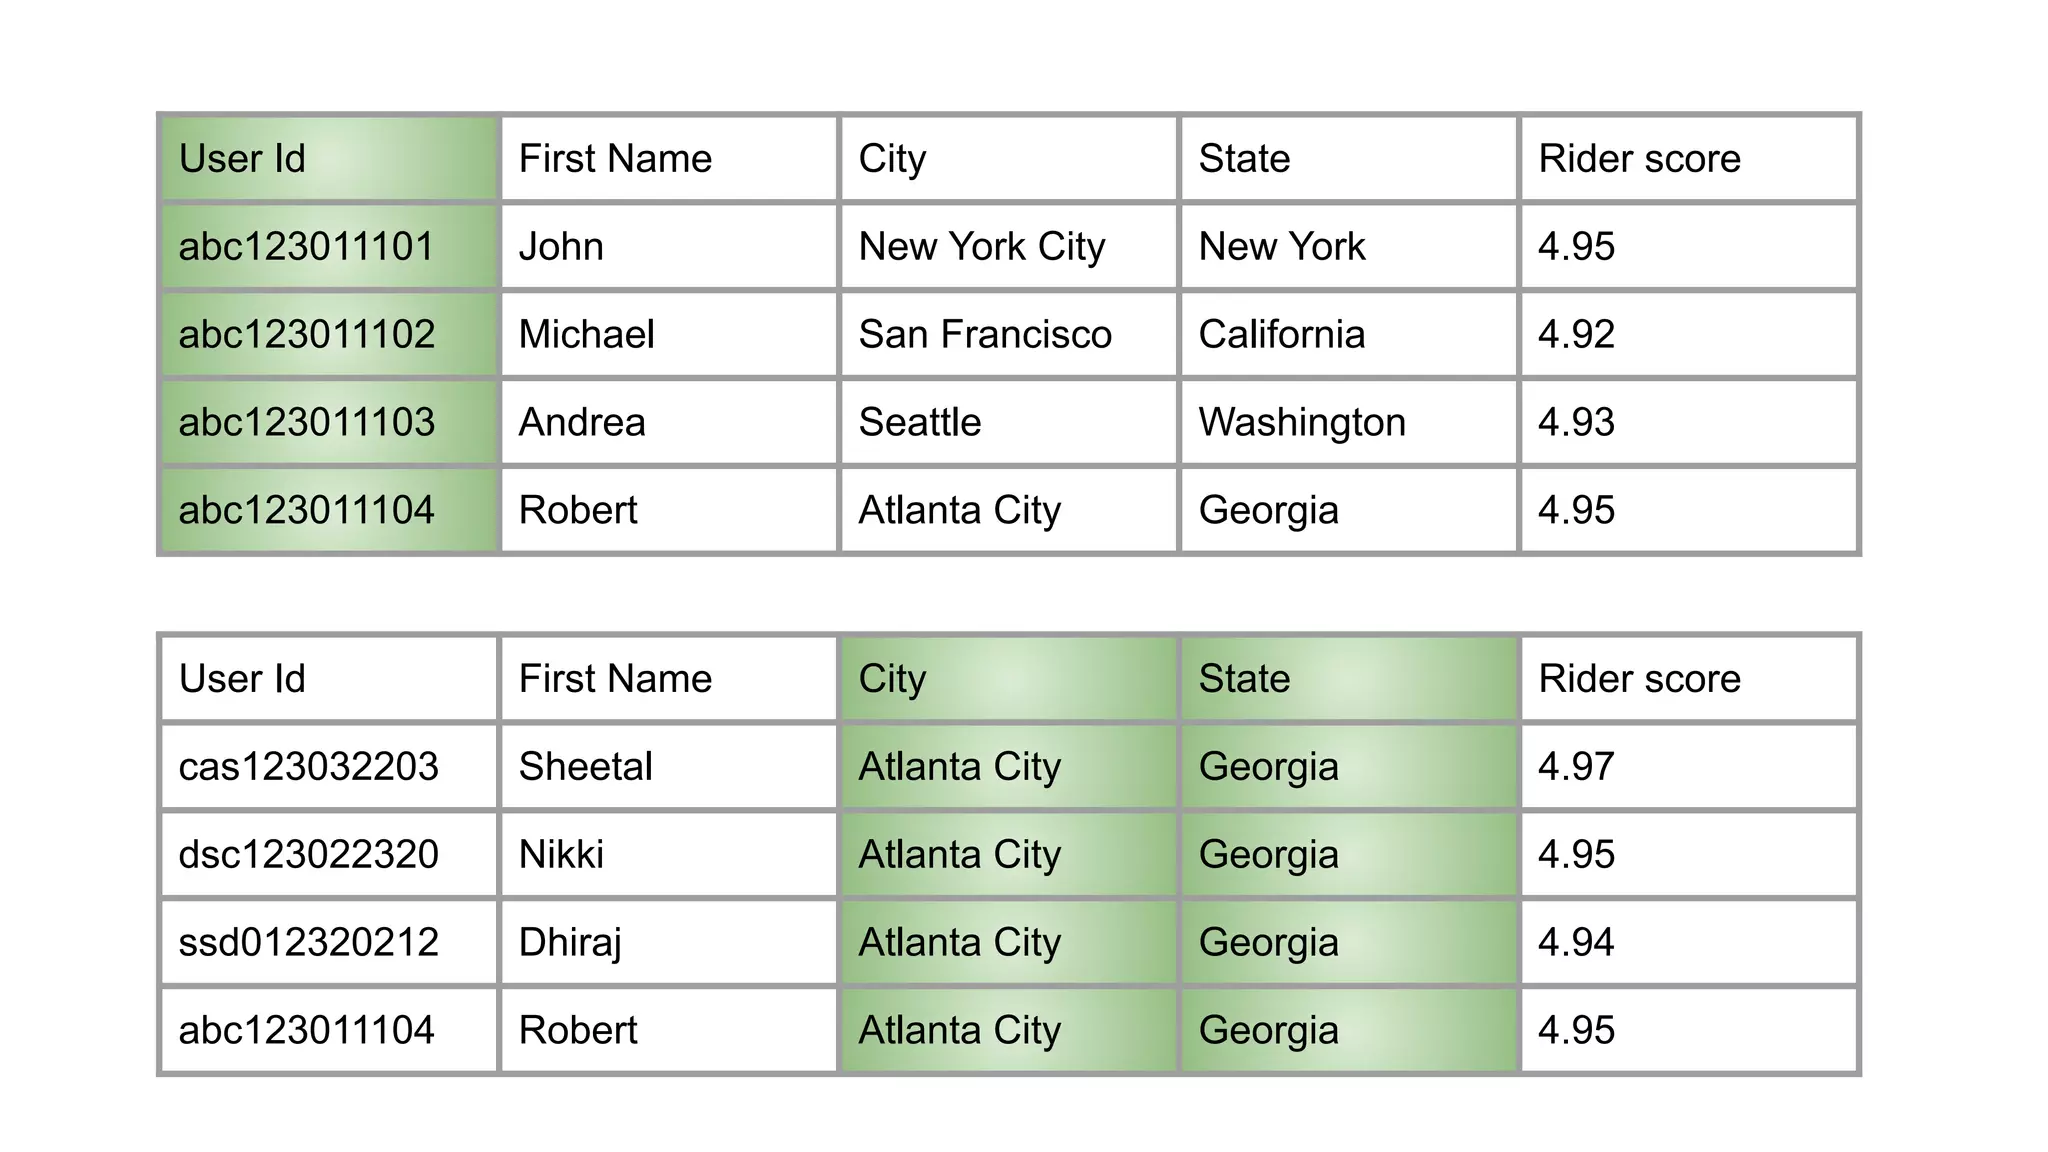
● Problem: data scientist using team level Spark conf template
● Known Daily Applications
○ Use historical run to set Spark configurations (memory, vcore, etc.) *
● Ad-hoc Repeated (Daily) Applications
○ Use Machine Learning to predict resource usage
○ Challenge: Feature Engineering
■ Execution Plan
Project [user_id, product_id, price]
Filter (date = 2019-01-31 and product_id = xyz)
UnresolvedRelation datalake.user_purchase
* Done by our colleague Abhishek Modi](https://image.slidesharecdn.com/bigdataanalyticspresentation-191115041715/75/SF-Big-Analytics-20191112-How-to-performance-tune-Spark-applications-in-large-clusters-11-2048.jpg)


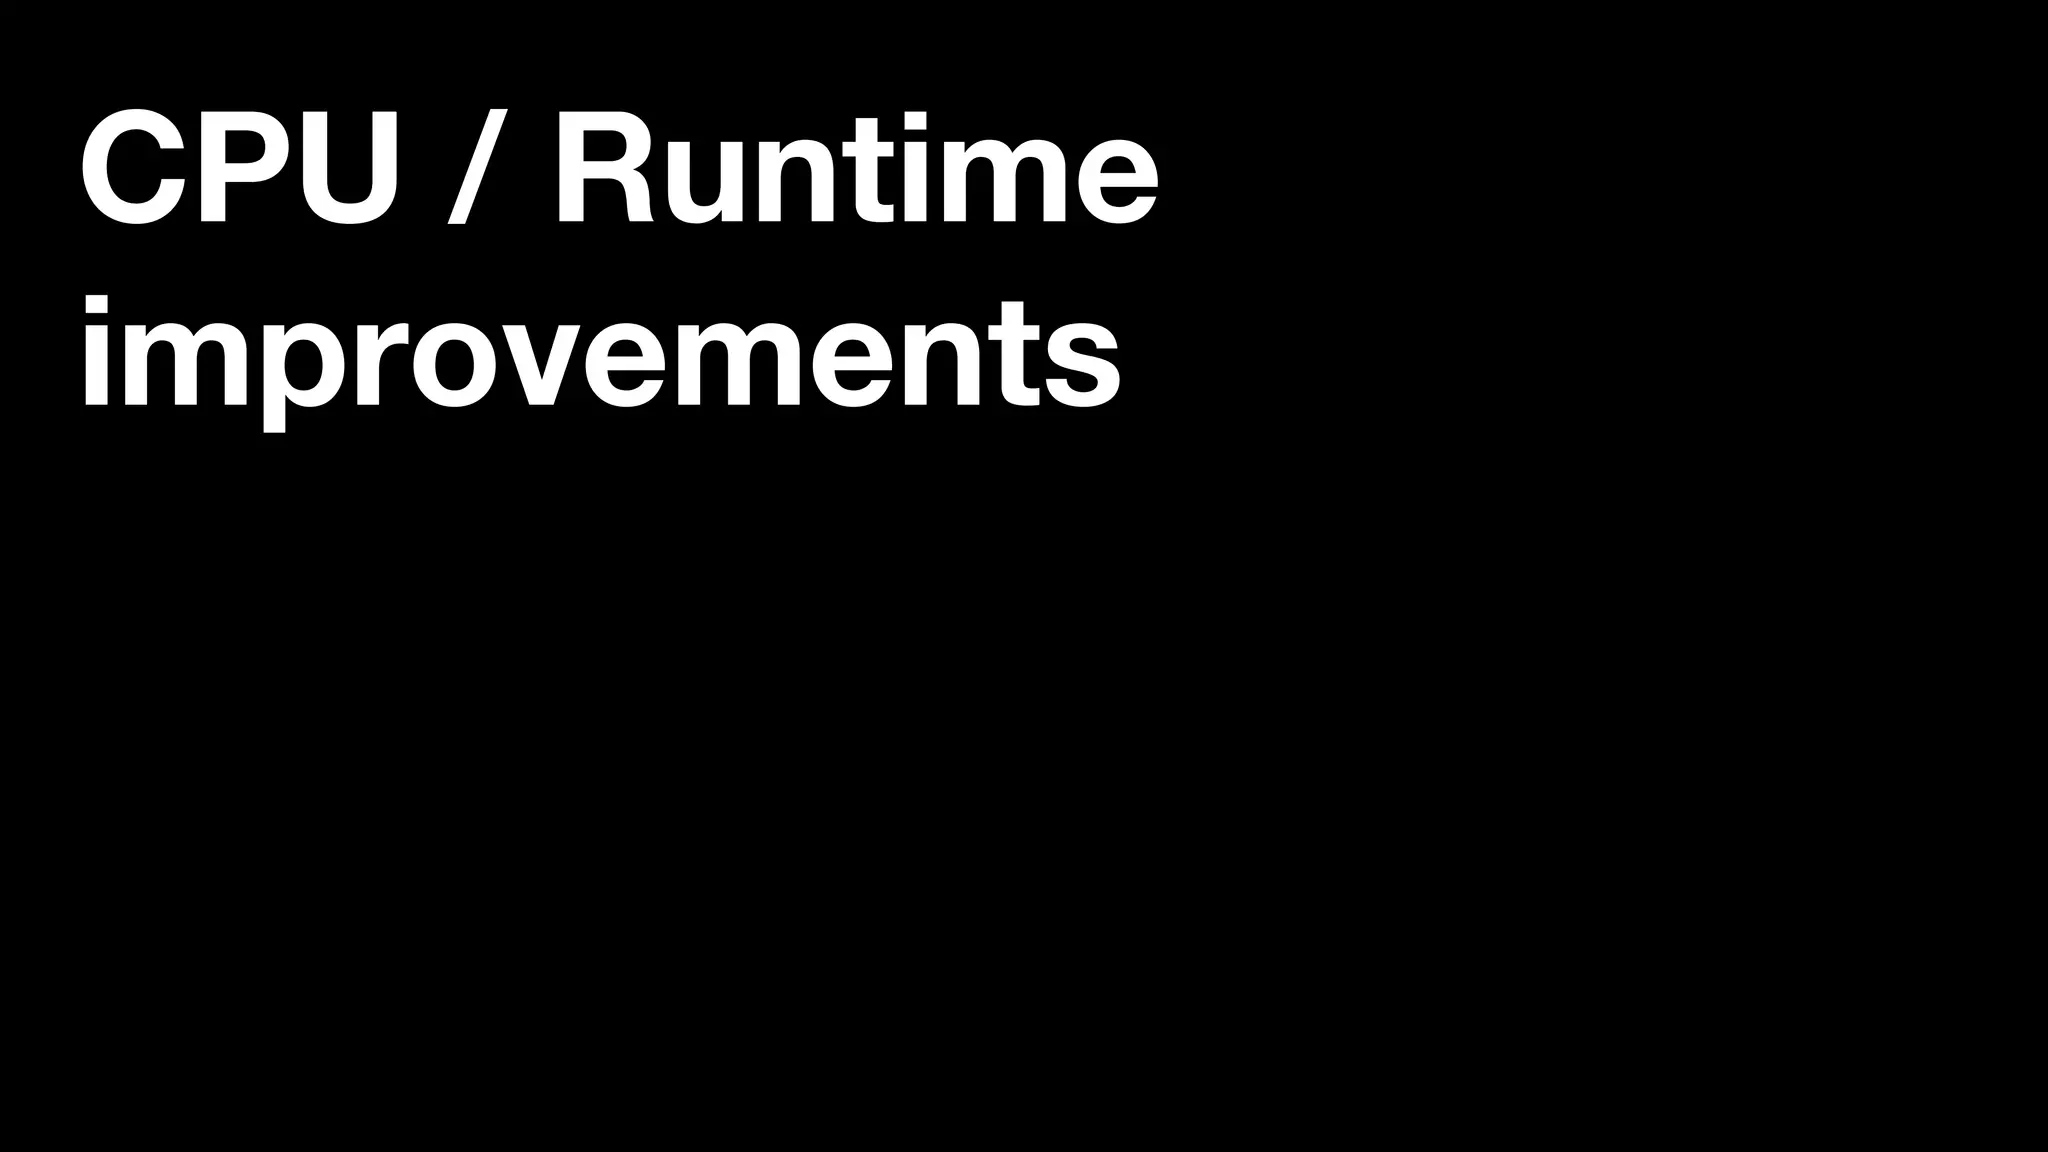
![Reduce ser/deser time by restructuring payload
1. @AllArgsConstructor
2. @Getter
3. private class SparkPayload {
4. private final String sortingKey;
5. // Map with 1000+ entries.
6. private final Map<String, GenericRecord>
data;
7. }
8.
1. @Getter
2. private class SparkPayload {
3. private final String sortingKey;
4. // Map with 1000+ entries.
5. private final byte[] serializedData;
6.
7. public SparkPayload(final String sortingKey,
Map<String, GenericRecord> data) {
8. this.sortingKey = sortingKey;
9. this.serializedData =
KryoSerializer.serialize(data);
10. }
11.
12. public Map<String, GenericRecord> getData() {
13. return
KryoSerializer.deserialize(this.serializedData,
Map.class);
14. }
15. }](https://image.slidesharecdn.com/bigdataanalyticspresentation-191115041715/75/SF-Big-Analytics-20191112-How-to-performance-tune-Spark-applications-in-large-clusters-24-2048.jpg)


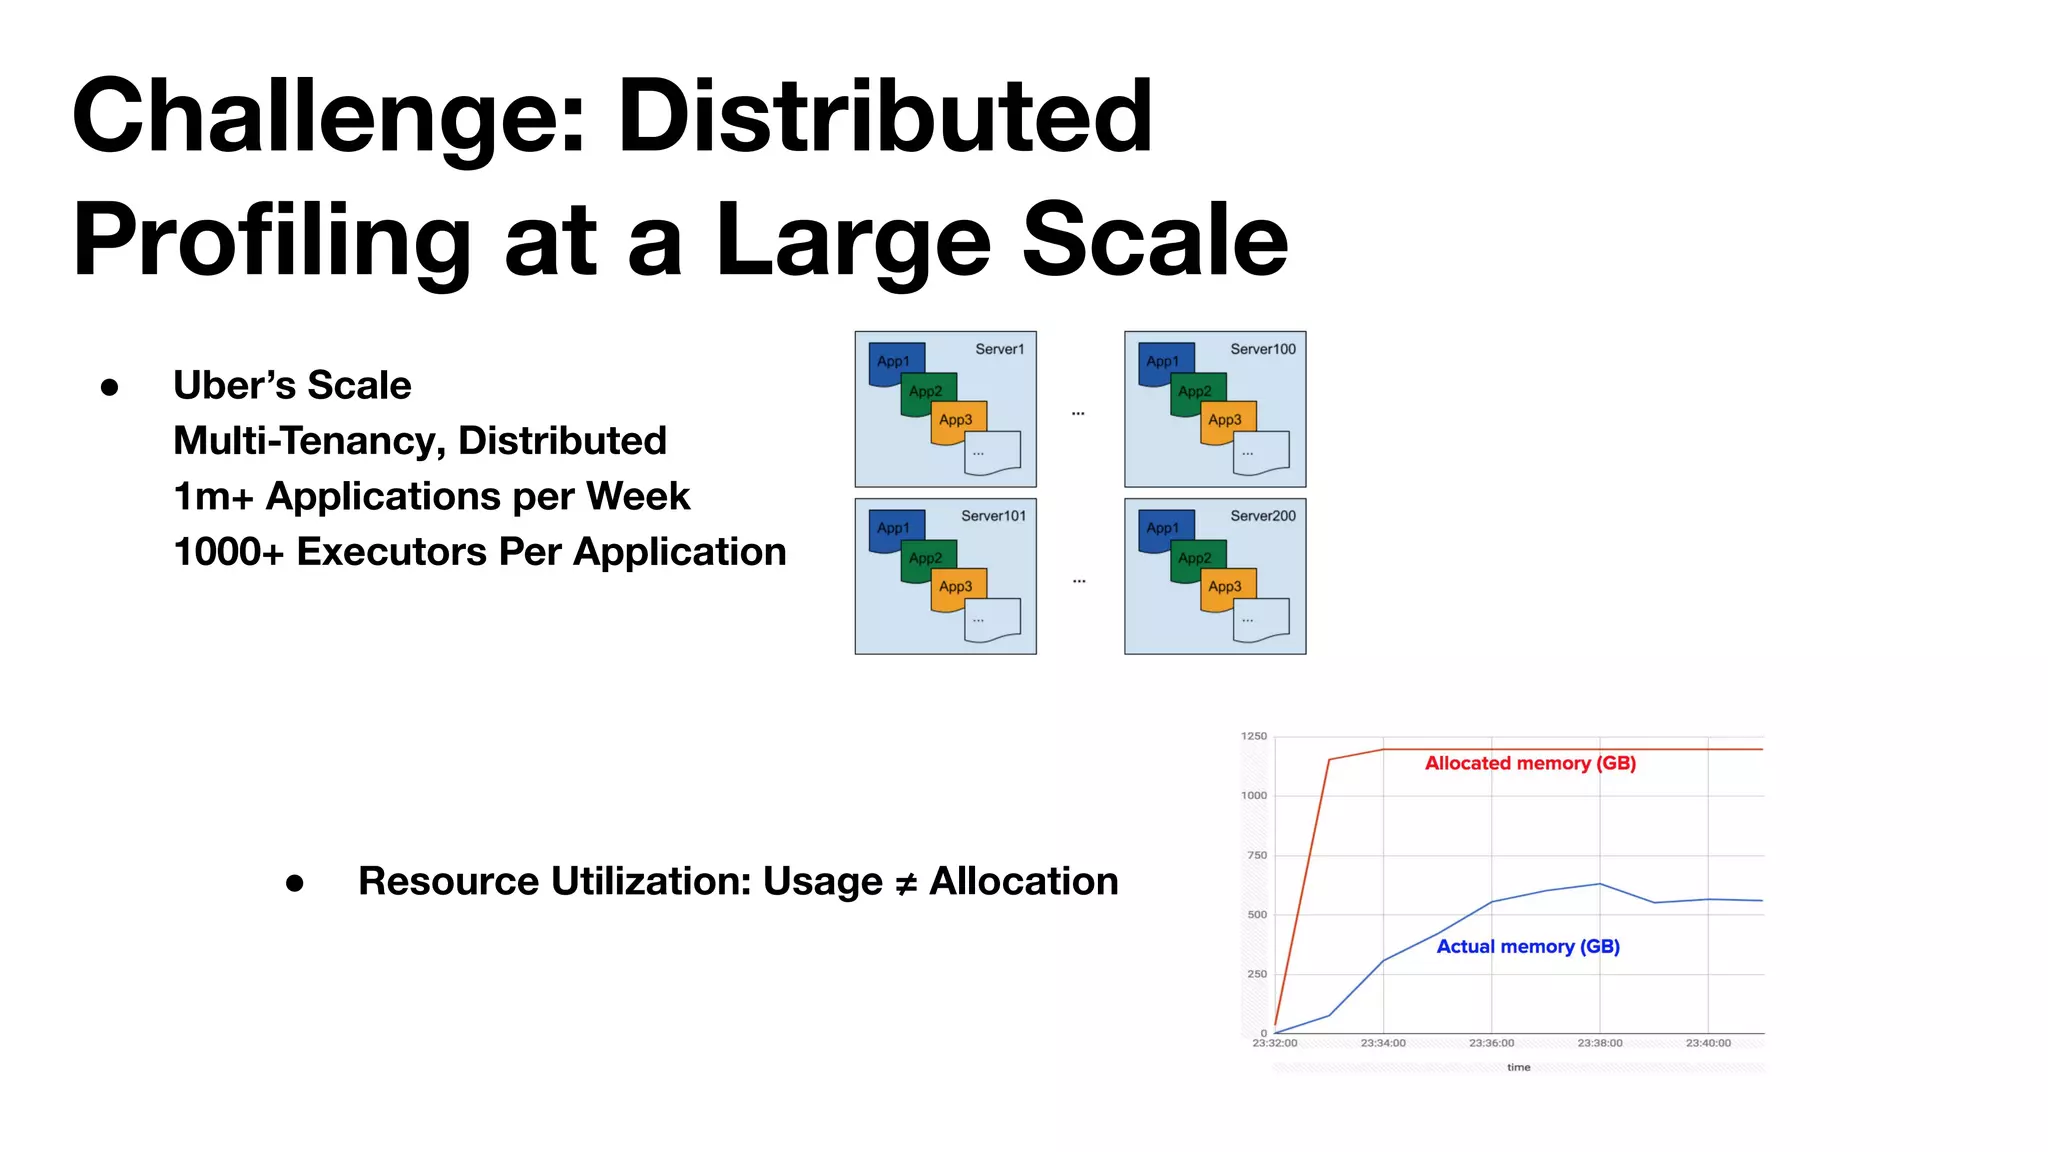
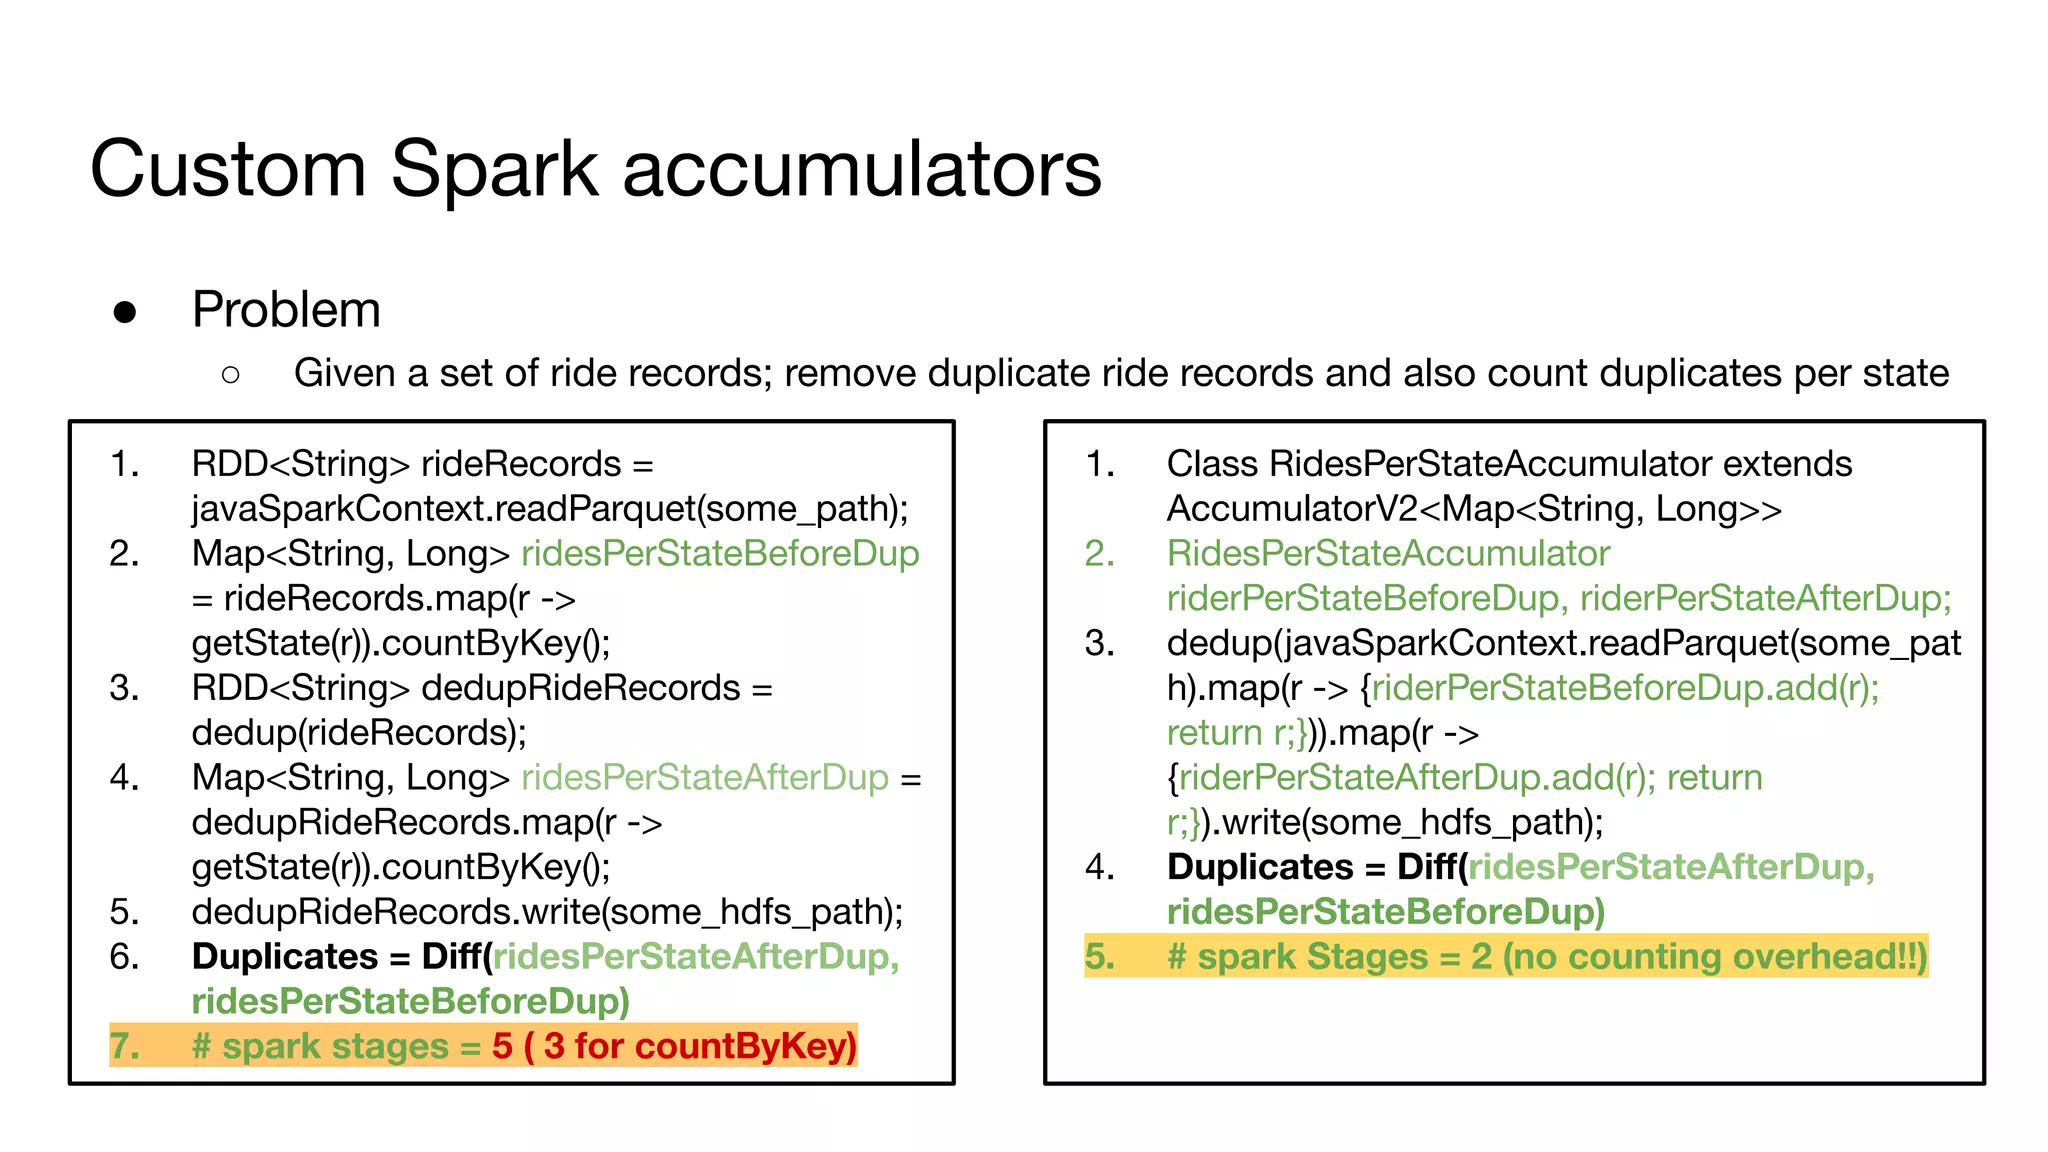
![Off heap memory improvements (work in progress)
● Symptom
○ Container killed by YARN for exceeding memory limits. 10.4 GB of 10.4 GB physical memory used. Consider
boosting spark.yarn.executor.memoryOverhead
● Solution as per stack overflow :)
○ Increase “spark.yarn.executor.memoryOverhead”
○ Result - Huge memory wastage.
● Spark memory distribution
○ Heap & off-heap memory (direct & memory mapped)
● Possible solutions
○ Avoid memory mapping or perform memory mapping chunk by chunk instead of entire file
(4-16MB vs 1GB)
● Current vs Target
○ Current - 7GB [Heap(4gb) + Off-heap(3gb)]
○ Target - 5GB [Heap(4gb) + Off-heap(1gb)] - ~28% memory reduction (per container)](https://image.slidesharecdn.com/bigdataanalyticspresentation-191115041715/75/SF-Big-Analytics-20191112-How-to-performance-tune-Spark-applications-in-large-clusters-31-2048.jpg)


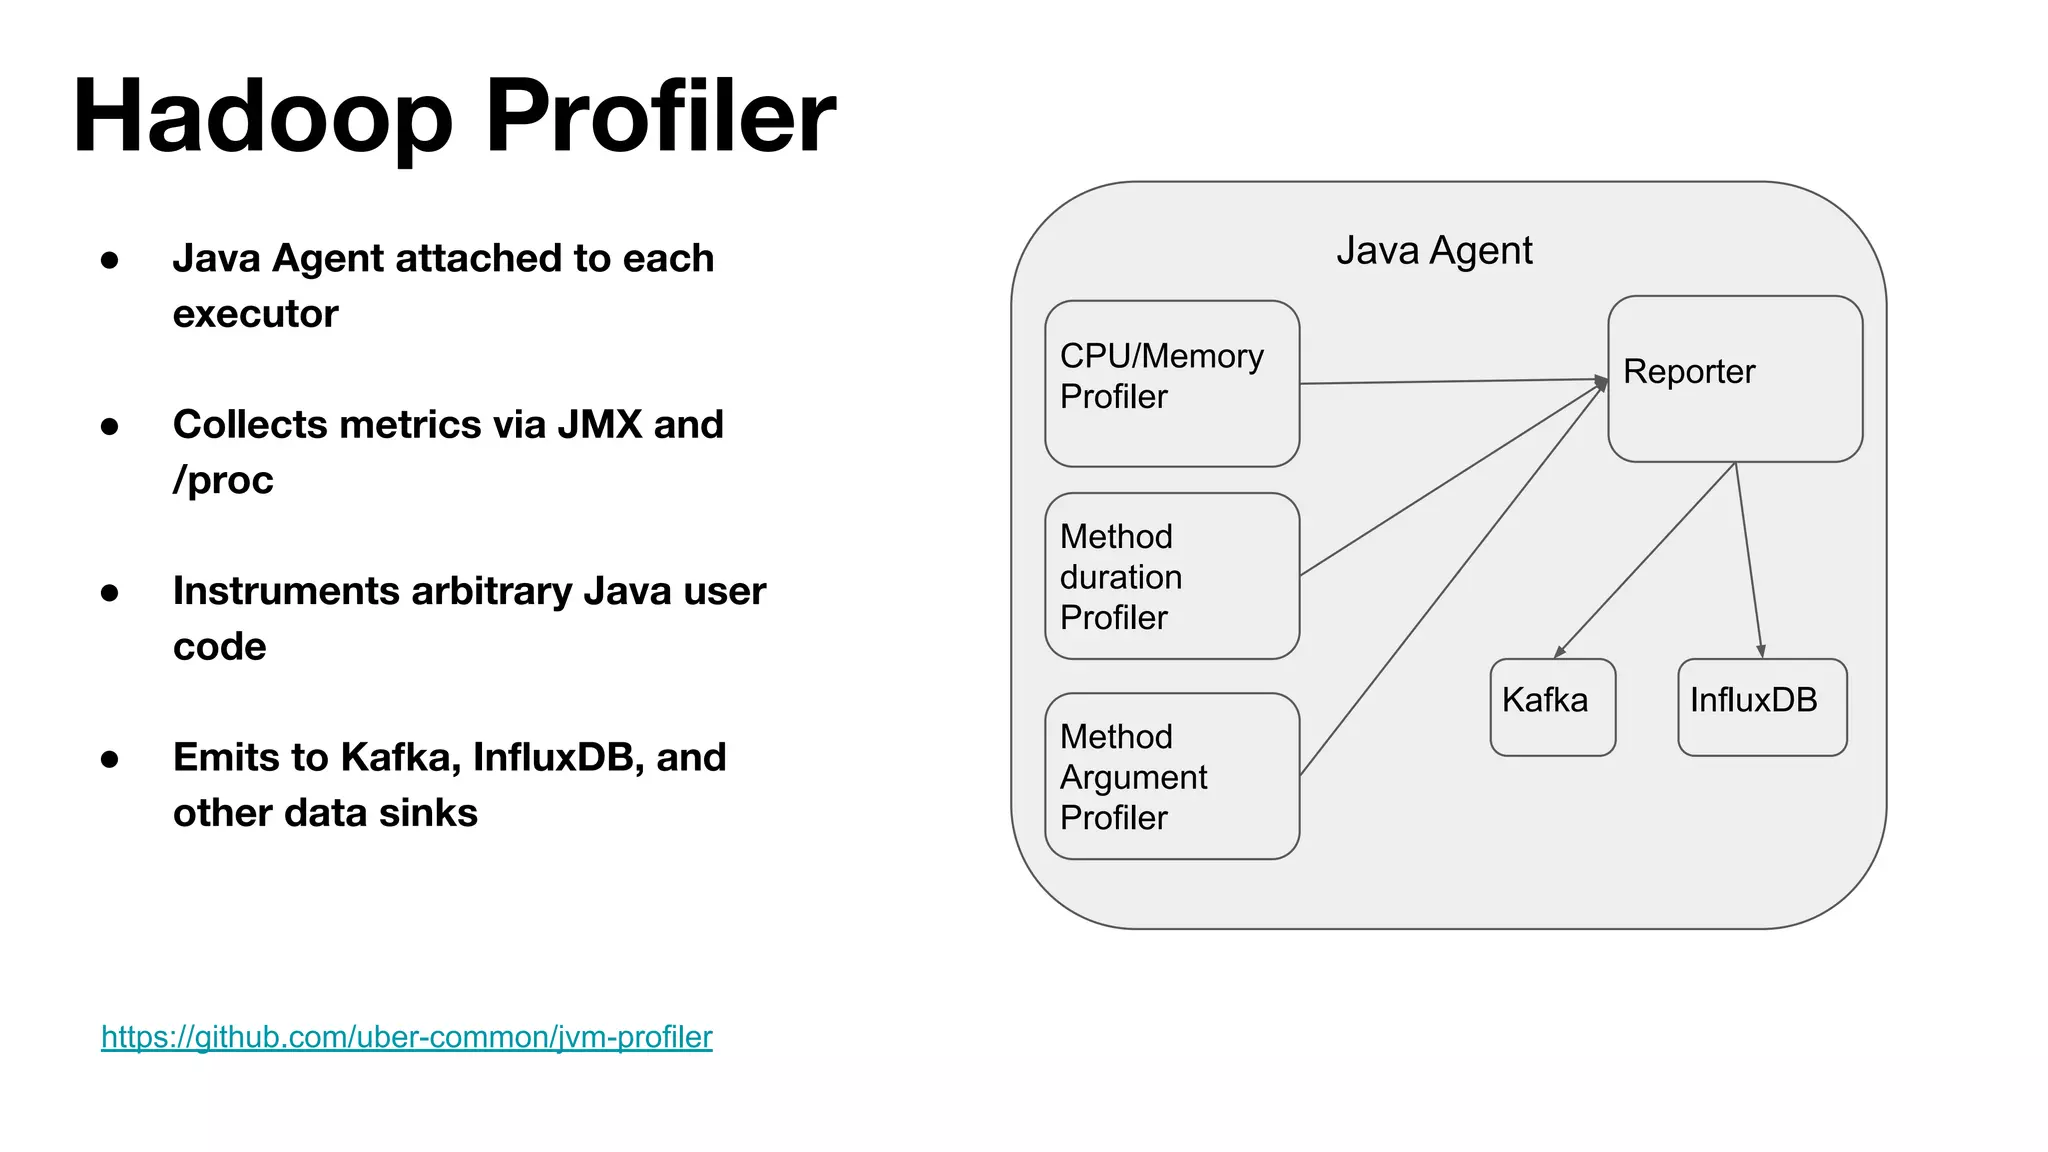
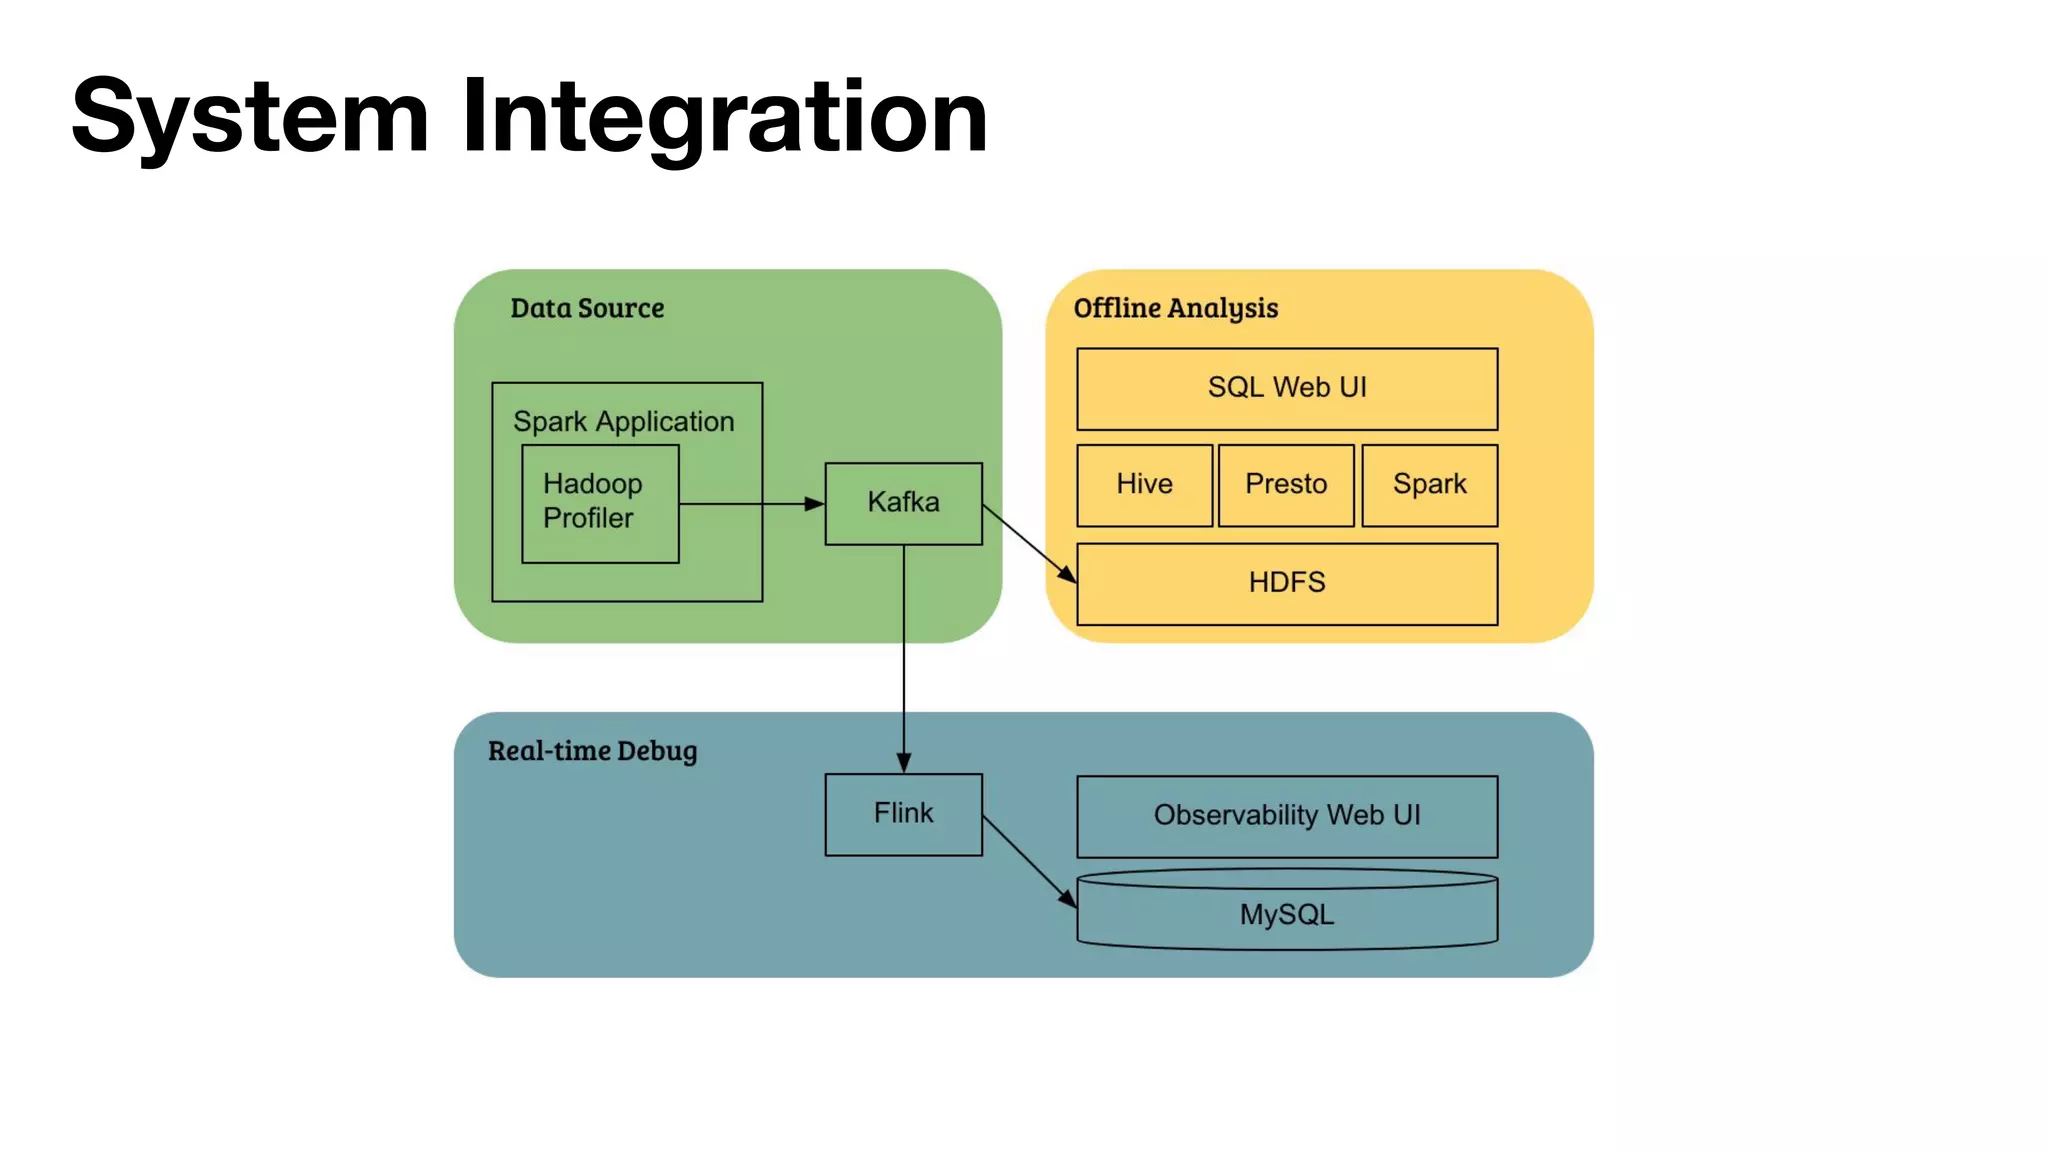
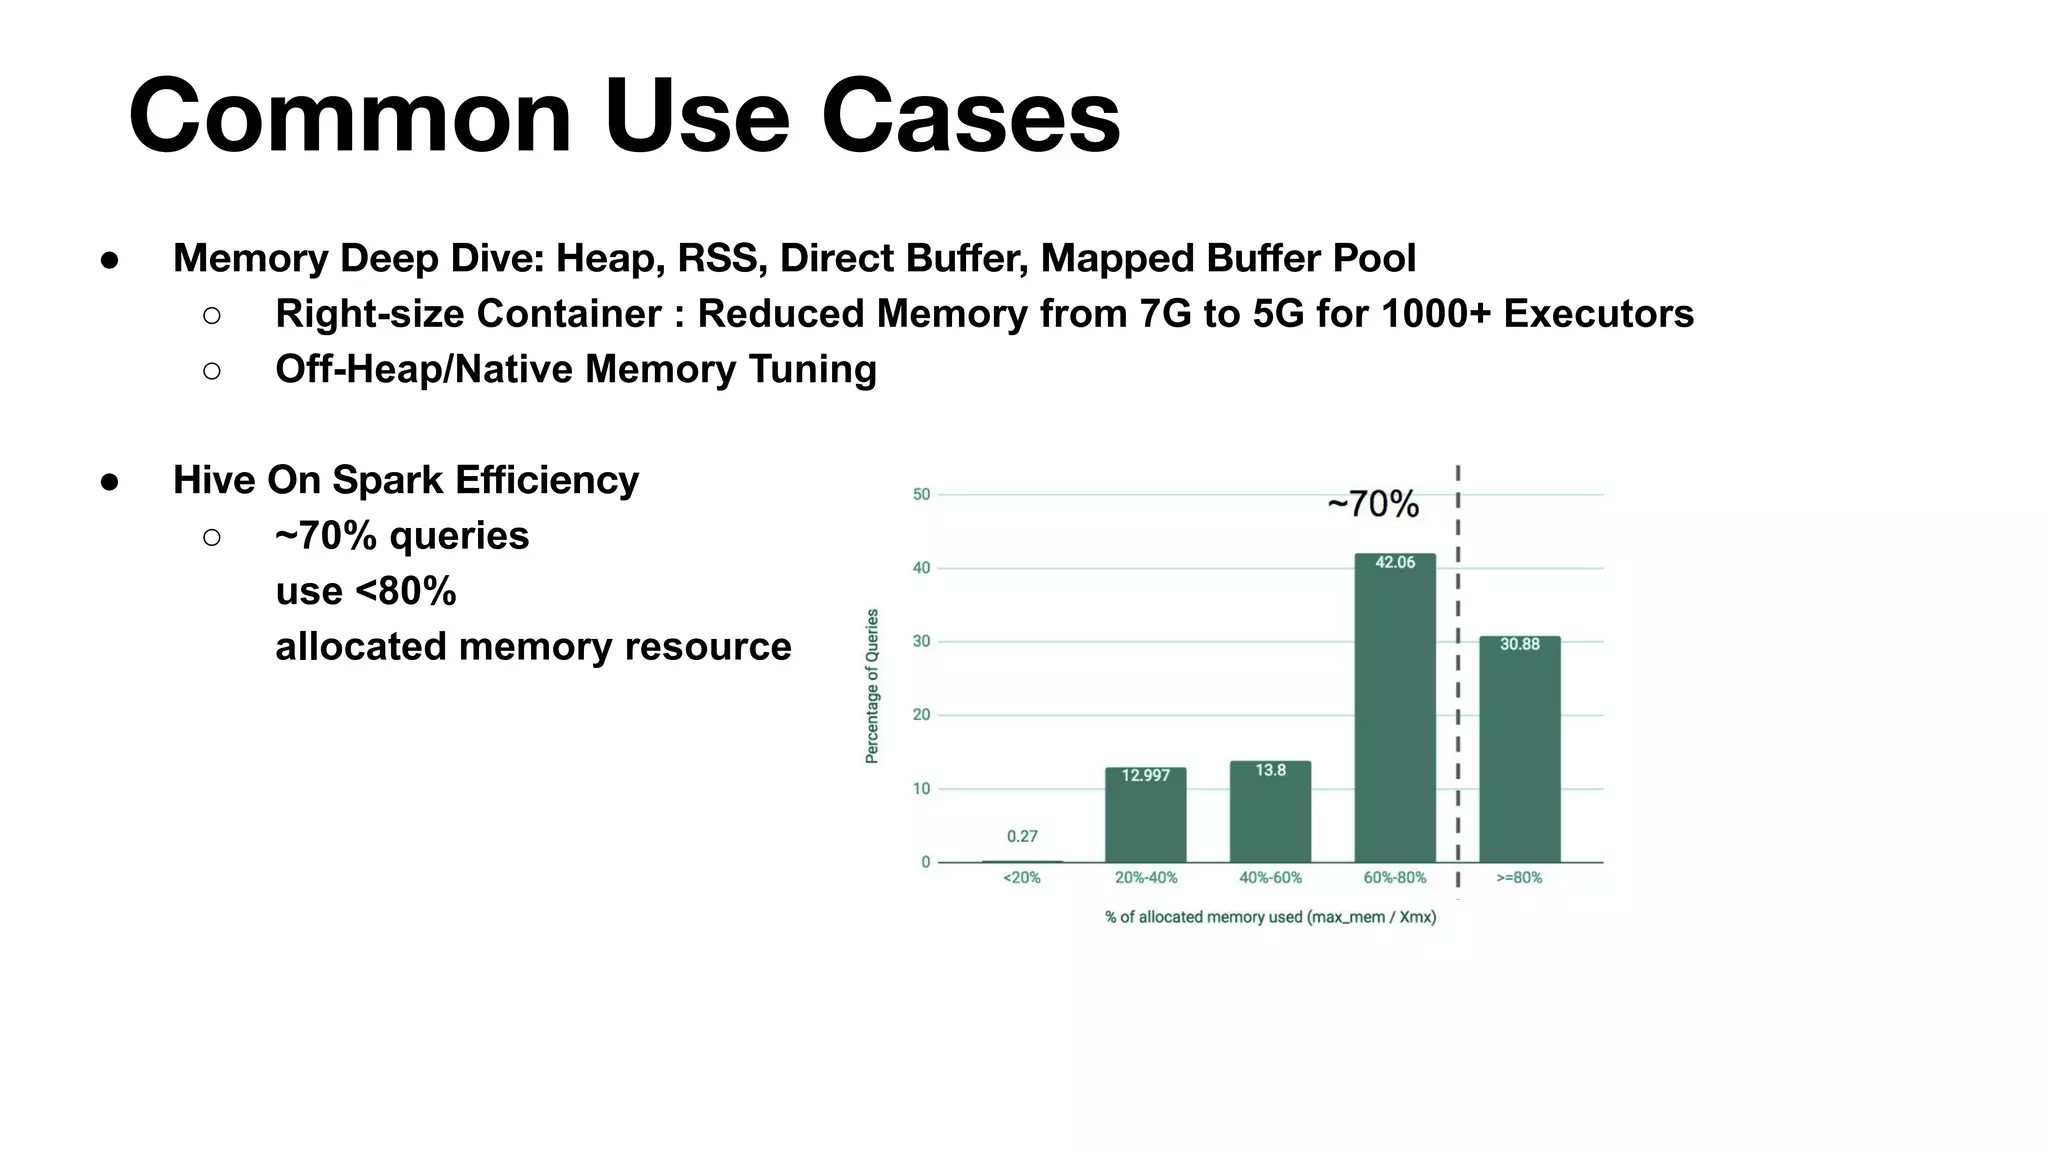
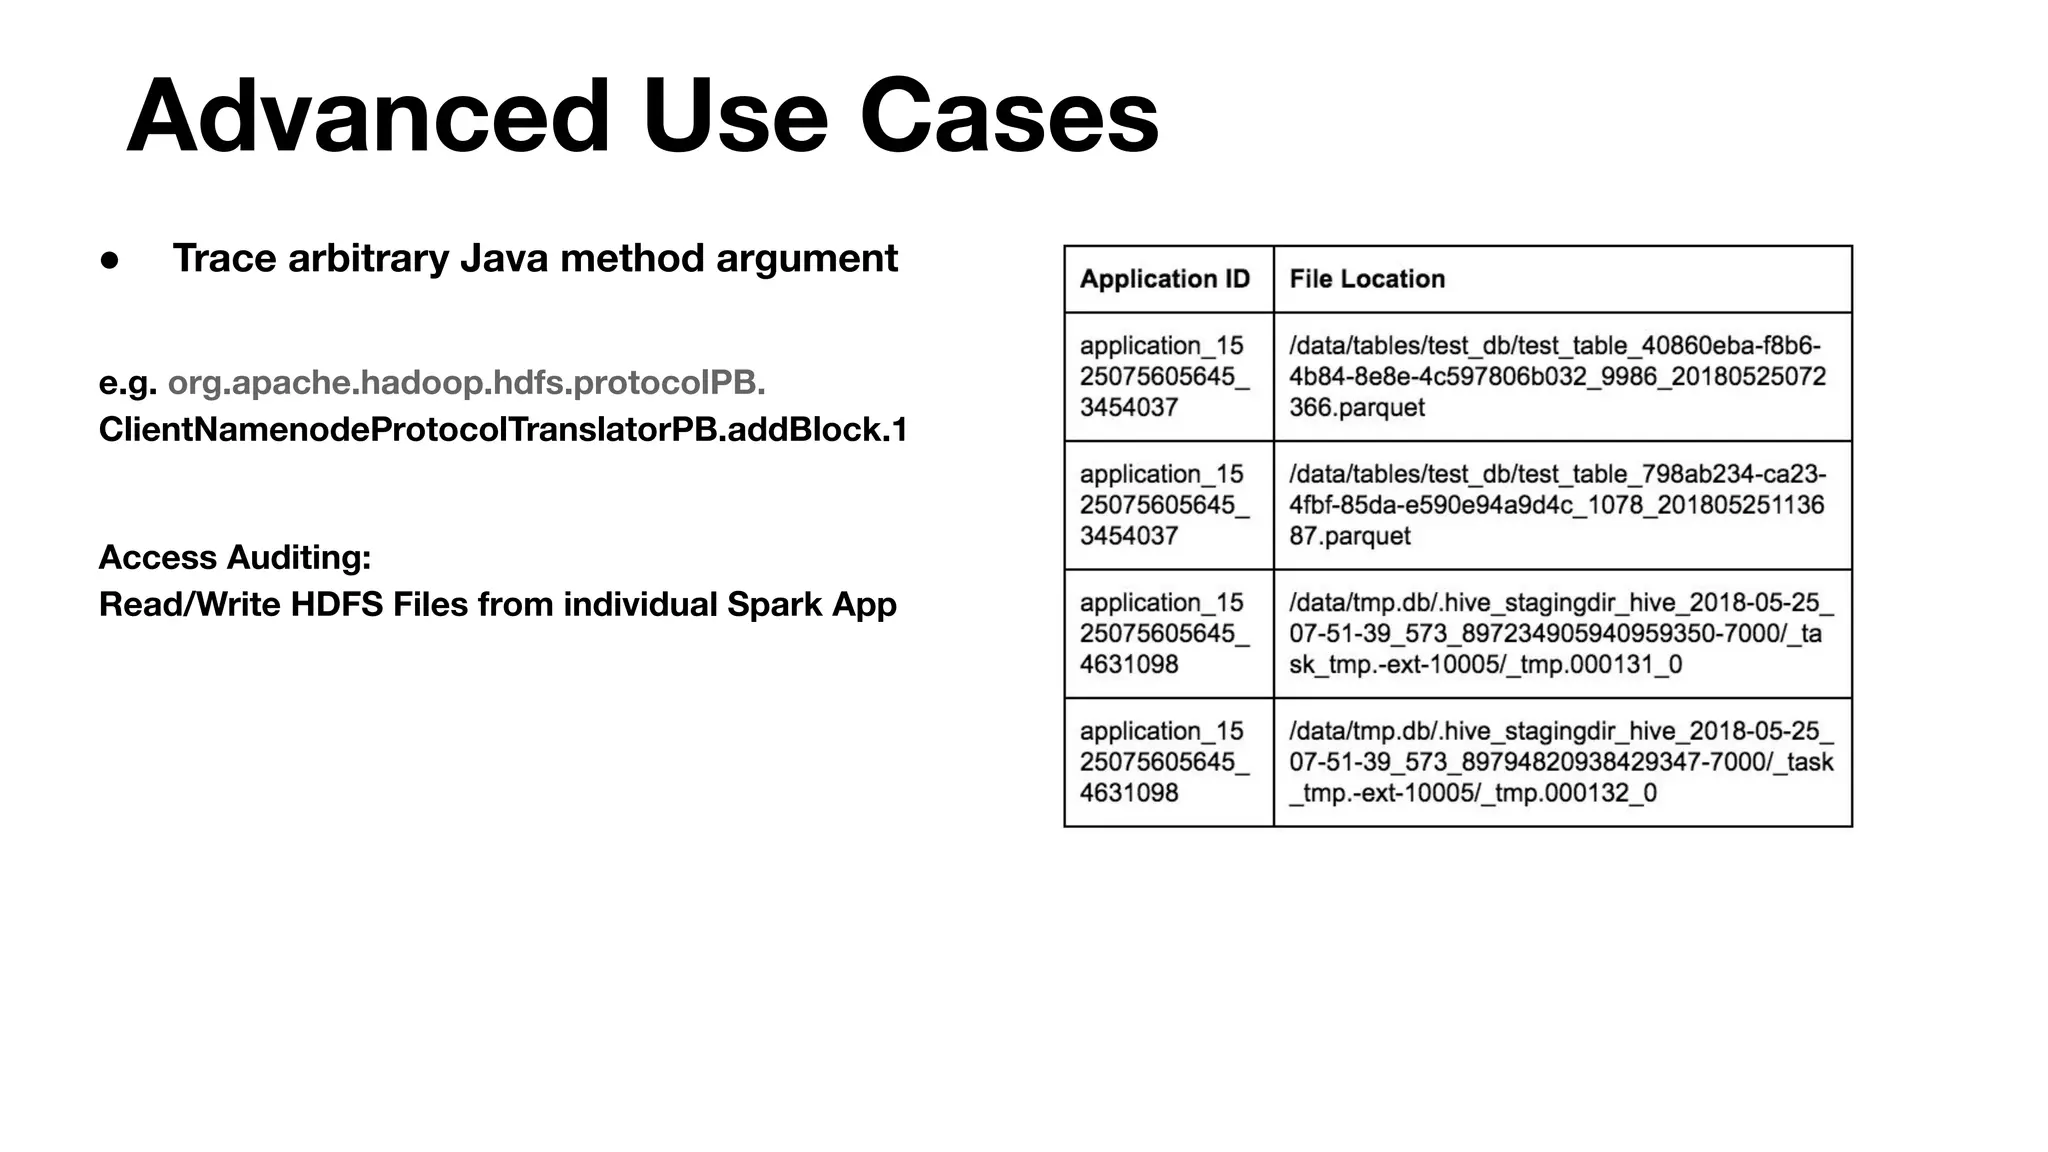
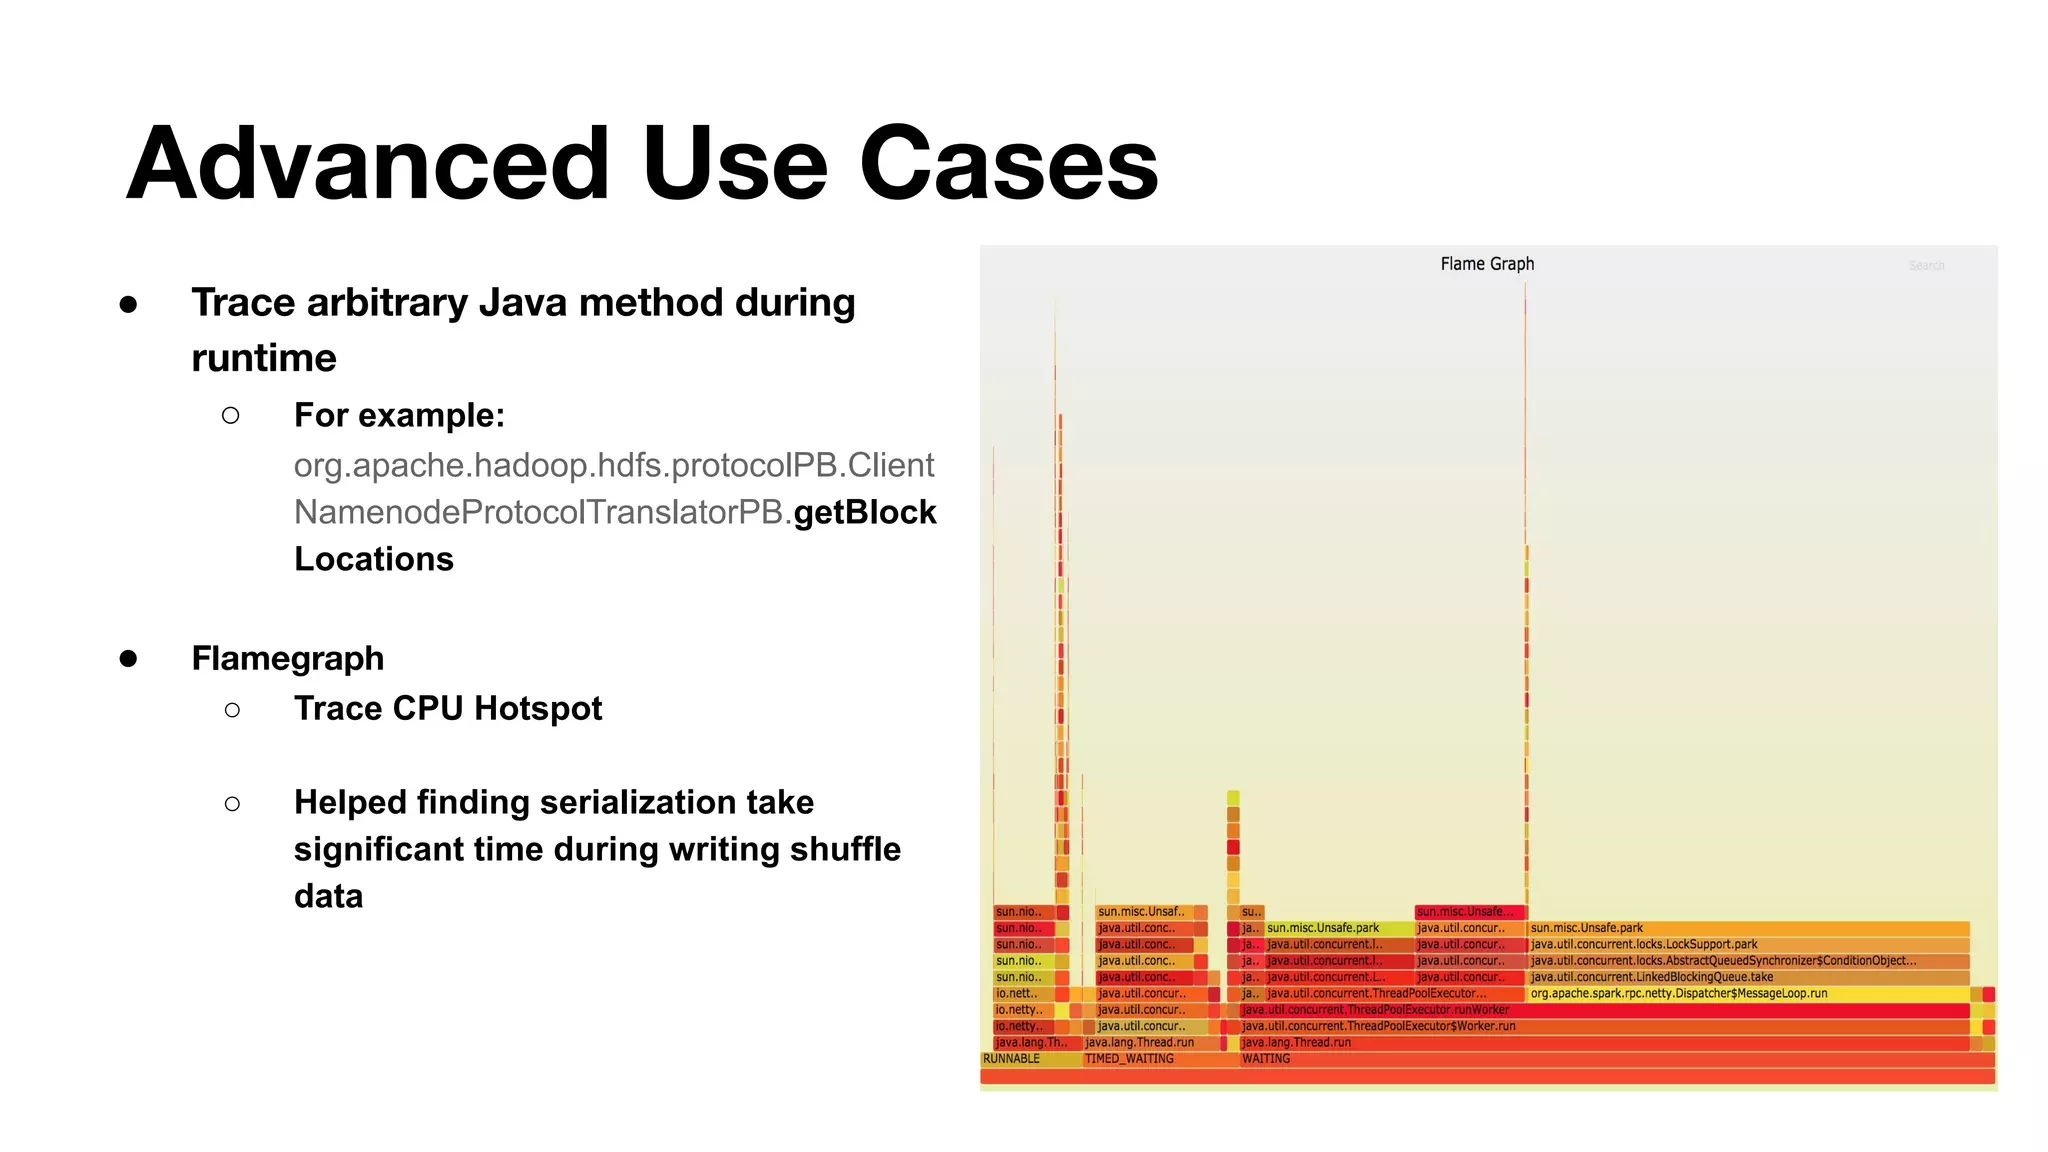
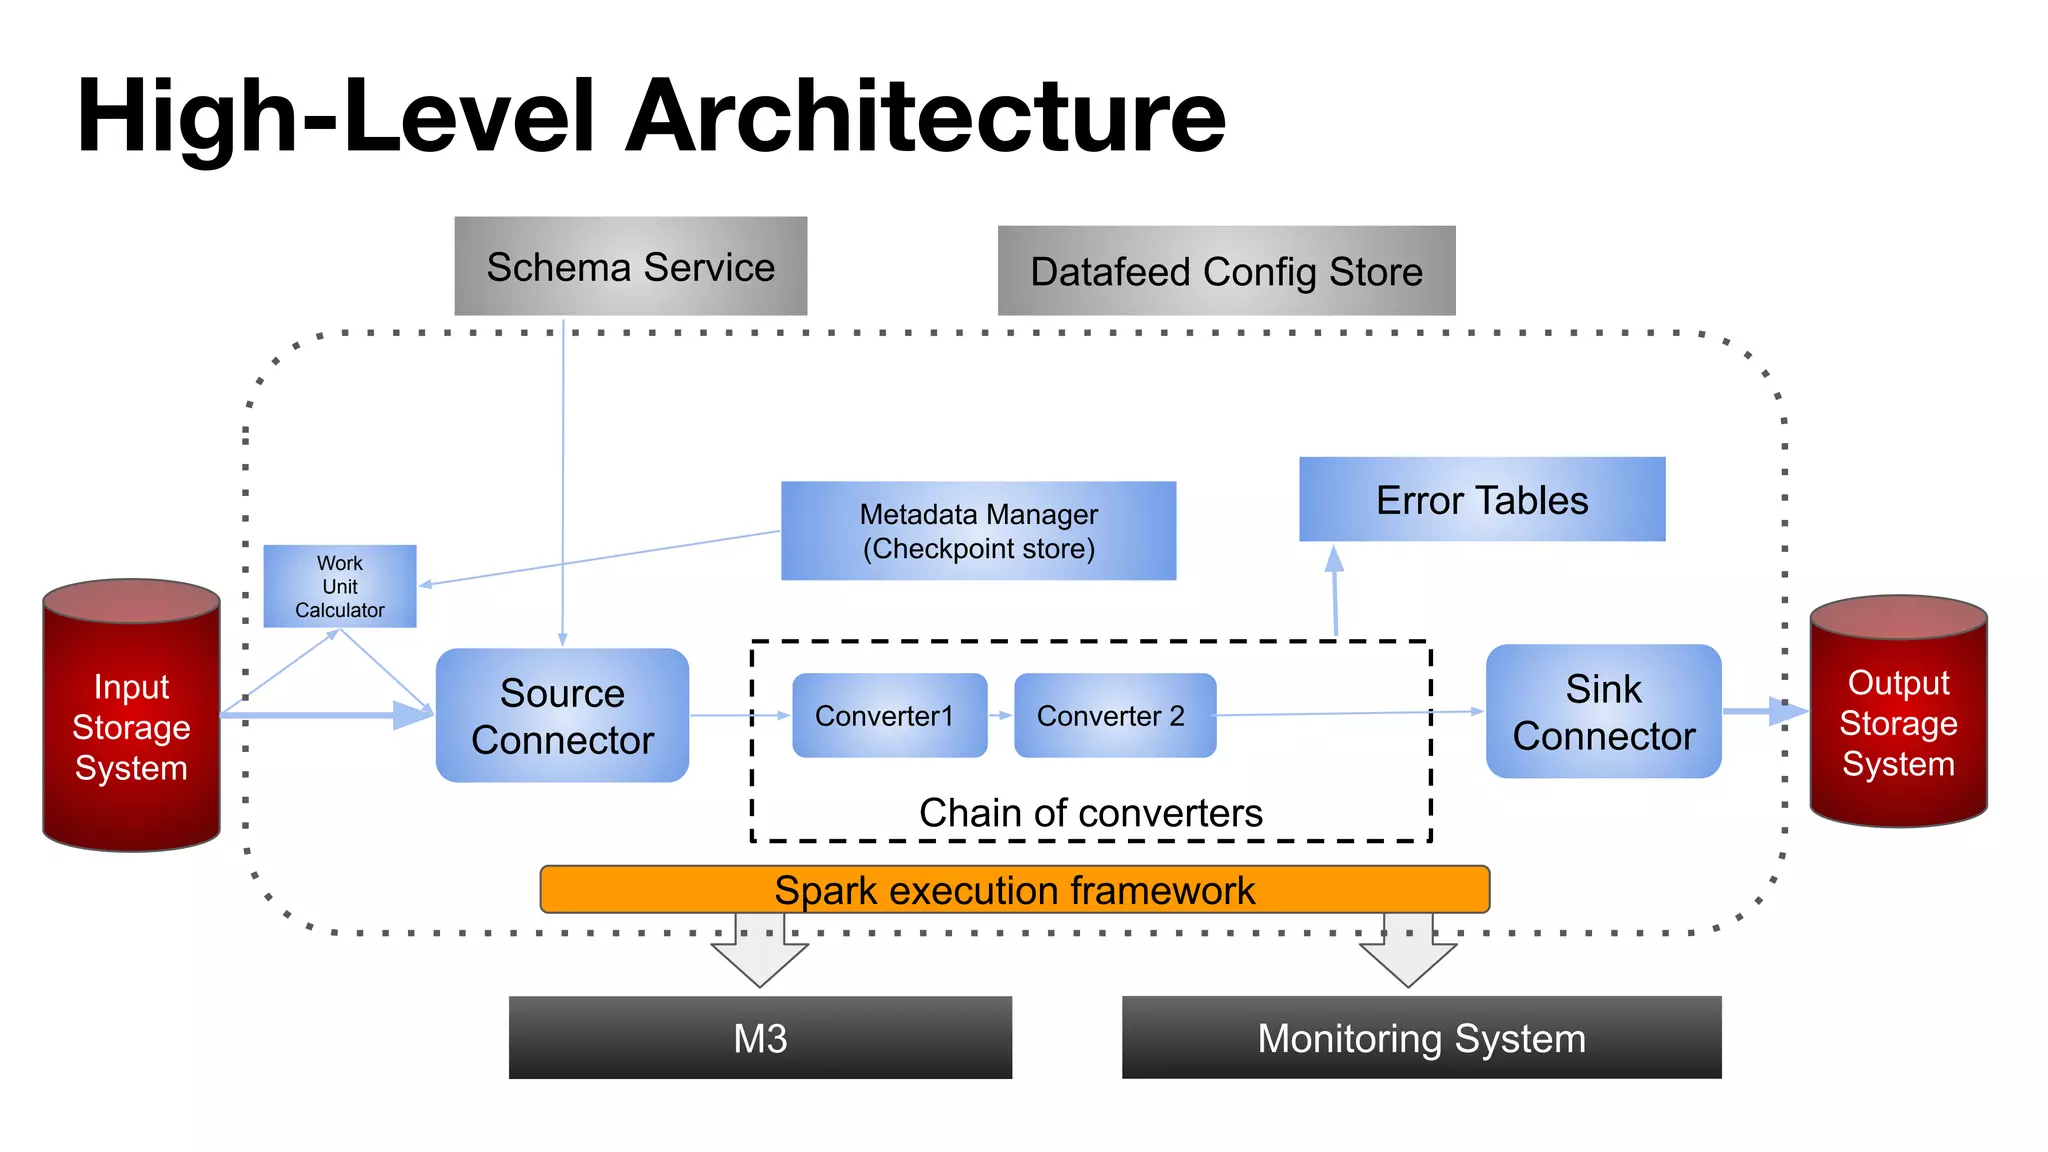
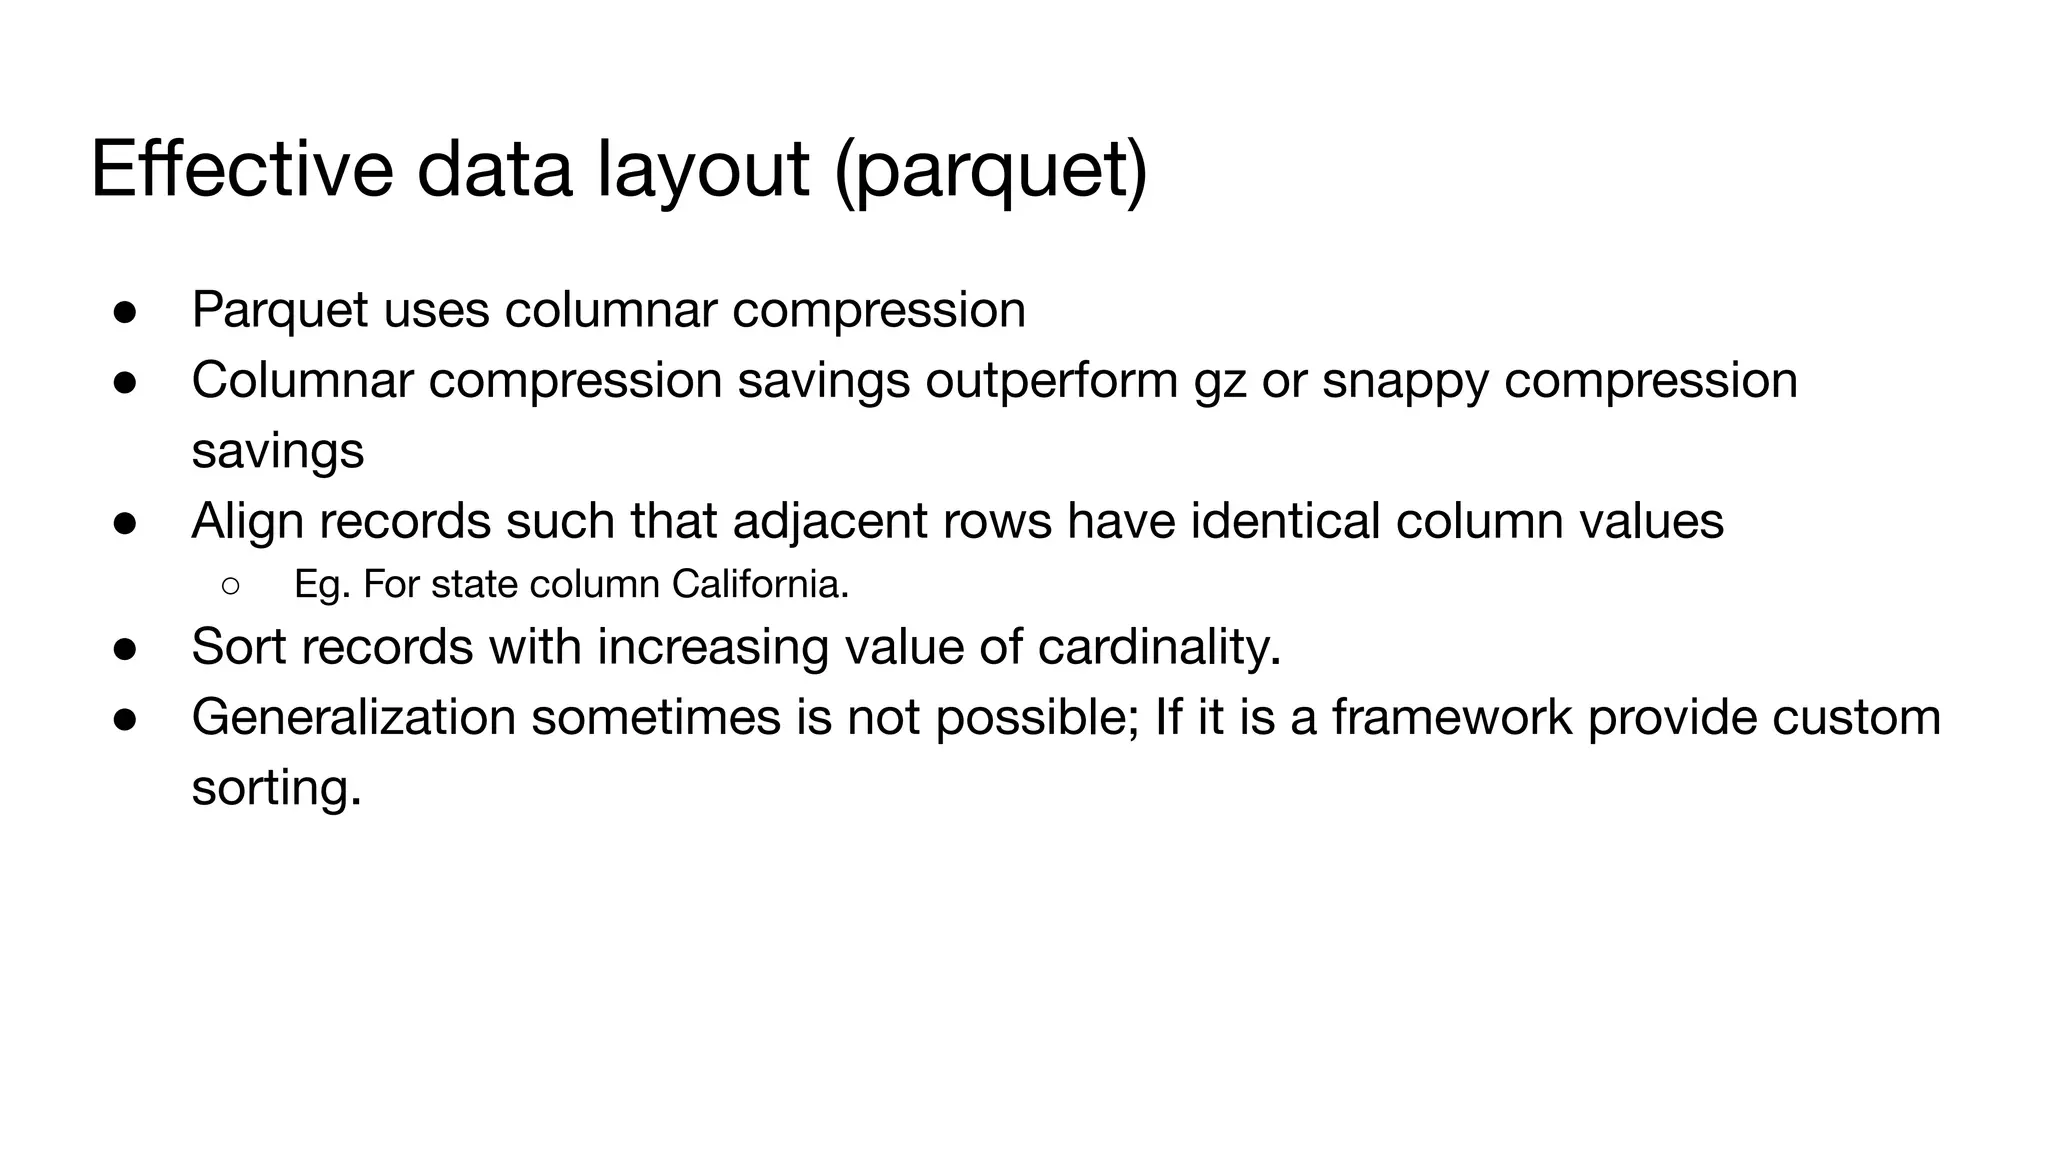
The document outlines strategies for performance tuning Spark applications in large-scale clusters, focusing on profiling, efficiency improvements, and advanced use cases. It discusses the implementation of a Java agent for JVM profiling, resource optimization strategies for memory and CPU, and techniques for effective data storage using Parquet. Additionally, it covers serialization improvements, automation of resource configuration, and methods to enhance Spark's execution framework performance.