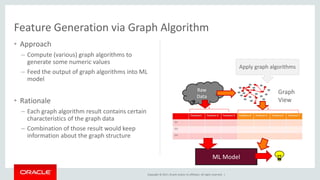
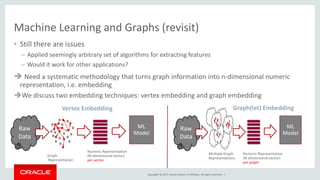
Copyright © 2018, Oracle and/or its affiliates. All rights reserved.
Oracle Ask TOM Office Hours:
When Graphs Meet Machine
Learning
Sungpack Hong, Research Director, Oracle Labs
Jean Ihm, Product Manager @JeanIhm
Copyright © 2017, Oracle and/or its affiliates. All rights reserved. |
AskTOM sessions on property graphs
• Today’s is the sixth session on property graphs
• In our past sessions, we showed …
– An introduction to Property Graphs, how to model graphs from relational data, perform graph
analytics, visualize graphs, query graphs
• Today’s topic: When Graphs Meet Machine Learning (use cases)
• Visit the Spatial and Graph landing page to view recordings of past
sessions; submit feedback, questions, topic requests; view upcoming
session dates and topics; sign up
2
https://devgym.oracle.com/pls/apex/dg/office_hours/3084
Copyright © 2017, Oracle and/or its affiliates. All rights reserved. |
3
The Story So Far …
Copyright © 2017, Oracle and/or its affiliates. All rights reserved. |
Oracle Big Data Spatial and Graph
• Available for Big Data platform/BDCS
– Hadoop, HBase, Oracle NoSQL
• Supported both on BDA and commodity
hardware
– CDH and Hortonworks
• Database connectivity through Big Data
Connectors or Big Data SQL
• Included in Big Data Cloud Service
Oracle Spatial and Graph
• Available with Oracle 18c/12.2/DBCS
• Using tables for graph persistence
• Graph views on relational data
• In-database graph analytics
– Sparsification, shortest path, page rank, triangle
counting, WCC, sub graphs
• SQL queries possible
• Included in Database Cloud Service
4
Graph Product Options
Copyright © 2017, Oracle and/or its affiliates. All rights reserved. |
Graph Storage Management
5
Architecture of Property Graph
Graph Analytics
Blueprints/Tinkerpop/Gremlin
REST/WebService
APIs
Java,Groovy,Python,…
Scalable and Persistent Storage
Oracle NoSQL
Database
Oracle RDBMS Apache HBase
Parallel In-Memory Graph Analytics
pgql> SELECT ...
Copyright © 2017, Oracle and/or its affiliates. All rights reserved. |
Graph Analysis for Business Insight
6
Identify
Influencers
Discover Graph Patterns
in Big Data
Generate
Recommendations
Copyright © 2017, Oracle and/or its affiliates. All rights reserved. |
7
When Graphs Meet Machine Learning:
Use Cases
Copyright © 2017, Oracle and/or its affiliates. All rights reserved. |
Graph Benefits
• Why do we want to have graph as data model (as opposed to relational)
• Some of graph benefits
– Intuitive data model
– Fast query over multi-hop relationships
– Data visualization and interactive exploration
– Enhanced data analysis via graph signals
Copyright © 2017, Oracle and/or its affiliates. All rights reserved. |
Using Graph for Data Analysis
• The main idea
– Graph captures fine-grained relationships (as edges) between data entities
– By using these (materialized) relationships as new signals,
– We can extract some useful information about the original data set
– … but exactly how?
Copyright © 2017, Oracle and/or its affiliates. All rights reserved. |
Agenda
Classical Method: Via Graph Algorithms
Generating Features From Graph Algorithms
Graph Embedding Techniques
1
2
3
10
Copyright © 2017, Oracle and/or its affiliates. All rights reserved. |
Classical Approach: Graph Algorithms
• Starting from graph data model
• Apply computational graph algorithms (+ graph queries)
– E.g. centrality, reachability, closeness, …
– Graph algorithm computes specific characteristics of the graph model
– Use the algorithm results to get answer for your question
• e.g. what entities are closer to other entities?
Copyright © 2017, Oracle and/or its affiliates. All rights reserved. |
Example – Anomaly Detection in Medicare Data
• Using a Public Dataset
• From US Center for Medicare and Medicaid Services (CMS)
– Health-care Billing Data for CY 2012
– Aggregated medical transactions: 9,153,272 records with 29 variables
– Transactions between 880,644 medical providers and CMS
with total amounts > $77B for the year
• Data Entities
– Medical providers (doctors)
– Medical procedures – operations, prescription, treatments …
– i.e. Who is doing what (and charging it to Medicare)
Copyright © 2017, Oracle and/or its affiliates. All rights reserved. |
• Anomaly Definition
– Doctors of the same specialty provide similar
services
– What if a doctor perform a lot of treatments
that typically belong to other specialties?
• E.g. a cardiologist doing plastic surgery?
• How do we find such cases?
 By applying graph algorithm
Anomaly and Graph Data Model
“There is a spy among us”
Dr.
Frankenstein,
Prescribe Aspirin
Optometrists
CMS data represented as a graph
providers
services
Approach (sketch)
• Pick a specialty
• Compute random-walk distance from the doctors
of this specialty group
• (By applying personalized Pagerank algorithm)
• And check if there is any outside-specialty doctors
who are exceptionally close to this specialty group
Copyright © 2017, Oracle and/or its affiliates. All rights reserved. |
• False positives
– From popular common procedures
Procedures
Subsequent hospital inpatient care, typically 25 minutes per
day
Emergency department visit, moderately severe problem
Initial hospital inpatient care, typically 70 minutes per day
Subsequent hospital inpatient care, typically 35 minutes per
day
Initial hospital inpatient care, typically 50 minutes per day
…
Dealing with practical issues (1/2)
What
Eye-doctor
does
What every
Doctor does
Doctor XDoctor Y
• We can identify such procedures via another graph
algorithm – Pagerank
• And do special treatment (details omitted here)
Copyright © 2017, Oracle and/or its affiliates. All rights reserved. |
Dealing with practical issues (2/2)
• False positives
– From close specialties
– Who does similar thing by nature
• What we did (details omitted here)
– Statistically identify such specialties
– Treat them differently
Blue: PPR distribution of
Optometrists
Red: PPR
distribution of
Opthalmologists
Eye doctor Eyeball doctor
Copyright © 2017, Oracle and/or its affiliates. All rights reserved. |
Results
• Example of detected anomaly
Description of the procedure ID Specialty
Removal of eye fluid (vitreous) between the
lens and retina
1760485xx6 Gastroenterology
Preventive retinal detachment treatment by
heat or laser
1760485xx6 Gastroenterology
Removal of membrane from the retina
…
1760485xx6 Gastroenterology
Stomach doctor
A stomach doctor doing eye doctor
things (and charging those to CMS)
Copyright © 2017, Oracle and/or its affiliates. All rights reserved. |
Other Example -- Bot accounts in SNS network
• Identifying Bot Accounts in SNS network
– Represent SNS network as Graph
– Apply graph algorithm and query
– Find bots and their targets which show different communication patterns
– Find other bots that are connected via the network
Copyright © 2017, Oracle and/or its affiliates. All rights reserved. |
Algorithmic Approach – Summary and Issues
• Apply graph algorithms for data analysis
• Still very effective for many problems and applications
– Anomaly detection, Influence identification, Customer segmentation, Topic analysis
…
• Explainability Results based on (deterministic) algorithms computation
• Issues
– You need to know what algorithm can solve your problem
– Want to follow the machine learning (ML) trends
• Exploit existing techniques and tools in ML
• Combine with other ML models
Copyright © 2017, Oracle and/or its affiliates. All rights reserved. |
Feeding graph data into ML pipeline
• Goal: want to apply Machine Learning techniques using graph signals
Need some form that are suitable for feeding into conventional ML pipeline
but still carries the information in the graph
• … How can this be done?
Raw
Data
ML
Model
graph
……
Copyright © 2017, Oracle and/or its affiliates. All rights reserved. |
Agenda
Classical Method: Via Graph Algorithms
Generating Features From Graph Algorithms
Graph Embedding Techniques
1
2
3
20
Copyright © 2017, Oracle and/or its affiliates. All rights reserved. |
• Approach
– Compute (various) graph algorithms to
generate some numeric values
– Feed the output of graph algorithms into ML
model
• Rationale
– Each graph algorithm result contains certain
characteristics of the graph data
– Combination of those result would keep
information about the graph structure
Feature Generation via Graph Algorithm
ML Model
Raw
Data
Graph
View
Apply graph algorithms
Copyright © 2017, Oracle and/or its affiliates. All rights reserved. |
Example from Security Application
• Security is an important topic, especially
for Cloud
– Identity management
– Threat Protection
– Security management
– ...
• There are many interesting success
stories for using graph for security
problems – Cisco, MS, Amazon, …
Copyright © 2017, Oracle and/or its affiliates. All rights reserved. |
Problem: Malware Detection from Network
• Goal
– Analyze network packet captures (PCAPs)
• Traces from malware activities and benign ones
– Apply machine learning technique
– Leann a model to distinguish malwares activities from benign ones.
Copyright © 2017, Oracle and/or its affiliates. All rights reserved. |
Graph-Based Approach
• Approach (from DSN’17)
– Rather than analyzing payload of each packet,
collect up packet traces as graphs
– Extract characteristics of those graphs via graph
algorithms
– Train model  Differentiate malware traces from
normal ones
Angler EK serving CryptoWall ransomware on 12/21//2015DSN’17
Observation: Malwares
have different trace
patterns than normal
activities
Copyright © 2017, Oracle and/or its affiliates. All rights reserved. |
• Implementations
– Implemented the technique in the paper on
top of PGX
– Features generation as proposed in the pager:
node-size, edge-size, avg-degree, avg-eigen-
vector, avg-pagerank, avg-clustering coeff, …
– PGX to generate features; ML framework (e.g.
TensorFlow) for classification
– 510 malware pcaps from
https://www.malware-traffic-analysis.net/
– 1110 benign pcaps from
https://www.wireshark.org/download/automat
ed/captures/
Example in Security Application -- Malware Detection
• Data Set : Trace Graph Size Distribution
Number of vertices (malware pcaps) Number of vertices (benign pcaps)
Number of edges (malware pcaps) Number of edges (benign pcaps)
Copyright © 2017, Oracle and/or its affiliates. All rights reserved. |
• Feature importance (using Random
Forests)
• Avg-In-Degree (0.191787)
• Avg-Out-Degree (0.183539)
• Avg-Degree-Centrality (0.170083)
• Avg-EigenVector-Centrality (0.106156)
• Volume (0.088323)
• EdgeSize (0.077220)
• Avg-PageRank (0.074146)
• NodeSize (0.064597)
• Avg-Betweenness-Centrality (0.039565)
• Avg-Clustering-Coefficient (0.004584)
• (Demo)
• Accuracy on test set: 100% (Random
Forests), 99.69% (CNN)
• Confusion matrix: (tn: 224, fp: 0, fn: 0, tp: 100)
Confidential – Oracle Internal/Restricted/Highly Restricted 26
Exploration Result
Copyright © 2017, Oracle and/or its affiliates. All rights reserved. |
Agenda
Classic Method: Applying Graph Algorithms
Generating Features From Graph Algorithms
Graph Embedding Techniques
1
2
3
27
Copyright © 2017, Oracle and/or its affiliates. All rights reserved. |
Safe Harbor Statement
The following is intended to outline our general product direction. It is intended for
information purposes only, and may not be incorporated into any contract. It is not a
commitment to deliver any material, code, or functionality, and should not be relied upon
in making purchasing decisions. The development, release, timing, and pricing of any
features or functionality described for Oracle’s products may change and remains at the
sole discretion of Oracle Corporation.
28
Copyright © 2017, Oracle and/or its affiliates. All rights reserved. |
Notice
• Contents in this section discuss recent techniques for combining graphs
and machine learning
• Some of these techniques are experimentally implemented in Oracle Labs
• Therefore they are not part of the Oracle Graph products
Copyright © 2017, Oracle and/or its affiliates. All rights reserved. |
Machine Learning and Graphs (revisit)
• Still there are issues
– Applied seemingly arbitrary set of algorithms for extracting features
– Would it work for other applications?
 Need a systematic methodology that turns graph information into n-dimensional numeric
representation, i.e. embedding
We discuss two embedding techniques: vertex embedding and graph embedding
Raw
Data
ML
Model
Graph
Representation
Numeric Representation
(N-dimensional vector)
per vertex
Raw
Data
ML
Model
Multiple Graph
Representations
Numeric Representation
(N-dimensional vector)
per graph
Vertex Embedding Graph(let) Embedding
Copyright © 2017, Oracle and/or its affiliates. All rights reserved. |
Vertex Embedding
• Goal: to turn graph into n-dimensional
vector
• Want to keep graph (topology)
information
– i.e. Entity distance in distance
Rhicheek Patra, Oracle Labs (ML Summit 2018) 31
Raw
Data
ML
Model
Graph
Representation
Numeric Representation
(N-dimensional vector)
x, y: data entity (represented as vertex in graph)
v(x), v(y): n- dimensional vector representation of x and y
x, y close in graph  v(x) - v(y) close in vector space
Copyright © 2017, Oracle and/or its affiliates. All rights reserved. |
• There are several approaches now
– Academia and Industry
• DeepWalk
– An early approach that exploits techniques
from modern NLP
– Word2Vec : a ML technique that learns
closeness between words from large number
of sentences
– Perform many random walks on the graph and
generate traces.
– Apply W2V technique on them; treating
vertices as words.
Rhicheek Patra, Oracle Labs (ML Summit 2018) 32
How to achieve this? KDD‘14
Copyright © 2017, Oracle and/or its affiliates. All rights reserved. |
• Note: you can consider this as a mock-up of
customer segmentation problem
– Student => Customer
– Course taking => Item or service purchase
– Department => Segmentation label
Example
• Student classification
– A real dataset from university
– Can you predict a student’s major or department just by
looking at the classmates in the course that (s)he is
taking?
Rhicheek Patra, Oracle Labs (ML Summit 2018) 33
CS
ME
10.003
10.004
10.005
11.103
11.213
12.118
students courses
Copyright © 2017, Oracle and/or its affiliates. All rights reserved. |
• (Result #1) Graph-based prediction gives better
result than naïve application of ML (e.g. CNN) on
basic student features (e.g. age, gender,
background, …)
• (Result #2) Deep-Walk preserves information
from graph representation
• (Result #3) Deep-Walk allows to combined graph
data with other features
Results
CNN on Original Features
PPR (Graph Algorithm)
CNN on Extracted Graph Features
(from deep-walk)
CNN on Original + Graph Features
Copyright © 2017, Oracle and/or its affiliates. All rights reserved. |
Graph(let) Embedding
• Objective
– Want to capture closeness (similarity) between graph instances
• Example
– What classic literatures look more similar. from their character relationships?
Odyssey Beowulf Romeo & Juliet Hamlet
Want to have a systematic way to
extract features of these graphs and
compare/classify them
Need to capture irregular structure:
• Arbitrary edges between vertices
• Varying size (# of vertices and
#edges)
• Labels or properties defined on
vertices and edges
Copyright © 2017, Oracle and/or its affiliates. All rights reserved. |
• Similarly applying sequence-based
learning
– i.e: Paragraph2Vec  learn from large text corpus.
Paragraphs composed of similar words are close in
embedding space
– Consider each graph as paragraph
– Generate random-walk on each graphs to generate
traces.
– Apply Paragraph2Vec model to learn similarity
between graphs
• Added our own improvements
Graph(let) Embedding – How to approach this?
(1) Tricks for encoding multiple properties
(2) When generating traces, consider edges as words (instead of vertices)
(3) Considering certain global properties of each graph -- e.g. size of graph
…
Copyright © 2017, Oracle and/or its affiliates. All rights reserved. |
Graph(let) Embedding – Cheminformatics Example
• (Demo)
• Two Datasets from cheminformatics
– National Cancer Institute (NCI109)
• #Graphs: 4127
• #Vertices: ranges from 35 to 111
• #Edges: ranges from 152 to 476
• Cancer types (binary classification)
– Proteins
• #Graphs: 1113
• #Vertices: ranges from 9 to 620
• #Edges: ranges from 64 to 4048
• Protein types (binary classification)
PG2VEC (ours)
PG2VEC (ours)
Notes
• Graph2Vec is naïve
implementation of
paragraph2vec on graph
• Our improvements made a
big difference in quality of
answer for both dataset
Copyright © 2017, Oracle and/or its affiliates. All rights reserved. |
• AML (Anti-money laundering)
– More serious application from
collaboration with FCCM team
– Online Step
• Transactions are monitored real-time
• Any suspicious activity is flagged (lots of
false-positives)
– Offline Step (Correlation)
• Flags(alerts) are attached to the global
financial graph
• Identify entities and flags that are closed
connected from the graph
•  Each subgraph creates a case
Other Example – Anti-Money Laundering
AlertA
AlertB
AlertA
AlertB
AlertC
Case 1 Case 2
AlertA AlertA
Case 3
– Evaluation Step
• Compute certain functions on each case to
evaluate its risk factor
• Human (investigator) makes decision
– Looks serious  Proceed to official investigation
– Looks benign  close the case
– Don’t know yet. Keep it open  wait to see if
more flags will happen
Algorithmic
approach
Graph ML to help
making this decision?
Copyright © 2017, Oracle and/or its affiliates. All rights reserved. |
• Task #1
– Given a new case, can we find existing cases in
history that look similar to this one? (as a
reference for investigator)
: Use Pg2Vec to train and find
Graph(let) Embedding – Anti-Money Laundering
• Task #2
– Train from existing cases, learn a classifier
– i.e. system recommends that “this case looks
serious. Recommended for official
investigation”
Copyright © 2017, Oracle and/or its affiliates. All rights reserved. |
Graphs Machine Learning: Recent Trends
• By the way, combining graph and machine learning is a trend
– Many in industry and academia are looking at this problem
– And applying it to solving real problems
40
Pinterest Alibaba Google
Copyright © 2017, Oracle and/or its affiliates. All rights reserved. |
Current Directions
• Improving Scalability
– Increasing the size of graph (e.g. tens of billions of vertices)
• Combining structure (relationship) and other raw observation
– E.g. Item attributes + Co-purchase Information
– Finding more elegant solution than simple ensemble techniques
Rhicheek Patra, Oracle Labs (ML Summit 2018) 41
Copyright © 2017, Oracle and/or its affiliates. All rights reserved. |
Summary
• Use graph signals (relationships between entities) for data analysis
• Applying graph algorithms
• Combining graph with Machine learning – embedding techniques
• Many applications
Copyright © 2017, Oracle and/or its affiliates. All rights reserved. |
• We have an implementation in our graph
package (PGX) [BETA only, not in product]
– Load graph model
– Compute graph embedding
– Query embedding directly on graph
– Export graph embedding
Rhicheek Patra, Oracle Labs (ML Summit 2018) 43
Sounds complicated, how can I use this technique easily?
PGX
(Graph)
Database or
Files
Embedding
Export
Other ML
Framework
Copyright © 2017, Oracle and/or its affiliates. All rights reserved. |
44
Resources
Copyright © 2017, Oracle and/or its affiliates. All rights reserved. |
Resources
• Oracle Spatial and Graph on OTN
www.oracle.com/technetwork/database/options/spatialandgraph
White papers, software downloads, documentation and videos
• Use cases and examples at OpenWorld ’18 Graph presentations page:
https://tinyurl.com/GraphOOW18
• Blog – examples, tips & tricks blogs.oracle.com/oraclespatial
• YouTube channel: https://tinyurl.com/OracleGraphYouTube
• Oracle Big Data Lite Virtual Machine - a free sandbox to get started
www.oracle.com/technetwork/database/bigdata-appliance/oracle-bigdatalite-2104726.html
– Hands On Lab included in /opt/oracle/oracle-spatial-graph/ or http://github.com/oracle/BigDataLite/
45
Copyright © 2017, Oracle and/or its affiliates. All rights reserved. |
Resources – social media and online communities
• Follow the product team: @SpatialHannes, @JeanIhm, @agodfrin
• Oracle Spatial and Graph SIG user groups (search “Oracle Spatial and
Graph Community”)
46
Copyright © 2017, Oracle and/or its affiliates. All rights reserved. |
Analytics and Data Summit
All Analytics. All Data. No Nonsense.
March 12 – 14, 2019
Formerly called the BIWA Summit with the Spatial and Graph Summit
Same great technical content…new name!
www.AnalyticsandDataSummit.org
Call for Speakers now open!
Submit an abstract to share your use
case or technical session by Jan. 7
Copyright © 2017, Oracle and/or its affiliates. All rights reserved. |
AskTOM sessions on property graphs
• Next Spatial and Graph session in Jan/Feb
– Topic to be announced – stay tuned
• View recordings, submit feedback, questions,
topic requests, view upcoming session dates and
topics, sign up to get regular updates
48
https://devgym.oracle.com/pls/apex/dg/office_hours/3084
Copyright © 2017, Oracle and/or its affiliates. All rights reserved. |
49
Thanks for attending! See you next time.
https://devgym.oracle.com/pls/apex/dg/office_hours/3084
When Graphs Meet Machine Learning

When Graphs Meet Machine Learning

  • 1.
    Copyright © 2018,Oracle and/or its affiliates. All rights reserved. Oracle Ask TOM Office Hours: When Graphs Meet Machine Learning Sungpack Hong, Research Director, Oracle Labs Jean Ihm, Product Manager @JeanIhm
  • 2.
    Copyright © 2017,Oracle and/or its affiliates. All rights reserved. | AskTOM sessions on property graphs • Today’s is the sixth session on property graphs • In our past sessions, we showed … – An introduction to Property Graphs, how to model graphs from relational data, perform graph analytics, visualize graphs, query graphs • Today’s topic: When Graphs Meet Machine Learning (use cases) • Visit the Spatial and Graph landing page to view recordings of past sessions; submit feedback, questions, topic requests; view upcoming session dates and topics; sign up 2 https://devgym.oracle.com/pls/apex/dg/office_hours/3084
  • 3.
    Copyright © 2017,Oracle and/or its affiliates. All rights reserved. | 3 The Story So Far …
  • 4.
    Copyright © 2017,Oracle and/or its affiliates. All rights reserved. | Oracle Big Data Spatial and Graph • Available for Big Data platform/BDCS – Hadoop, HBase, Oracle NoSQL • Supported both on BDA and commodity hardware – CDH and Hortonworks • Database connectivity through Big Data Connectors or Big Data SQL • Included in Big Data Cloud Service Oracle Spatial and Graph • Available with Oracle 18c/12.2/DBCS • Using tables for graph persistence • Graph views on relational data • In-database graph analytics – Sparsification, shortest path, page rank, triangle counting, WCC, sub graphs • SQL queries possible • Included in Database Cloud Service 4 Graph Product Options
  • 5.
    Copyright © 2017,Oracle and/or its affiliates. All rights reserved. | Graph Storage Management 5 Architecture of Property Graph Graph Analytics Blueprints/Tinkerpop/Gremlin REST/WebService APIs Java,Groovy,Python,… Scalable and Persistent Storage Oracle NoSQL Database Oracle RDBMS Apache HBase Parallel In-Memory Graph Analytics pgql> SELECT ...
  • 6.
    Copyright © 2017,Oracle and/or its affiliates. All rights reserved. | Graph Analysis for Business Insight 6 Identify Influencers Discover Graph Patterns in Big Data Generate Recommendations
  • 7.
    Copyright © 2017,Oracle and/or its affiliates. All rights reserved. | 7 When Graphs Meet Machine Learning: Use Cases
  • 8.
    Copyright © 2017,Oracle and/or its affiliates. All rights reserved. | Graph Benefits • Why do we want to have graph as data model (as opposed to relational) • Some of graph benefits – Intuitive data model – Fast query over multi-hop relationships – Data visualization and interactive exploration – Enhanced data analysis via graph signals
  • 9.
    Copyright © 2017,Oracle and/or its affiliates. All rights reserved. | Using Graph for Data Analysis • The main idea – Graph captures fine-grained relationships (as edges) between data entities – By using these (materialized) relationships as new signals, – We can extract some useful information about the original data set – … but exactly how?
  • 10.
    Copyright © 2017,Oracle and/or its affiliates. All rights reserved. | Agenda Classical Method: Via Graph Algorithms Generating Features From Graph Algorithms Graph Embedding Techniques 1 2 3 10
  • 11.
    Copyright © 2017,Oracle and/or its affiliates. All rights reserved. | Classical Approach: Graph Algorithms • Starting from graph data model • Apply computational graph algorithms (+ graph queries) – E.g. centrality, reachability, closeness, … – Graph algorithm computes specific characteristics of the graph model – Use the algorithm results to get answer for your question • e.g. what entities are closer to other entities?
  • 12.
    Copyright © 2017,Oracle and/or its affiliates. All rights reserved. | Example – Anomaly Detection in Medicare Data • Using a Public Dataset • From US Center for Medicare and Medicaid Services (CMS) – Health-care Billing Data for CY 2012 – Aggregated medical transactions: 9,153,272 records with 29 variables – Transactions between 880,644 medical providers and CMS with total amounts > $77B for the year • Data Entities – Medical providers (doctors) – Medical procedures – operations, prescription, treatments … – i.e. Who is doing what (and charging it to Medicare)
  • 13.
    Copyright © 2017,Oracle and/or its affiliates. All rights reserved. | • Anomaly Definition – Doctors of the same specialty provide similar services – What if a doctor perform a lot of treatments that typically belong to other specialties? • E.g. a cardiologist doing plastic surgery? • How do we find such cases?  By applying graph algorithm Anomaly and Graph Data Model “There is a spy among us” Dr. Frankenstein, Prescribe Aspirin Optometrists CMS data represented as a graph providers services Approach (sketch) • Pick a specialty • Compute random-walk distance from the doctors of this specialty group • (By applying personalized Pagerank algorithm) • And check if there is any outside-specialty doctors who are exceptionally close to this specialty group
  • 14.
    Copyright © 2017,Oracle and/or its affiliates. All rights reserved. | • False positives – From popular common procedures Procedures Subsequent hospital inpatient care, typically 25 minutes per day Emergency department visit, moderately severe problem Initial hospital inpatient care, typically 70 minutes per day Subsequent hospital inpatient care, typically 35 minutes per day Initial hospital inpatient care, typically 50 minutes per day … Dealing with practical issues (1/2) What Eye-doctor does What every Doctor does Doctor XDoctor Y • We can identify such procedures via another graph algorithm – Pagerank • And do special treatment (details omitted here)
  • 15.
    Copyright © 2017,Oracle and/or its affiliates. All rights reserved. | Dealing with practical issues (2/2) • False positives – From close specialties – Who does similar thing by nature • What we did (details omitted here) – Statistically identify such specialties – Treat them differently Blue: PPR distribution of Optometrists Red: PPR distribution of Opthalmologists Eye doctor Eyeball doctor
  • 16.
    Copyright © 2017,Oracle and/or its affiliates. All rights reserved. | Results • Example of detected anomaly Description of the procedure ID Specialty Removal of eye fluid (vitreous) between the lens and retina 1760485xx6 Gastroenterology Preventive retinal detachment treatment by heat or laser 1760485xx6 Gastroenterology Removal of membrane from the retina … 1760485xx6 Gastroenterology Stomach doctor A stomach doctor doing eye doctor things (and charging those to CMS)
  • 17.
    Copyright © 2017,Oracle and/or its affiliates. All rights reserved. | Other Example -- Bot accounts in SNS network • Identifying Bot Accounts in SNS network – Represent SNS network as Graph – Apply graph algorithm and query – Find bots and their targets which show different communication patterns – Find other bots that are connected via the network
  • 18.
    Copyright © 2017,Oracle and/or its affiliates. All rights reserved. | Algorithmic Approach – Summary and Issues • Apply graph algorithms for data analysis • Still very effective for many problems and applications – Anomaly detection, Influence identification, Customer segmentation, Topic analysis … • Explainability Results based on (deterministic) algorithms computation • Issues – You need to know what algorithm can solve your problem – Want to follow the machine learning (ML) trends • Exploit existing techniques and tools in ML • Combine with other ML models
  • 19.
    Copyright © 2017,Oracle and/or its affiliates. All rights reserved. | Feeding graph data into ML pipeline • Goal: want to apply Machine Learning techniques using graph signals Need some form that are suitable for feeding into conventional ML pipeline but still carries the information in the graph • … How can this be done? Raw Data ML Model graph ……
  • 20.
    Copyright © 2017,Oracle and/or its affiliates. All rights reserved. | Agenda Classical Method: Via Graph Algorithms Generating Features From Graph Algorithms Graph Embedding Techniques 1 2 3 20
  • 21.
    Copyright © 2017,Oracle and/or its affiliates. All rights reserved. | • Approach – Compute (various) graph algorithms to generate some numeric values – Feed the output of graph algorithms into ML model • Rationale – Each graph algorithm result contains certain characteristics of the graph data – Combination of those result would keep information about the graph structure Feature Generation via Graph Algorithm ML Model Raw Data Graph View Apply graph algorithms
  • 22.
    Copyright © 2017,Oracle and/or its affiliates. All rights reserved. | Example from Security Application • Security is an important topic, especially for Cloud – Identity management – Threat Protection – Security management – ... • There are many interesting success stories for using graph for security problems – Cisco, MS, Amazon, …
  • 23.
    Copyright © 2017,Oracle and/or its affiliates. All rights reserved. | Problem: Malware Detection from Network • Goal – Analyze network packet captures (PCAPs) • Traces from malware activities and benign ones – Apply machine learning technique – Leann a model to distinguish malwares activities from benign ones.
  • 24.
    Copyright © 2017,Oracle and/or its affiliates. All rights reserved. | Graph-Based Approach • Approach (from DSN’17) – Rather than analyzing payload of each packet, collect up packet traces as graphs – Extract characteristics of those graphs via graph algorithms – Train model  Differentiate malware traces from normal ones Angler EK serving CryptoWall ransomware on 12/21//2015DSN’17 Observation: Malwares have different trace patterns than normal activities
  • 25.
    Copyright © 2017,Oracle and/or its affiliates. All rights reserved. | • Implementations – Implemented the technique in the paper on top of PGX – Features generation as proposed in the pager: node-size, edge-size, avg-degree, avg-eigen- vector, avg-pagerank, avg-clustering coeff, … – PGX to generate features; ML framework (e.g. TensorFlow) for classification – 510 malware pcaps from https://www.malware-traffic-analysis.net/ – 1110 benign pcaps from https://www.wireshark.org/download/automat ed/captures/ Example in Security Application -- Malware Detection • Data Set : Trace Graph Size Distribution Number of vertices (malware pcaps) Number of vertices (benign pcaps) Number of edges (malware pcaps) Number of edges (benign pcaps)
  • 26.
    Copyright © 2017,Oracle and/or its affiliates. All rights reserved. | • Feature importance (using Random Forests) • Avg-In-Degree (0.191787) • Avg-Out-Degree (0.183539) • Avg-Degree-Centrality (0.170083) • Avg-EigenVector-Centrality (0.106156) • Volume (0.088323) • EdgeSize (0.077220) • Avg-PageRank (0.074146) • NodeSize (0.064597) • Avg-Betweenness-Centrality (0.039565) • Avg-Clustering-Coefficient (0.004584) • (Demo) • Accuracy on test set: 100% (Random Forests), 99.69% (CNN) • Confusion matrix: (tn: 224, fp: 0, fn: 0, tp: 100) Confidential – Oracle Internal/Restricted/Highly Restricted 26 Exploration Result
  • 27.
    Copyright © 2017,Oracle and/or its affiliates. All rights reserved. | Agenda Classic Method: Applying Graph Algorithms Generating Features From Graph Algorithms Graph Embedding Techniques 1 2 3 27
  • 28.
    Copyright © 2017,Oracle and/or its affiliates. All rights reserved. | Safe Harbor Statement The following is intended to outline our general product direction. It is intended for information purposes only, and may not be incorporated into any contract. It is not a commitment to deliver any material, code, or functionality, and should not be relied upon in making purchasing decisions. The development, release, timing, and pricing of any features or functionality described for Oracle’s products may change and remains at the sole discretion of Oracle Corporation. 28
  • 29.
    Copyright © 2017,Oracle and/or its affiliates. All rights reserved. | Notice • Contents in this section discuss recent techniques for combining graphs and machine learning • Some of these techniques are experimentally implemented in Oracle Labs • Therefore they are not part of the Oracle Graph products
  • 30.
    Copyright © 2017,Oracle and/or its affiliates. All rights reserved. | Machine Learning and Graphs (revisit) • Still there are issues – Applied seemingly arbitrary set of algorithms for extracting features – Would it work for other applications?  Need a systematic methodology that turns graph information into n-dimensional numeric representation, i.e. embedding We discuss two embedding techniques: vertex embedding and graph embedding Raw Data ML Model Graph Representation Numeric Representation (N-dimensional vector) per vertex Raw Data ML Model Multiple Graph Representations Numeric Representation (N-dimensional vector) per graph Vertex Embedding Graph(let) Embedding
  • 31.
    Copyright © 2017,Oracle and/or its affiliates. All rights reserved. | Vertex Embedding • Goal: to turn graph into n-dimensional vector • Want to keep graph (topology) information – i.e. Entity distance in distance Rhicheek Patra, Oracle Labs (ML Summit 2018) 31 Raw Data ML Model Graph Representation Numeric Representation (N-dimensional vector) x, y: data entity (represented as vertex in graph) v(x), v(y): n- dimensional vector representation of x and y x, y close in graph  v(x) - v(y) close in vector space
  • 32.
    Copyright © 2017,Oracle and/or its affiliates. All rights reserved. | • There are several approaches now – Academia and Industry • DeepWalk – An early approach that exploits techniques from modern NLP – Word2Vec : a ML technique that learns closeness between words from large number of sentences – Perform many random walks on the graph and generate traces. – Apply W2V technique on them; treating vertices as words. Rhicheek Patra, Oracle Labs (ML Summit 2018) 32 How to achieve this? KDD‘14
  • 33.
    Copyright © 2017,Oracle and/or its affiliates. All rights reserved. | • Note: you can consider this as a mock-up of customer segmentation problem – Student => Customer – Course taking => Item or service purchase – Department => Segmentation label Example • Student classification – A real dataset from university – Can you predict a student’s major or department just by looking at the classmates in the course that (s)he is taking? Rhicheek Patra, Oracle Labs (ML Summit 2018) 33 CS ME 10.003 10.004 10.005 11.103 11.213 12.118 students courses
  • 34.
    Copyright © 2017,Oracle and/or its affiliates. All rights reserved. | • (Result #1) Graph-based prediction gives better result than naïve application of ML (e.g. CNN) on basic student features (e.g. age, gender, background, …) • (Result #2) Deep-Walk preserves information from graph representation • (Result #3) Deep-Walk allows to combined graph data with other features Results CNN on Original Features PPR (Graph Algorithm) CNN on Extracted Graph Features (from deep-walk) CNN on Original + Graph Features
  • 35.
    Copyright © 2017,Oracle and/or its affiliates. All rights reserved. | Graph(let) Embedding • Objective – Want to capture closeness (similarity) between graph instances • Example – What classic literatures look more similar. from their character relationships? Odyssey Beowulf Romeo & Juliet Hamlet Want to have a systematic way to extract features of these graphs and compare/classify them Need to capture irregular structure: • Arbitrary edges between vertices • Varying size (# of vertices and #edges) • Labels or properties defined on vertices and edges
  • 36.
    Copyright © 2017,Oracle and/or its affiliates. All rights reserved. | • Similarly applying sequence-based learning – i.e: Paragraph2Vec  learn from large text corpus. Paragraphs composed of similar words are close in embedding space – Consider each graph as paragraph – Generate random-walk on each graphs to generate traces. – Apply Paragraph2Vec model to learn similarity between graphs • Added our own improvements Graph(let) Embedding – How to approach this? (1) Tricks for encoding multiple properties (2) When generating traces, consider edges as words (instead of vertices) (3) Considering certain global properties of each graph -- e.g. size of graph …
  • 37.
    Copyright © 2017,Oracle and/or its affiliates. All rights reserved. | Graph(let) Embedding – Cheminformatics Example • (Demo) • Two Datasets from cheminformatics – National Cancer Institute (NCI109) • #Graphs: 4127 • #Vertices: ranges from 35 to 111 • #Edges: ranges from 152 to 476 • Cancer types (binary classification) – Proteins • #Graphs: 1113 • #Vertices: ranges from 9 to 620 • #Edges: ranges from 64 to 4048 • Protein types (binary classification) PG2VEC (ours) PG2VEC (ours) Notes • Graph2Vec is naïve implementation of paragraph2vec on graph • Our improvements made a big difference in quality of answer for both dataset
  • 38.
    Copyright © 2017,Oracle and/or its affiliates. All rights reserved. | • AML (Anti-money laundering) – More serious application from collaboration with FCCM team – Online Step • Transactions are monitored real-time • Any suspicious activity is flagged (lots of false-positives) – Offline Step (Correlation) • Flags(alerts) are attached to the global financial graph • Identify entities and flags that are closed connected from the graph •  Each subgraph creates a case Other Example – Anti-Money Laundering AlertA AlertB AlertA AlertB AlertC Case 1 Case 2 AlertA AlertA Case 3 – Evaluation Step • Compute certain functions on each case to evaluate its risk factor • Human (investigator) makes decision – Looks serious  Proceed to official investigation – Looks benign  close the case – Don’t know yet. Keep it open  wait to see if more flags will happen Algorithmic approach Graph ML to help making this decision?
  • 39.
    Copyright © 2017,Oracle and/or its affiliates. All rights reserved. | • Task #1 – Given a new case, can we find existing cases in history that look similar to this one? (as a reference for investigator) : Use Pg2Vec to train and find Graph(let) Embedding – Anti-Money Laundering • Task #2 – Train from existing cases, learn a classifier – i.e. system recommends that “this case looks serious. Recommended for official investigation”
  • 40.
    Copyright © 2017,Oracle and/or its affiliates. All rights reserved. | Graphs Machine Learning: Recent Trends • By the way, combining graph and machine learning is a trend – Many in industry and academia are looking at this problem – And applying it to solving real problems 40 Pinterest Alibaba Google
  • 41.
    Copyright © 2017,Oracle and/or its affiliates. All rights reserved. | Current Directions • Improving Scalability – Increasing the size of graph (e.g. tens of billions of vertices) • Combining structure (relationship) and other raw observation – E.g. Item attributes + Co-purchase Information – Finding more elegant solution than simple ensemble techniques Rhicheek Patra, Oracle Labs (ML Summit 2018) 41
  • 42.
    Copyright © 2017,Oracle and/or its affiliates. All rights reserved. | Summary • Use graph signals (relationships between entities) for data analysis • Applying graph algorithms • Combining graph with Machine learning – embedding techniques • Many applications
  • 43.
    Copyright © 2017,Oracle and/or its affiliates. All rights reserved. | • We have an implementation in our graph package (PGX) [BETA only, not in product] – Load graph model – Compute graph embedding – Query embedding directly on graph – Export graph embedding Rhicheek Patra, Oracle Labs (ML Summit 2018) 43 Sounds complicated, how can I use this technique easily? PGX (Graph) Database or Files Embedding Export Other ML Framework
  • 44.
    Copyright © 2017,Oracle and/or its affiliates. All rights reserved. | 44 Resources
  • 45.
    Copyright © 2017,Oracle and/or its affiliates. All rights reserved. | Resources • Oracle Spatial and Graph on OTN www.oracle.com/technetwork/database/options/spatialandgraph White papers, software downloads, documentation and videos • Use cases and examples at OpenWorld ’18 Graph presentations page: https://tinyurl.com/GraphOOW18 • Blog – examples, tips & tricks blogs.oracle.com/oraclespatial • YouTube channel: https://tinyurl.com/OracleGraphYouTube • Oracle Big Data Lite Virtual Machine - a free sandbox to get started www.oracle.com/technetwork/database/bigdata-appliance/oracle-bigdatalite-2104726.html – Hands On Lab included in /opt/oracle/oracle-spatial-graph/ or http://github.com/oracle/BigDataLite/ 45
  • 46.
    Copyright © 2017,Oracle and/or its affiliates. All rights reserved. | Resources – social media and online communities • Follow the product team: @SpatialHannes, @JeanIhm, @agodfrin • Oracle Spatial and Graph SIG user groups (search “Oracle Spatial and Graph Community”) 46
  • 47.
    Copyright © 2017,Oracle and/or its affiliates. All rights reserved. | Analytics and Data Summit All Analytics. All Data. No Nonsense. March 12 – 14, 2019 Formerly called the BIWA Summit with the Spatial and Graph Summit Same great technical content…new name! www.AnalyticsandDataSummit.org Call for Speakers now open! Submit an abstract to share your use case or technical session by Jan. 7
  • 48.
    Copyright © 2017,Oracle and/or its affiliates. All rights reserved. | AskTOM sessions on property graphs • Next Spatial and Graph session in Jan/Feb – Topic to be announced – stay tuned • View recordings, submit feedback, questions, topic requests, view upcoming session dates and topics, sign up to get regular updates 48 https://devgym.oracle.com/pls/apex/dg/office_hours/3084
  • 49.
    Copyright © 2017,Oracle and/or its affiliates. All rights reserved. | 49 Thanks for attending! See you next time. https://devgym.oracle.com/pls/apex/dg/office_hours/3084

Editor's Notes

  • #5 Oracle provides two products for graph data management and analysis: Big Data Spatial and Graph (BDSG) Oracle Spatial and Graph Customers have been requesting to develop graph based applications on either platform, based on their underlying business requirements. Application developers have a choice of which platform to develop a graph solution.
  • #7 Graph features allow you, among many other things, to efficiently: *extract implicit information from your data using graph analytics *discover graph patterns in big data, such as communities and influencers *generate recommendations based on interests, profiles, and past behaviors
  • #27 http://slc15bna.us.oracle.com:7008/?root=notebooks&notebook=dsw6Yq44w
  • #36 Odyssey, Beowulf are more star-shaped, characters have relationship around the main character; while Hamlet has more interactions between sub characters
  • #46 Here are various resources for more information on the Big Data Spatial and Graph product. Our product pages include data sheets, trial downloads, documentation The Big Data Lite VM is a free sandbox environment that you can download to quickly get started using Oracle’s Big Data platform components including Big Data Spatial and Graph, Oracle Database, and several other technologies – also a great way to get your feet wet You can also find a Hands on Lab where you can work with the vector and raster features we’ve shown today Check out the blog for examples and code samples We’re on social media at these handles Finally, if you are planning to attend the Oracle OpenWorld 2016 conference in San Francisco this fall, we’ll have a number of sessions, labs, and demos around the big data and cloud technologies.
  • #48 We’d like to mention an upcoming conference that may be of interest. The Analytics and Data Summit (formerly BIWA) will be held with the Oracle Spatial & Graph Summit, in March 2019 at Oracle’s headquarters in Redwood Shores, will include technical content spanning Big Data, Analytics, Spatial & Graph, Cloud, and IoT technologies. This is the premier event for Spatial + Graph, featuring thought leaders, and experts from Oracle as well as our partner and customer community worldwide. The agenda includes technical sessions, and hands on labs for you to get deep dives and work with the technologies, and customer use cases. The call for speakers is now open, and presentations are being selected. We encourage you to submit your use case studies highlighting Oracle’s spatial, graph, analytics, cloud, big data technologies for consideration. We invite you to consider joining us for this event. Call for speakers and registration are now open at www.analyticsanddatasummit.org . A more detailed list of sessions + speakers is available at the event website.