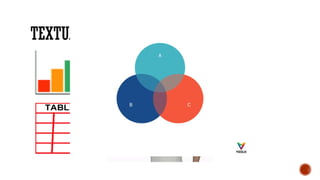
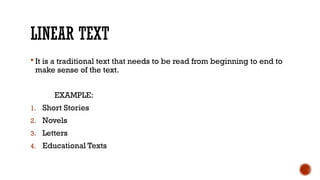
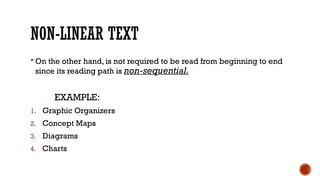
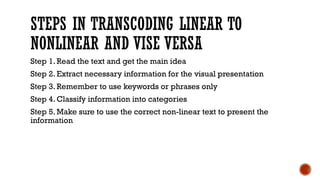
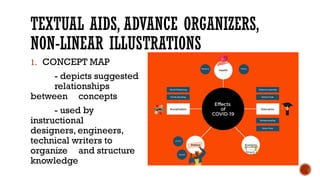
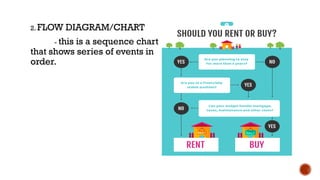
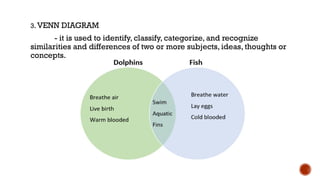
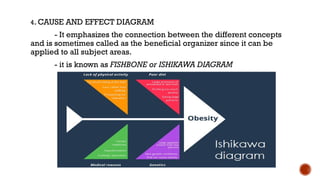
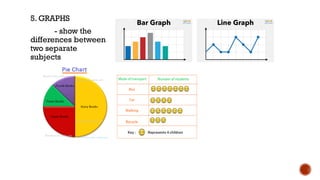
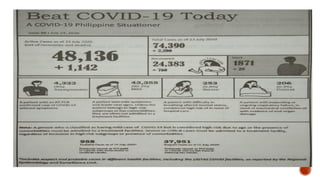
OBJECTIVES:
At the end of the lesson, the learners are expected to;
1. to identify information portrayed in graphics and other non-linear texts
2. convert non-linear information to textual information and vise versa
REVIEW ON VARIOUS SOURCES OF INFORMATION
TERTIARY SECONDARY
PRIMARY
SOURCES OF INFORMATION
1. PRIMARY
2. SECONDARY
3. TERTIARY
TEXTUAL AIDS
TEXTUAL AIDS IN
UNDERSTANDING TEXTS
Quarter I:Week 2
LINEAR AND NON-LINEAR TEXTS
LINEAR TEXT
 It is a traditional text that needs to be read from beginning to end to
make sense of the text.
EXAMPLE:
1. Short Stories
2. Novels
3. Letters
4. Educational Texts
NON-LINEAR TEXT
 On the other hand, is not required to be read from beginning to end
since its reading path is non-sequential.
EXAMPLE:
1. Graphic Organizers
2. Concept Maps
3. Diagrams
4. Charts
STEPS IN TRANSCODING LINEAR TO
NONLINEAR AND VISE VERSA
Step 1. Read the text and get the main idea
Step 2. Extract necessary information for the visual presentation
Step 3. Remember to use keywords or phrases only
Step 4. Classify information into categories
Step 5. Make sure to use the correct non-linear text to present the
information
TEXTUAL AIDS, ADVANCE ORGANIZERS,
NON-LINEAR ILLUSTRATIONS
1. CONCEPT MAP
- depicts suggested
relationships
between concepts
- used by
instructional
designers, engineers,
technical writers to
organize and structure
knowledge
2. FLOW DIAGRAM/CHART
- this is a sequence chart
that shows series of events in
order.
3. VENN DIAGRAM
- it is used to identify, classify, categorize, and recognize
similarities and differences of two or more subjects, ideas, thoughts or
concepts.
4. CAUSE AND EFFECT DIAGRAM
- It emphasizes the connection between the different concepts
and is sometimes called as the beneficial organizer since it can be
applied to all subject areas.
- it is known as FISHBONE or ISHIKAWA DIAGRAM
5. GRAPHS
- show the
differences between
two separate
subjects
Textual aids in understanding texts.pptx

Textual aids in understanding texts.pptx

  • 1.
    OBJECTIVES: At the endof the lesson, the learners are expected to; 1. to identify information portrayed in graphics and other non-linear texts 2. convert non-linear information to textual information and vise versa
  • 2.
    REVIEW ON VARIOUSSOURCES OF INFORMATION TERTIARY SECONDARY PRIMARY
  • 3.
    SOURCES OF INFORMATION 1.PRIMARY 2. SECONDARY 3. TERTIARY
  • 4.
  • 5.
    TEXTUAL AIDS IN UNDERSTANDINGTEXTS Quarter I:Week 2
  • 6.
  • 7.
    LINEAR TEXT  Itis a traditional text that needs to be read from beginning to end to make sense of the text. EXAMPLE: 1. Short Stories 2. Novels 3. Letters 4. Educational Texts
  • 8.
    NON-LINEAR TEXT  Onthe other hand, is not required to be read from beginning to end since its reading path is non-sequential. EXAMPLE: 1. Graphic Organizers 2. Concept Maps 3. Diagrams 4. Charts
  • 9.
    STEPS IN TRANSCODINGLINEAR TO NONLINEAR AND VISE VERSA Step 1. Read the text and get the main idea Step 2. Extract necessary information for the visual presentation Step 3. Remember to use keywords or phrases only Step 4. Classify information into categories Step 5. Make sure to use the correct non-linear text to present the information
  • 10.
    TEXTUAL AIDS, ADVANCEORGANIZERS, NON-LINEAR ILLUSTRATIONS 1. CONCEPT MAP - depicts suggested relationships between concepts - used by instructional designers, engineers, technical writers to organize and structure knowledge
  • 11.
    2. FLOW DIAGRAM/CHART -this is a sequence chart that shows series of events in order.
  • 12.
    3. VENN DIAGRAM -it is used to identify, classify, categorize, and recognize similarities and differences of two or more subjects, ideas, thoughts or concepts.
  • 13.
    4. CAUSE ANDEFFECT DIAGRAM - It emphasizes the connection between the different concepts and is sometimes called as the beneficial organizer since it can be applied to all subject areas. - it is known as FISHBONE or ISHIKAWA DIAGRAM
  • 14.
    5. GRAPHS - showthe differences between two separate subjects