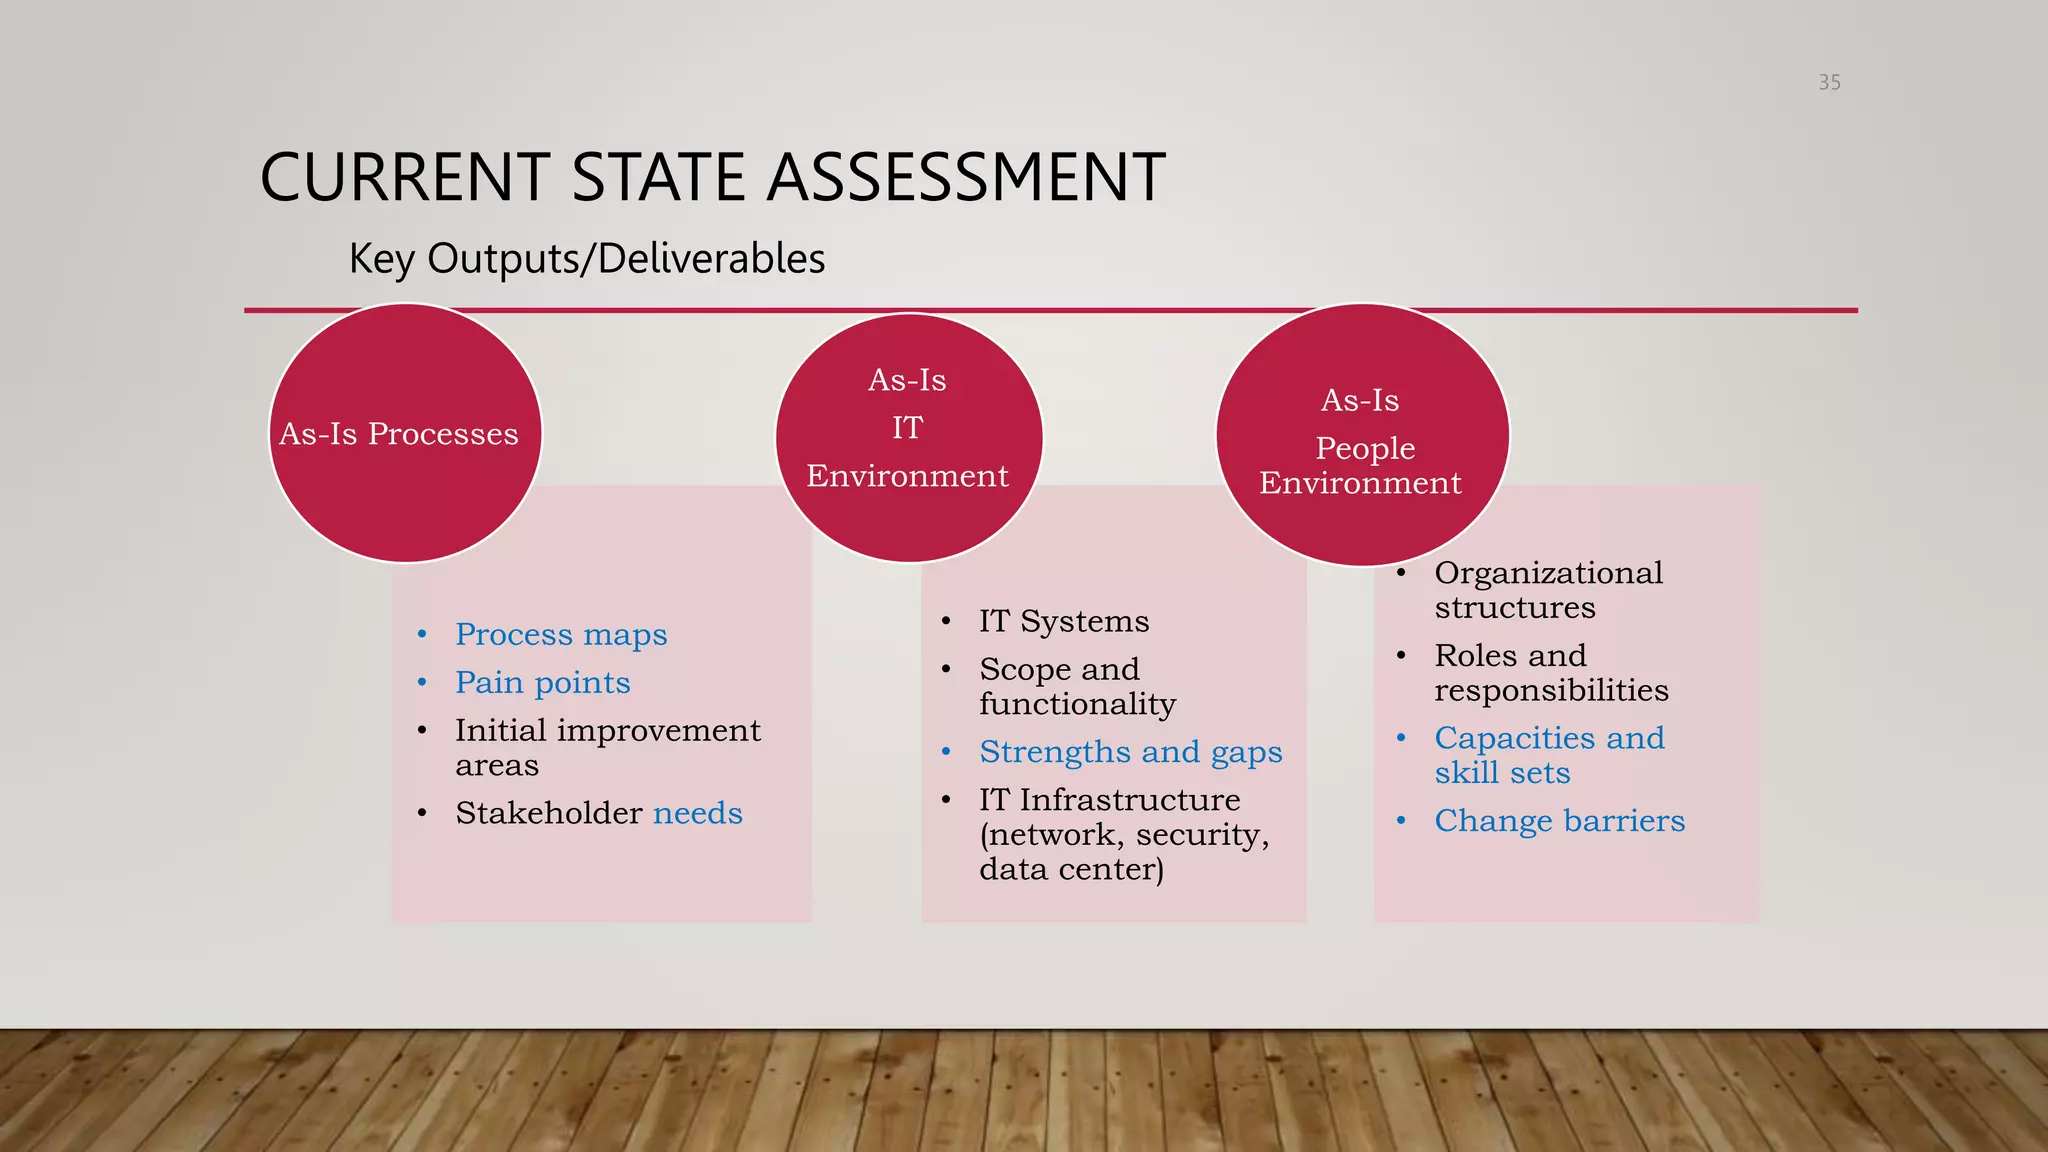
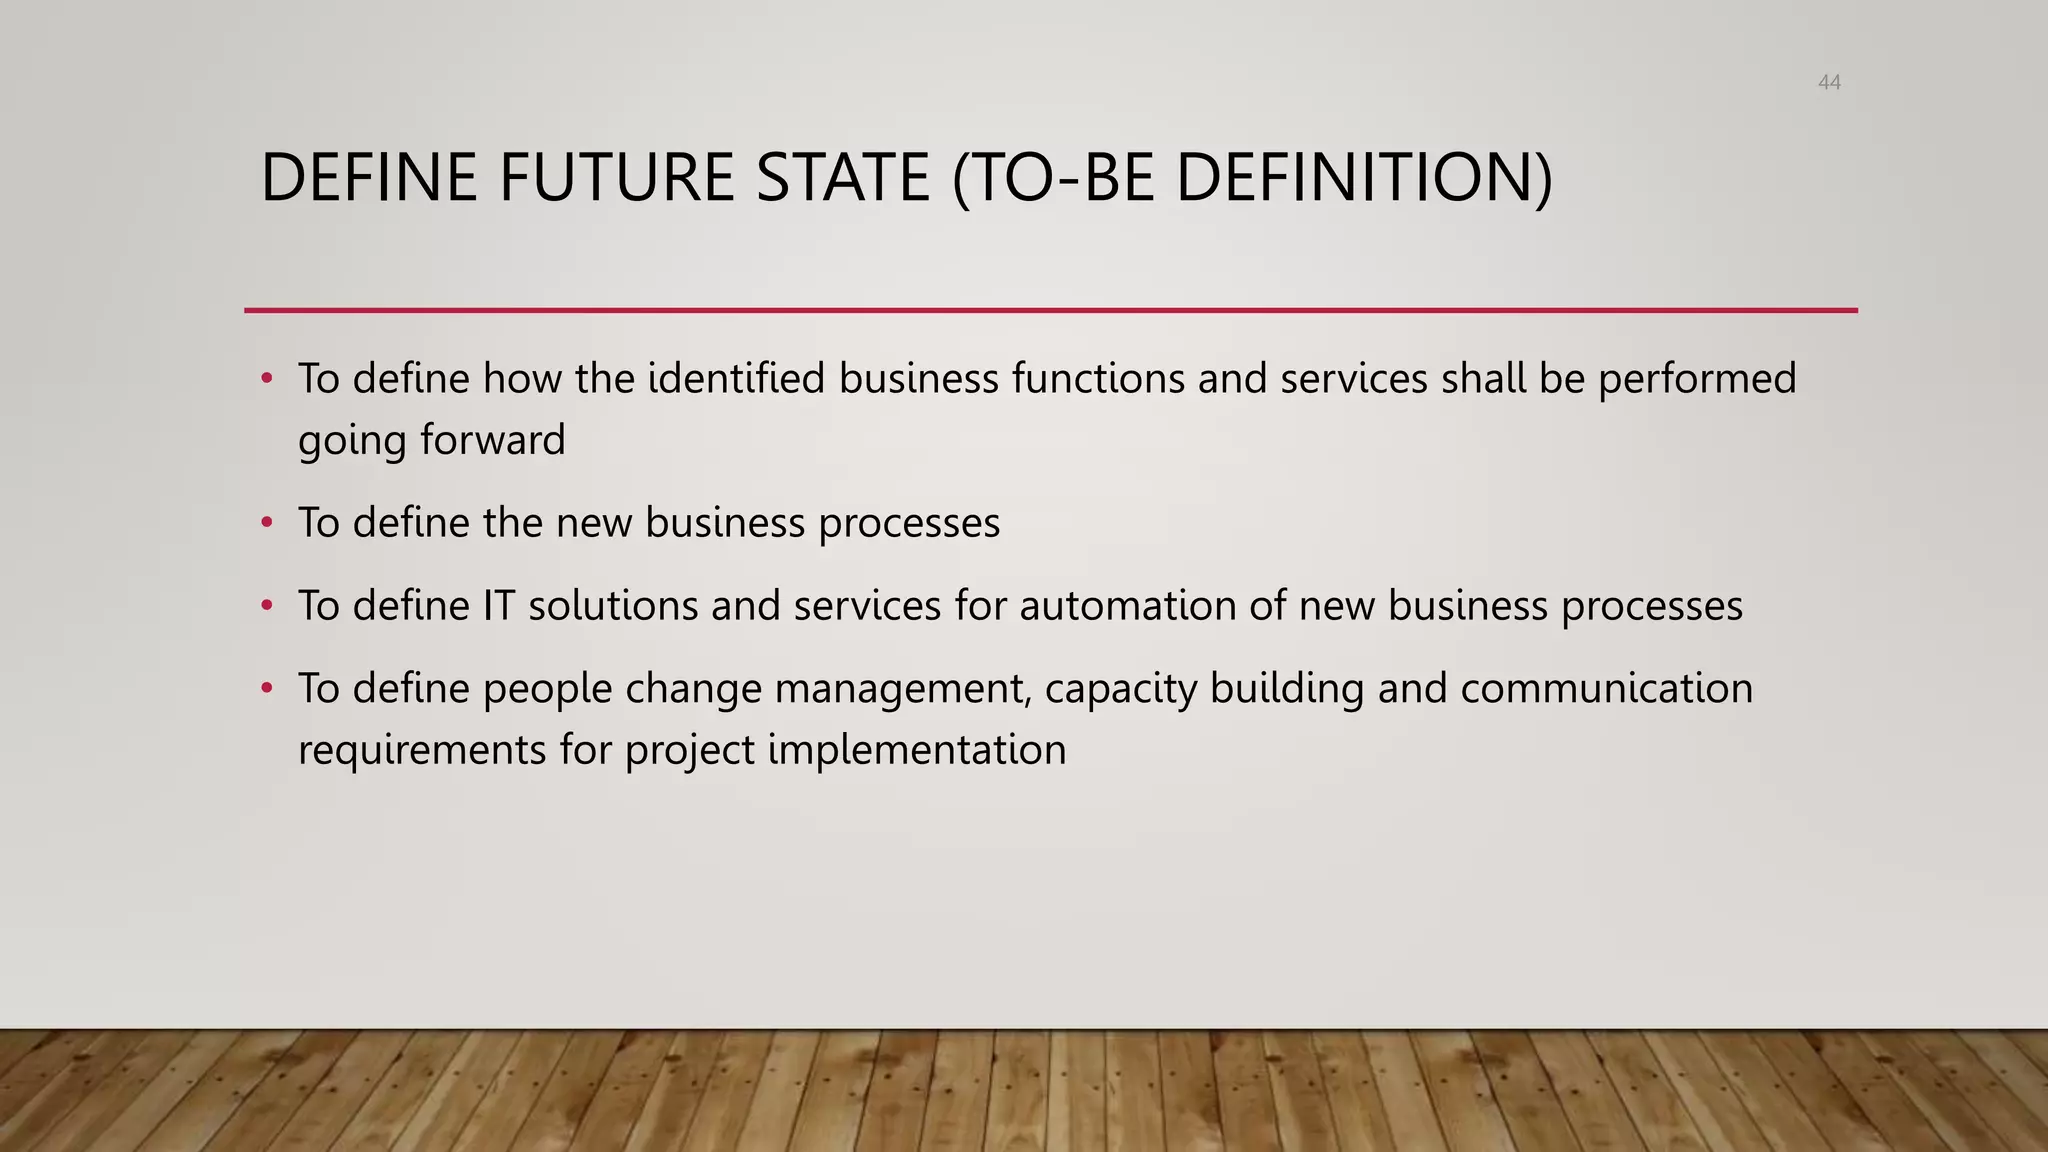
8. WE THE PEOPLE
A welfare state is a concept of government in which the state plays a key role in the
protection and promotion of economic and social well-being of its citizens. It is based on
the principles of equality of opportunity and equitable distribution of wealth.
Welfare State
9. IS OUR SYSTEM EFFICIENT?
Excellent
Very Good
Good
Average
Poor
10. WHAT IS GPR?
GPR is fundamental rethinking and radical redesign of
Government processes to achieve dramatic improvements in
critical contemporary measures of performance such as Cost,
quality, service and speed.
10
− Based on definition of BPR by Hammer & Champy Hammer who
coined the term “reengineering” in his 1990 HBR article
11. WHY ORGANIZATIONS DO GPR/BPR?
• To address the specific concerns of the stakeholders (citizens/Businesses/
employees)
• To address the challenges and issues in the services and service delivery
• To improve the quality of the services
• To adopt best practices from similar environments
• To address the changing needs of the customers (citizens and businesses)
and the government
11
In nutshell, GPR is undertaken to address ‘problems’ or
‘needs’ of the organization or its customers with an
objective to improve the overall quality of the services
12. ARE GOVERNMENT EMPLOYEES EFFICIENT?
YES, AN EMPHATIC YES
ARE PROCESSES EFFICIENT?
NO, CERTAINLY NO
WHY?
• Processes are designed in accordance with the legislation governing that
particular domain
• Some of these Legislations may be old and antiquated
12
13. ARE GOVERNMENT EMPLOYEES EFFICIENT?
• Basis of the legal system is to put in controls, and not better service
delivery
• Acts are department-centric, not citizen-centric
• Rules are complex and tedious
• 10,000 rules, 0.1 million forms!
14. SOME RECENT DEVELOPMENTS
• Rapid increase in the number schemes, projects and plans.
• Increase in the number of transactions per scheme.
• Huge and increasing data-base.
• Urgent need for transparency, speedy information.
• Higher administrative efficiency and accountability.
• Disseminating information to the public and other agencies.
• Transmission of information to Government.
• Increased workload especially paperwork
14
15. GOVERNMENT PROCESSES OVER TIME
• Business Processes are generally simple & efficient when originally designed. They are also user-
friendly and deploy contemporary tools & techniques.
• Processes become complex & inefficient with passage of time: (HOW?)
• with addition of sub-processes to handle exceptions
• with changes in environment
• with increase in customer expectations
• with increase in volumes
• We therefore need to Reinvent the business processes
15
16. GOVERNMENT PROCESS RE-ENGINEERING CAN
• Increase the speed at which document intensive processes are conducted and reduce associated costs and administrative burdens
• Add flexibility to organisational processes, allowing your business to scale up or down as required by customer or internal demand
• Help reduce capital expenditure by reducing the need to invest in the assets required to perform a service internally
• Organise information and documents with electronic document management systems and processes, for example transition to electronic invoicing
• Minimise document loss and information leakage
• Utilise electronic document formats more often in internal and customer transactions
• Improve operational efficiency and customer service levels
• Mitigate risk by improving compliance to legal requirement
16
17. WHAT IS GPR?
GPR is fundamental rethinking and radical redesign of
Government processes to achieve dramatic improvements in
critical contemporary measures of performance such as Cost,
quality, service and speed.
18
− Based on definition of BPR by Hammer & Champy Hammer who
coined the term “reengineering” in his 1990 HBR article
18. WHY ORGANIZATIONS DO GPR/BPR?
• To address the specific concerns of the stakeholders (citizens/Businesses/
employees)
• To address the challenges and issues in the services and service delivery
• To improve the quality of the services
• To adopt best practices from similar environments
• To address the changing needs of the customers (citizens and businesses)
and the government
19
In nutshell, GPR is undertaken to address ‘problems’ or
‘needs’ of the organization or its customers with an
objective to improve the overall quality of the services
19. ARE GOVERNMENT EMPLOYEES EFFICIENT?
YES, AN EMPHATIC YES
ARE PROCESSES EFFICIENT?
NO, CERTAINLY NO
WHY?
• Processes are designed in accordance with the legislation governing that particular domain
• Some of these Legislations may be old and antiquated
• Basis of the legal system is to put in controls, and not better service delivery
• Acts are department-centric, not citizen-centric
• Rules are complex and tedious
• 10,000 rules, 0.1 million forms!
20
20. SOME RECENT DEVELOPMENTS
• Rapid increase in the number schemes, projects and plans.
• Increase in the number of transactions per scheme.
• Huge and increasing data-base.
• Urgent need for transparency, speedy information.
• Higher administrative efficiency and accountability.
• Disseminating information to the public and other agencies.
• Transmission of information to Government.
• Increased workload especially paperwork
21
21. GOVERNMENT PROCESSES OVER TIME
• Business Processes are generally simple & efficient when originally designed. They are also user-
friendly and deploy contemporary tools & techniques.
• Processes become complex & inefficient with passage of time: (HOW?)
• with addition of sub-processes to handle exceptions
• with changes in environment
• with increase in customer expectations
• with increase in volumes
• We therefore need to Reinvent the business processes
22
22. GOVERNMENT PROCESS RE-ENGINEERING CAN
• Increase the speed at which document intensive processes are conducted and reduce associated costs and administrative burdens
• Add flexibility to organisational processes, allowing your business to scale up or down as required by customer or internal demand
• Help reduce capital expenditure by reducing the need to invest in the assets required to perform a service internally
• Organise information and documents with electronic document management systems and processes, for example transition to electronic invoicing
• Minimise document loss and information leakage
• Utilise electronic document formats more often in internal and customer transactions
• Improve operational efficiency and customer service levels
• Mitigate risk by improving compliance to legal requirement
23
23. PERFORMANCE INDICATORS
Cost indicator
Time indicator
Demand indicator
Productivity indicator
A comparison of these measures for the old and redesigned
process will show the improvement achieved in performance.
24. ARE GOVERNMENT EMPLOYEES EFFICIENT?
YES, AN EMPHATIC YES
ARE PROCESSES EFFICIENT?
NO, CERTAINLY NO
WHY?
• Processes are designed in accordance with the legislation governing that
particular domain
• Some of these Legislations may be old and antiquated
27
25. ARE GOVERNMENT EMPLOYEES EFFICIENT?
• Basis of the legal system is to put in controls, and not better service
delivery
• Acts are department-centric, not citizen-centric
• Rules are complex and tedious
• 10,000 rules, 0.1 million forms!
26. SOME RECENT DEVELOPMENTS
• Rapid increase in the number schemes, projects and plans.
• Increase in the number of transactions per scheme.
• Huge and increasing data-base.
• Urgent need for transparency, speedy information.
• Higher administrative efficiency and accountability.
• Disseminating information to the public and other agencies.
• Transmission of information to Government.
• Increased workload especially paperwork
29
27. GOVERNMENT PROCESSES OVER TIME
• Business Processes are generally simple & efficient when originally designed. They are also user-
friendly and deploy contemporary tools & techniques.
• Processes become complex & inefficient with passage of time: (HOW?)
• with addition of sub-processes to handle exceptions
• with changes in environment
• with increase in customer expectations
• with increase in volumes
• We therefore need to Reinvent the business processes
30
28. GOVERNMENT PROCESS RE-ENGINEERING CAN
• Increase the speed at which document intensive processes are conducted and reduce
associated costs and administrative burdens
• Add flexibility to organisational processes, allowing your business to scale up or down
as required by customer or internal demand
• Help reduce capital expenditure by reducing the need to invest in the assets required
to perform a service internally
• Organise information and documents with electronic document management systems
and processes, for example transition to electronic invoicing
• Minimise document loss and information leakage
31
29. • Organise information and documents with electronic document
management systems and processes, for example transition to electronic
invoicing
• Minimise document loss and information leakage
• Utilise electronic document formats more often in internal and customer
transactions
• Improve operational efficiency and customer service levels
• Mitigate risk by improving compliance to legal requirement
30. CURRENT STATE ASSESSMENT
To perform an in-depth assessment of business functions and services identified for
coverage under e-Governance project to understand:
• Current approach for performing the business functions and service delivery
• The key challenges and to identify improvement areas
• Stakeholder needs and expectations
• Good practices and learnings from similar implementations in similar domains
• Current systems (IT) implemented in the department, coverage and gaps
• Organization structures and people capacities etc.
33
32. • Process maps
• Pain points
• Initial improvement
areas
• Stakeholder needs
As-Is Processes
• IT Systems
• Scope and
functionality
• Strengths and gaps
• IT Infrastructure
(network, security,
data center)
As-Is
IT
Environment
• Organizational
structures
• Roles and
responsibilities
• Capacities and
skill sets
• Change barriers
As-Is
People
Environment
CURRENT STATE ASSESSMENT
Key Outputs/Deliverables
35
33. PROCESS MAPPING
UNDERSTANDING HOW THINGS HAPPEN “ACTUALLY”
Why Process Mapping?
• To understand “how do we actually work” as opposed to “how are we supposed to work”
• To understand the four attributes of process:
• Players
• Process flow
• Policies, Standards and Responsibilities
• Phases with clear start & end-points and process time-lines
• To identify the Critical to Process metrics
• To identify “Quick Wins” in the process
• To understand response time & cycle time
• To determine process efficiency
• Value-added activities
• Non value-added activities
• To estimate the cost of the process
• The concept of waste
36
34. TYPES OF PROCESS MAPPING
• Process mapping can be done at various levels of detail
• Value Stream Mapping
• Mapping the entire value stream of the process on a single page
• SIPOC Map (Supplier – Input – Process – Output – Customer)
• Mapping the key constituents of the process and their interactions
• Flowcharting
• Detailed activity / task level graphical representation of the process
37
35. FLOW DIAGRAMS
38
" Draw a flowchart for whatever you do.
Until you do, you do not know what you are
doing, you just have a job.”
Dr. W. Edwards Deming
36. WHAT IS PROCESS ANALYSIS
39
A step-by-step breakdown of the phases of a process,
used to convey the inputs, outputs, and operations that take
place during each phase.
It can be used to improve understanding of how the process
operates, and to determine potential targets for process
improvement through removing waste and
increasing efficiency.
37. IDENTIFYING ROOT CAUSES
• Once current processes have been documented along with the data (relevant CTPs) it is useful to
identify the root causes of problems and non-value adding activities in processes.
• Identifying the root cause of process dysfunction enables you to ensure that the process
redesign solves the root cause, rather than simply addressing a symptom of a problem that will
occur again.
• It also allow you to determine how many processes are affected by a single root cause. The more
process problems a root cause creates, the higher priority it is for being addresses quickly and
effectively.
40
38. INDICATORS OF POOR PROCESS
• Too much movement
• Too much re-entry and or copying
• Standard formats not easily available
• Process too much disintegrated
• Process needs many manual inputs requiring references from other documents
• Customers need to provide same information and or data multiple times
• Activities, information, data that does not serve any purpose and can be eliminated
• Activities, information, data, documents that can be integrated
• Activities, process can be simplified
• Activities, process, information, data that can be automated
• Process where 3 major benefits of Information Technology viz. Independence from PLACE, TIME & PERSON can be utilized.
• The process is ‘MULTIPLE WINDOW’
41
39. A CAUSE-EFFECT DIAGRAM
• Why use it?
• To help the team organize and graphically display all the knowledge
it has about the problem
• What does it do?
• It helps unearth all possible causes for the problem at hand by
capturing views of all members
• It creates a consensus around the problem and builds support for
resulting solutions
• It focuses the team on causes rather than symptoms
• Organizing data serves as a guide for discussion and inspires more
ideas.
It is a structured approach to exhaustively determine
perceived sources (causes) of a problem (effect)
40. THE FISHBONE DIAGRAM
• Ishikawa diagrams (also called
fishbone diagrams or cause-and-effect
diagrams) are diagrams that show the
causes of a certain event.
• They were first proposed in the 1960s,
by Kaoru Ishikawa who pioneered
quality management processes in the
Kawasaki shipyards, and in the process
became one of the founding fathers of
modern management. They are
considered one of the seven basic
tools of quality control.
41. DEFINE FUTURE STATE (TO-BE DEFINITION)
• To define how the identified business functions and services shall be performed
going forward
• To define the new business processes
• To define IT solutions and services for automation of new business processes
• To define people change management, capacity building and communication
requirements for project implementation
44
42. Key Outputs /Deliverables
• To-be business
processes
• New process
KPIs/metrics
• Changes to the
legal and policy
environment
To-be
Processes
• Functional Architecture
and Requirements
specifications
• Enterprise Architecture
covering Application,
data, network, security,
data center architecture
• Data digitization and
migration strategy
• SLAs
To-Be
IT
Environment
• Institutional
structures needed
for project
implementation
• Training and
Capacity building
plan
• Change Management
Plan
• Communications
Management Plan
To-be
People
Environment
DEFINE FUTURE STATE (TO-BE DEFINITION)
45
43. ESTIMATING THE VALUE ADDED RATIO
• Customer-Value Added (CVA)
• An activity required to provide what the customer is paying for.
• Business-Value Added (BVA)
• An activity required by the business to serve the customer.
• Value Added ratio (VAR) = Sum of Active Time Spent on Value Added Activities / Total
Elapsed Time * 100
Example:
• Sum of Active Time Spent on Value Added Activities = 1.5 hours
• Total Elapsed Time = 2 days = 48 hours
• VAR = (1.5 hours / 48 hours) x 100 = 3.1%
46
44. DEFINITION OF KEY METRICS
• The key metrics (CTQs & CTPs) of the process acts as indicators of how the
process has improved post GPR
• From the data collected on the CTQs and CTPs, the baseline metrics can be
obtained
• Post roll-out of GPR, these metrics can be tracked for continuous improvement
using Process Quality Information Systems (PQIS)
47
45. PERFORMANCE INDICATORS
Cost indicator
Time indicator
Demand indicator
Productivity indicator
A comparison of these measures for the old and redesigned
process will show the improvement achieved in performance.