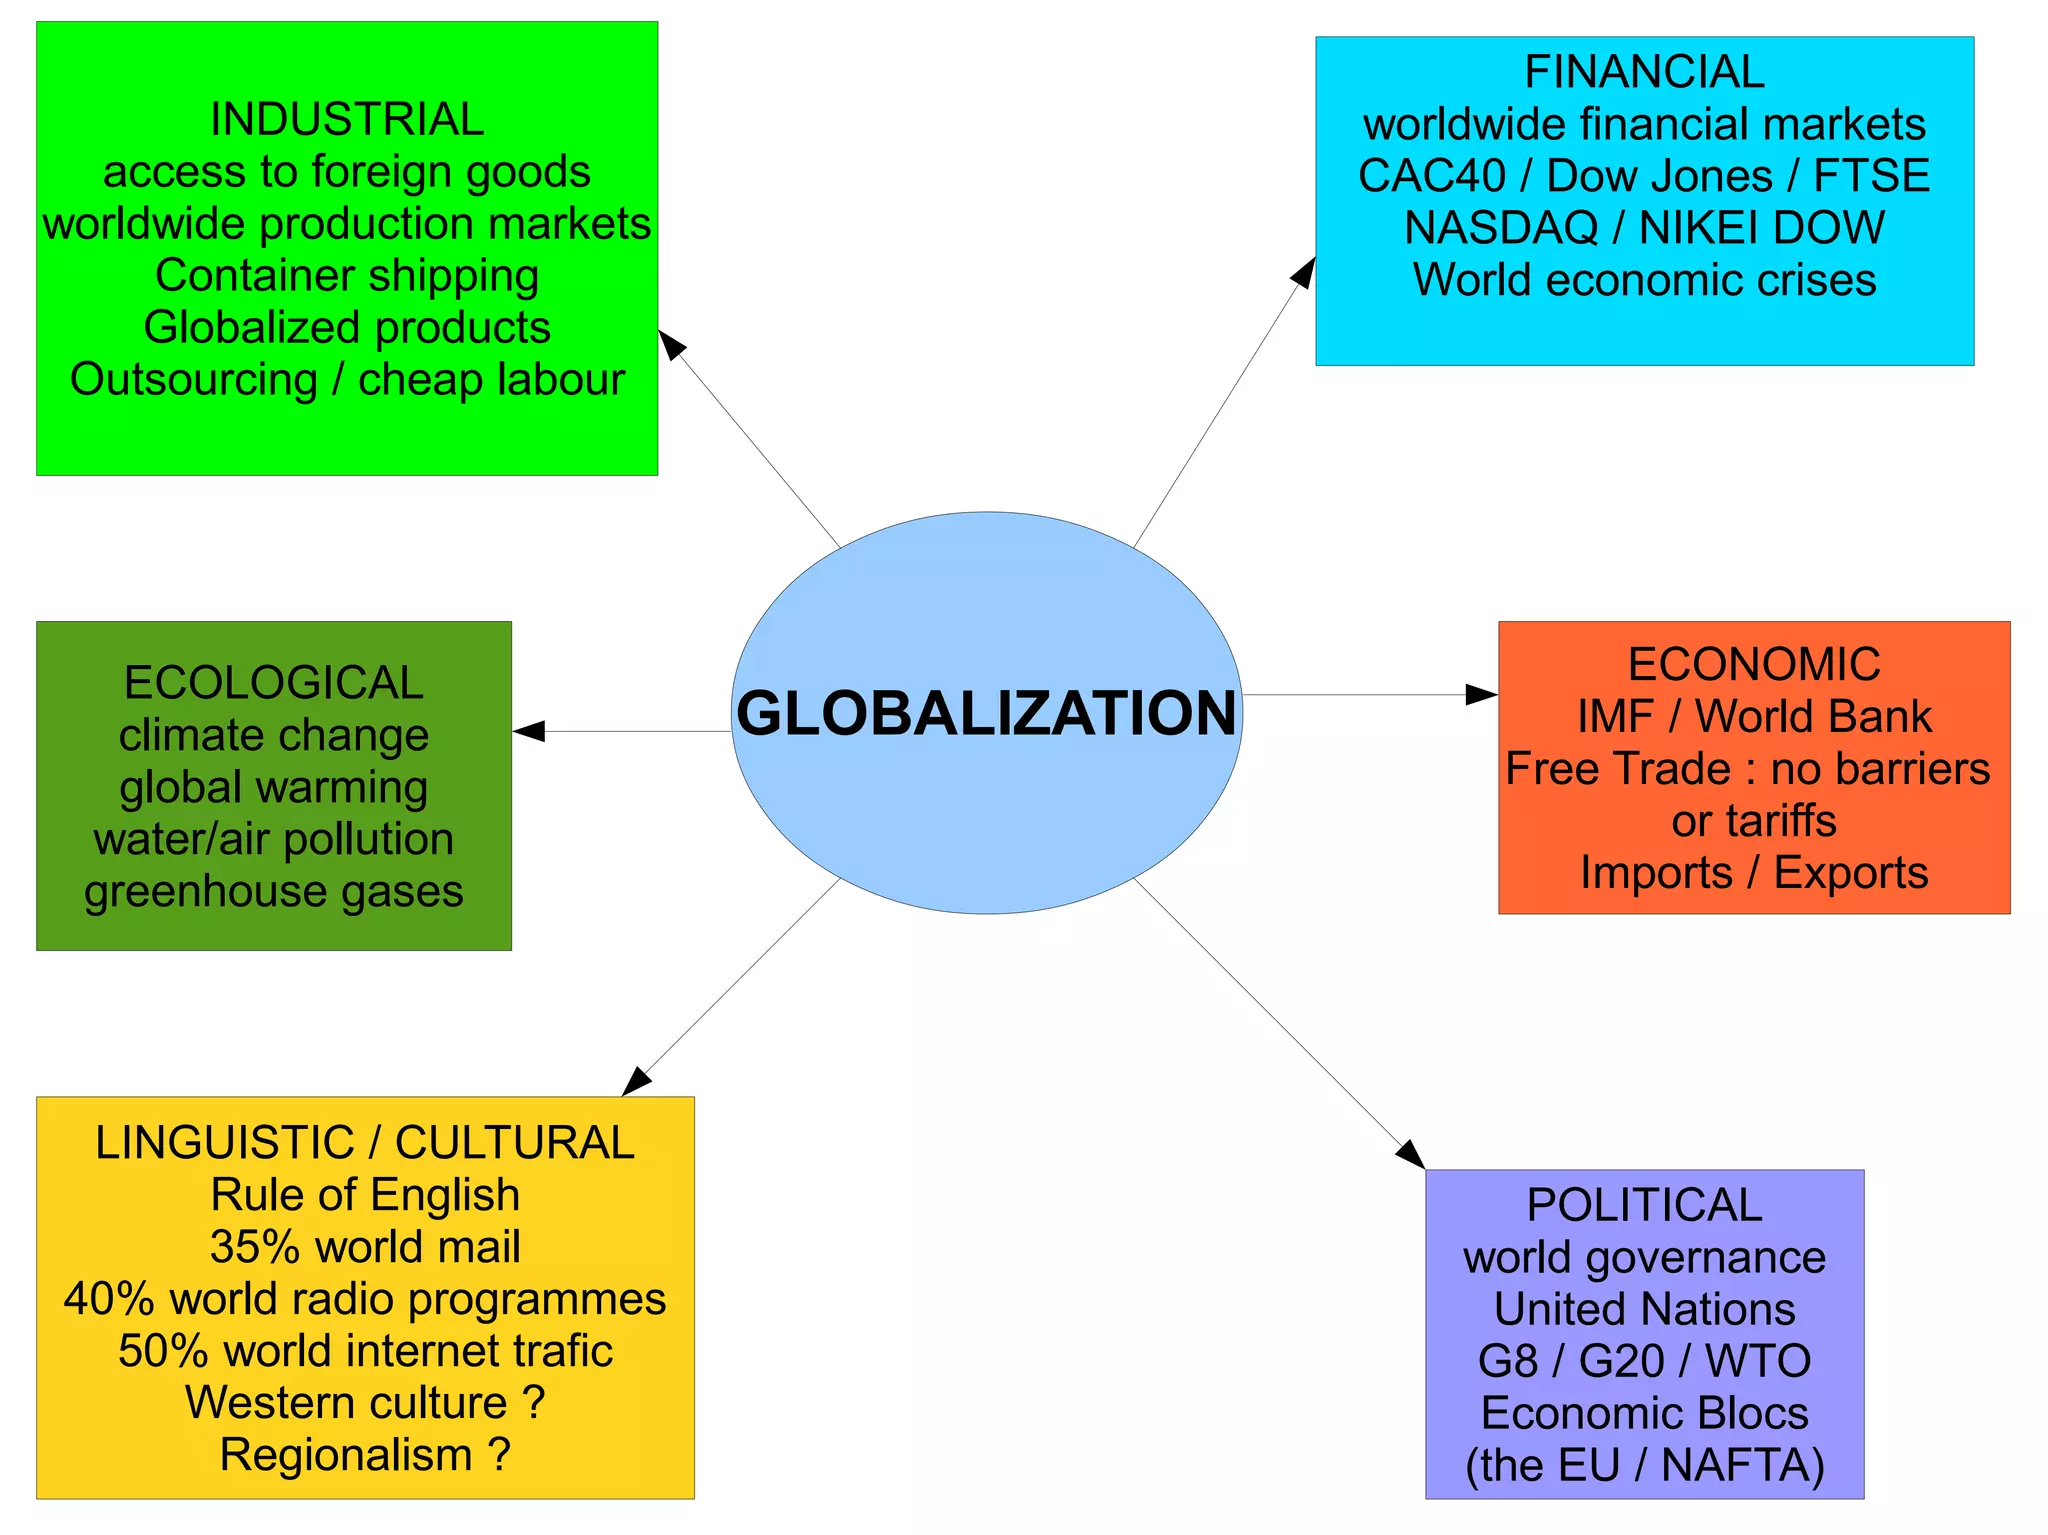
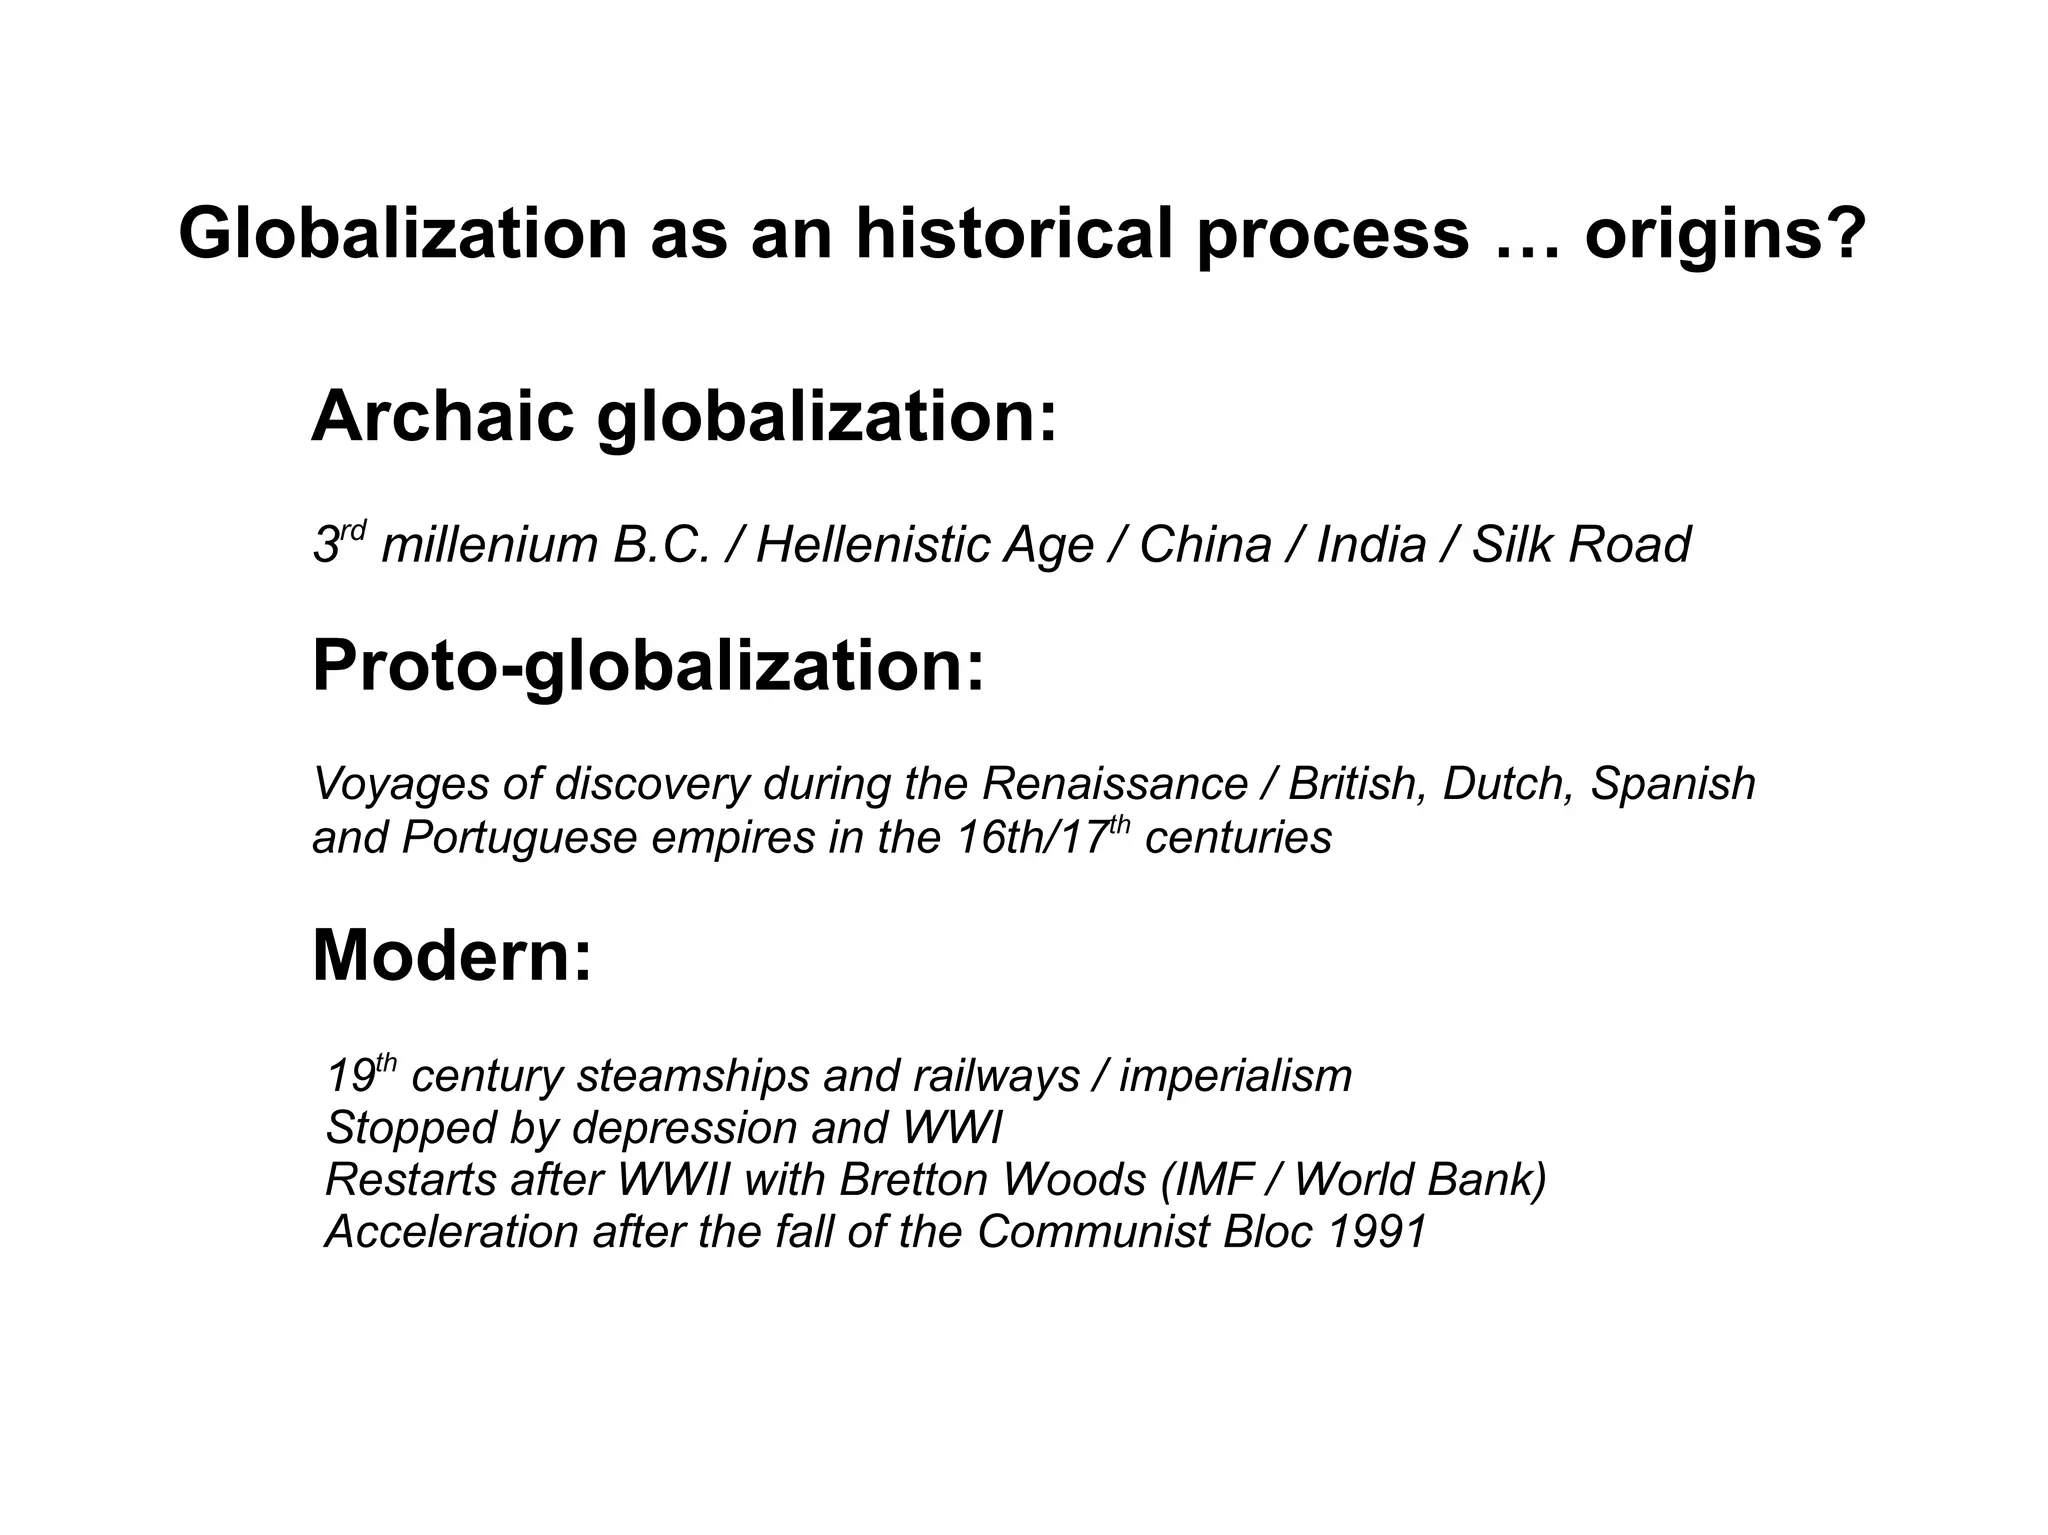
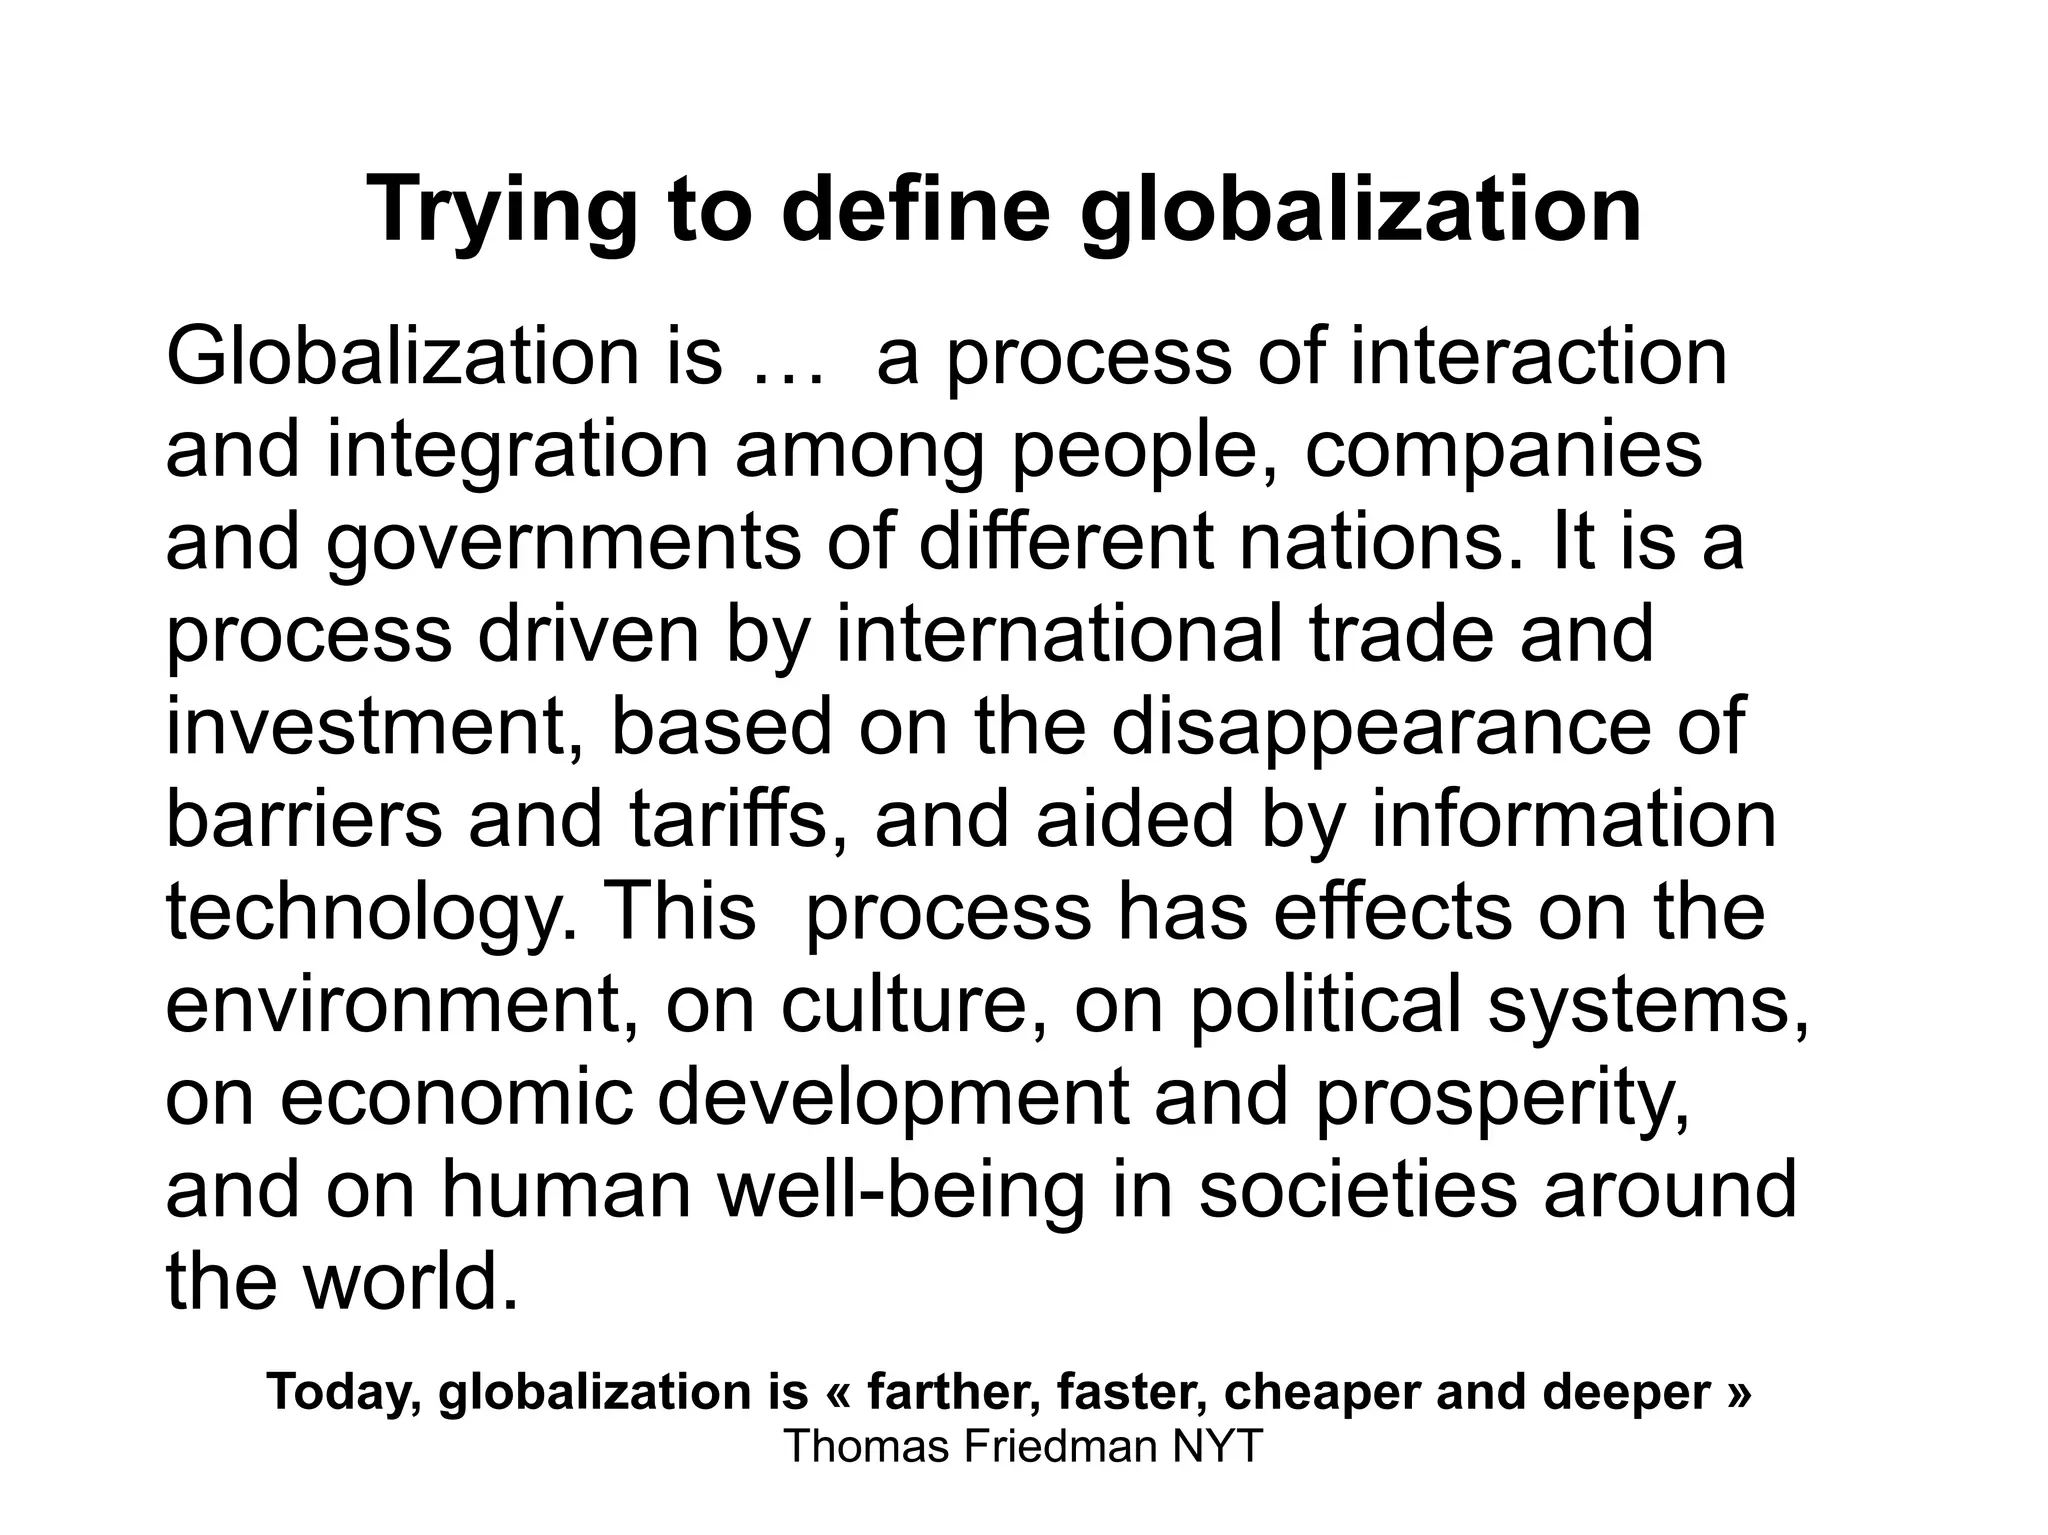
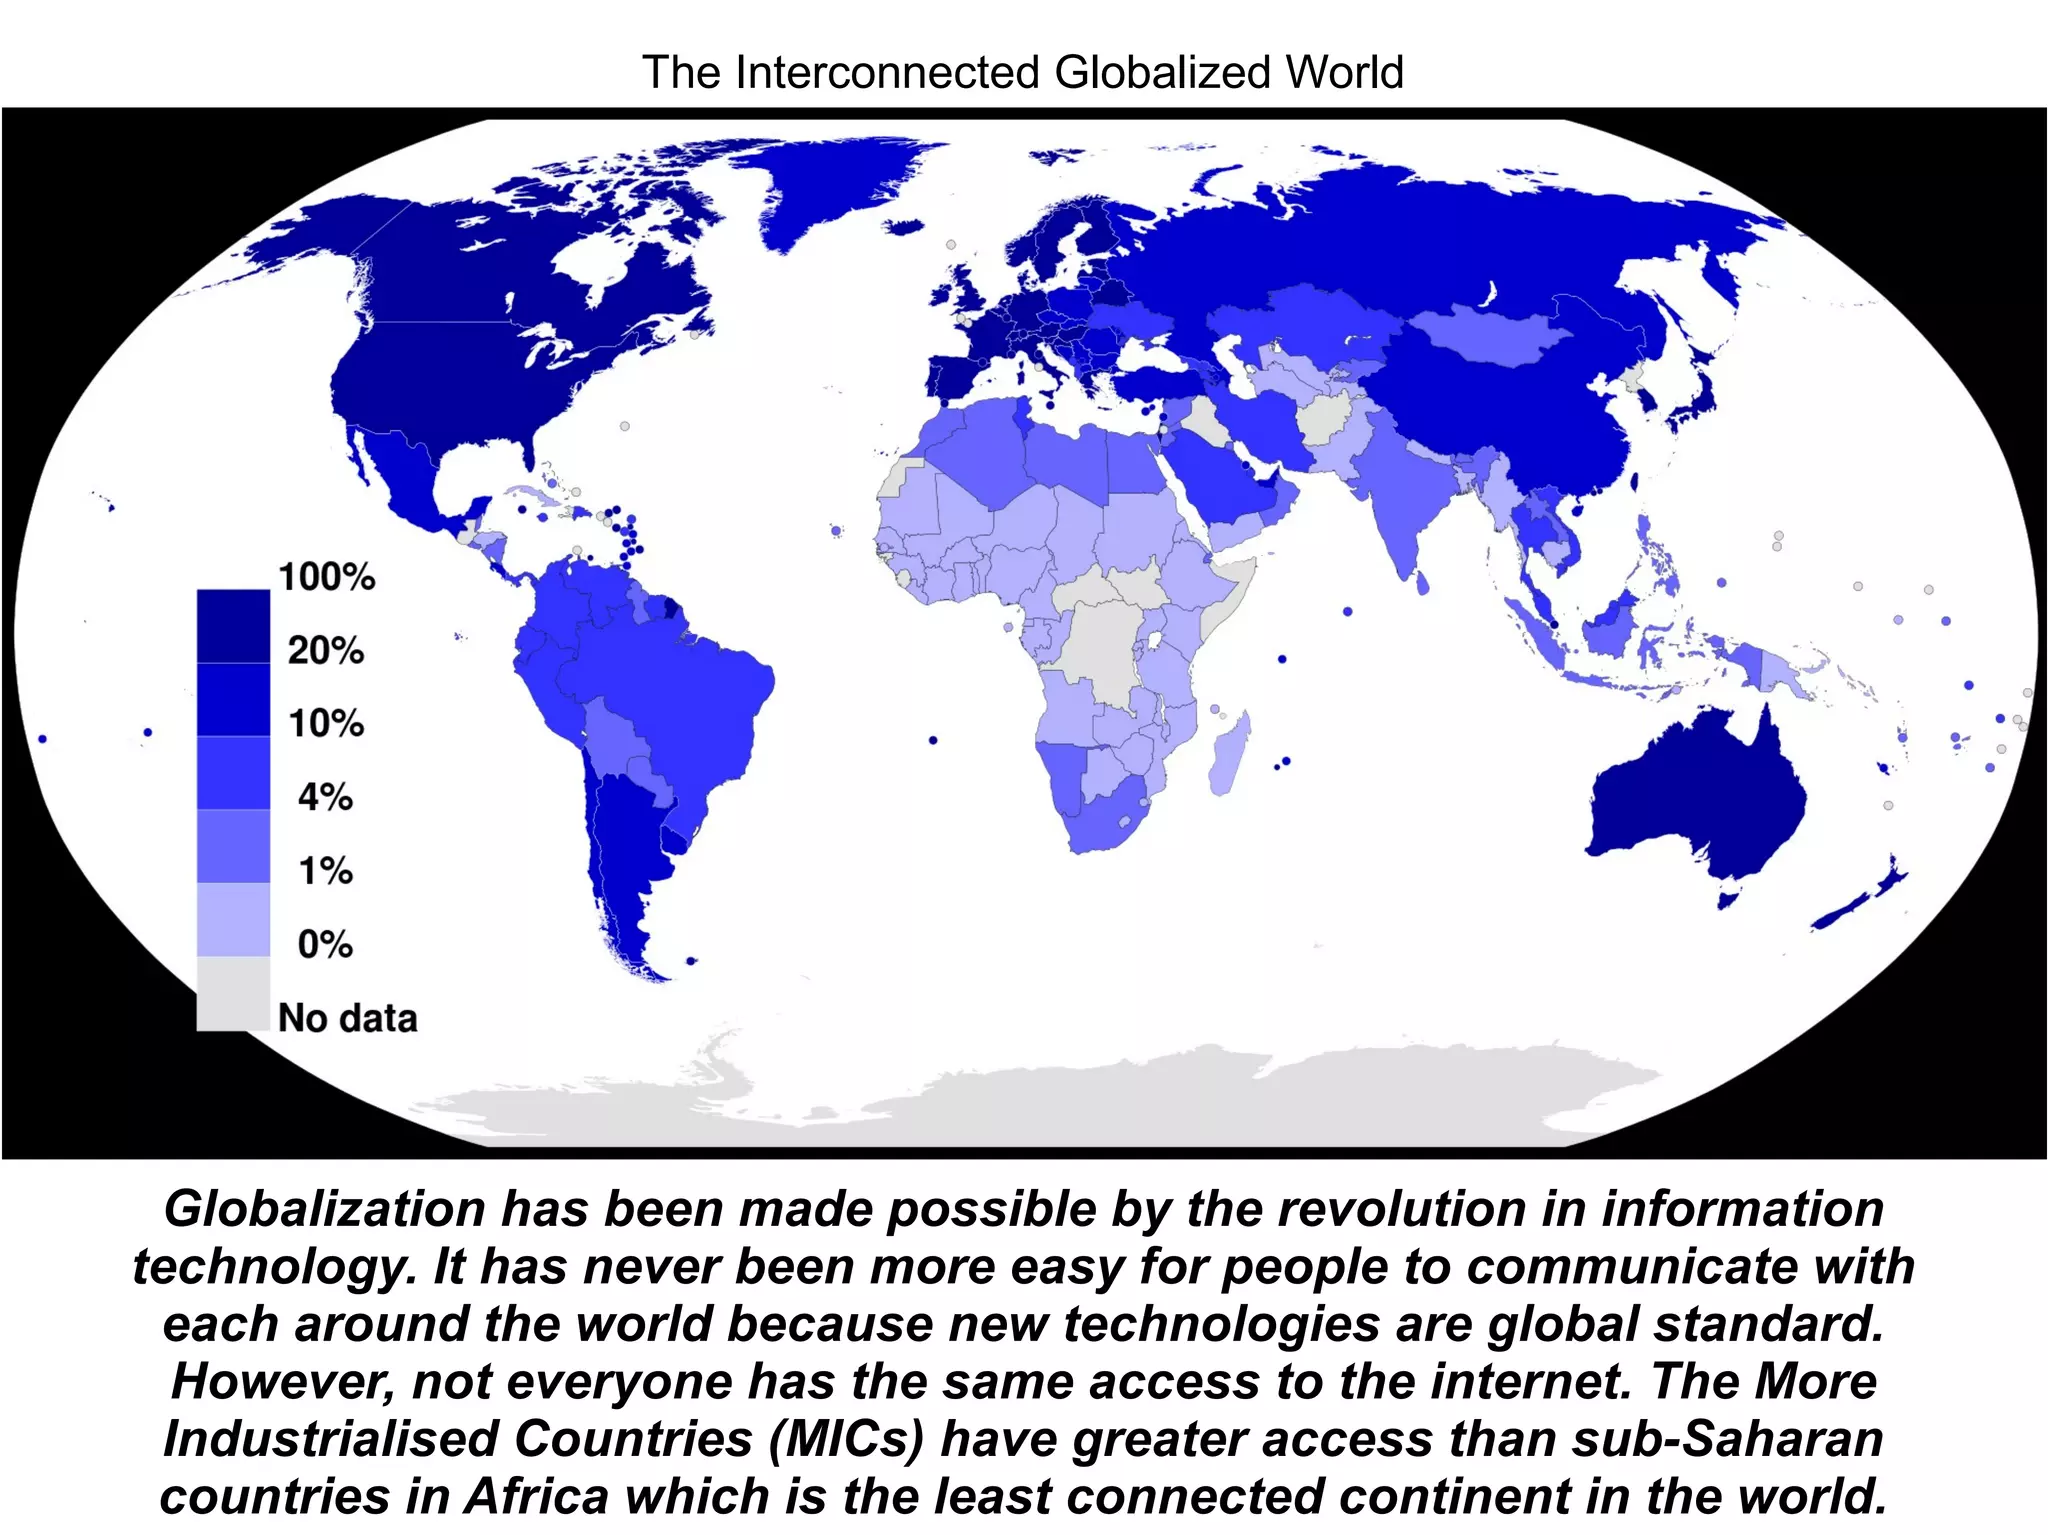
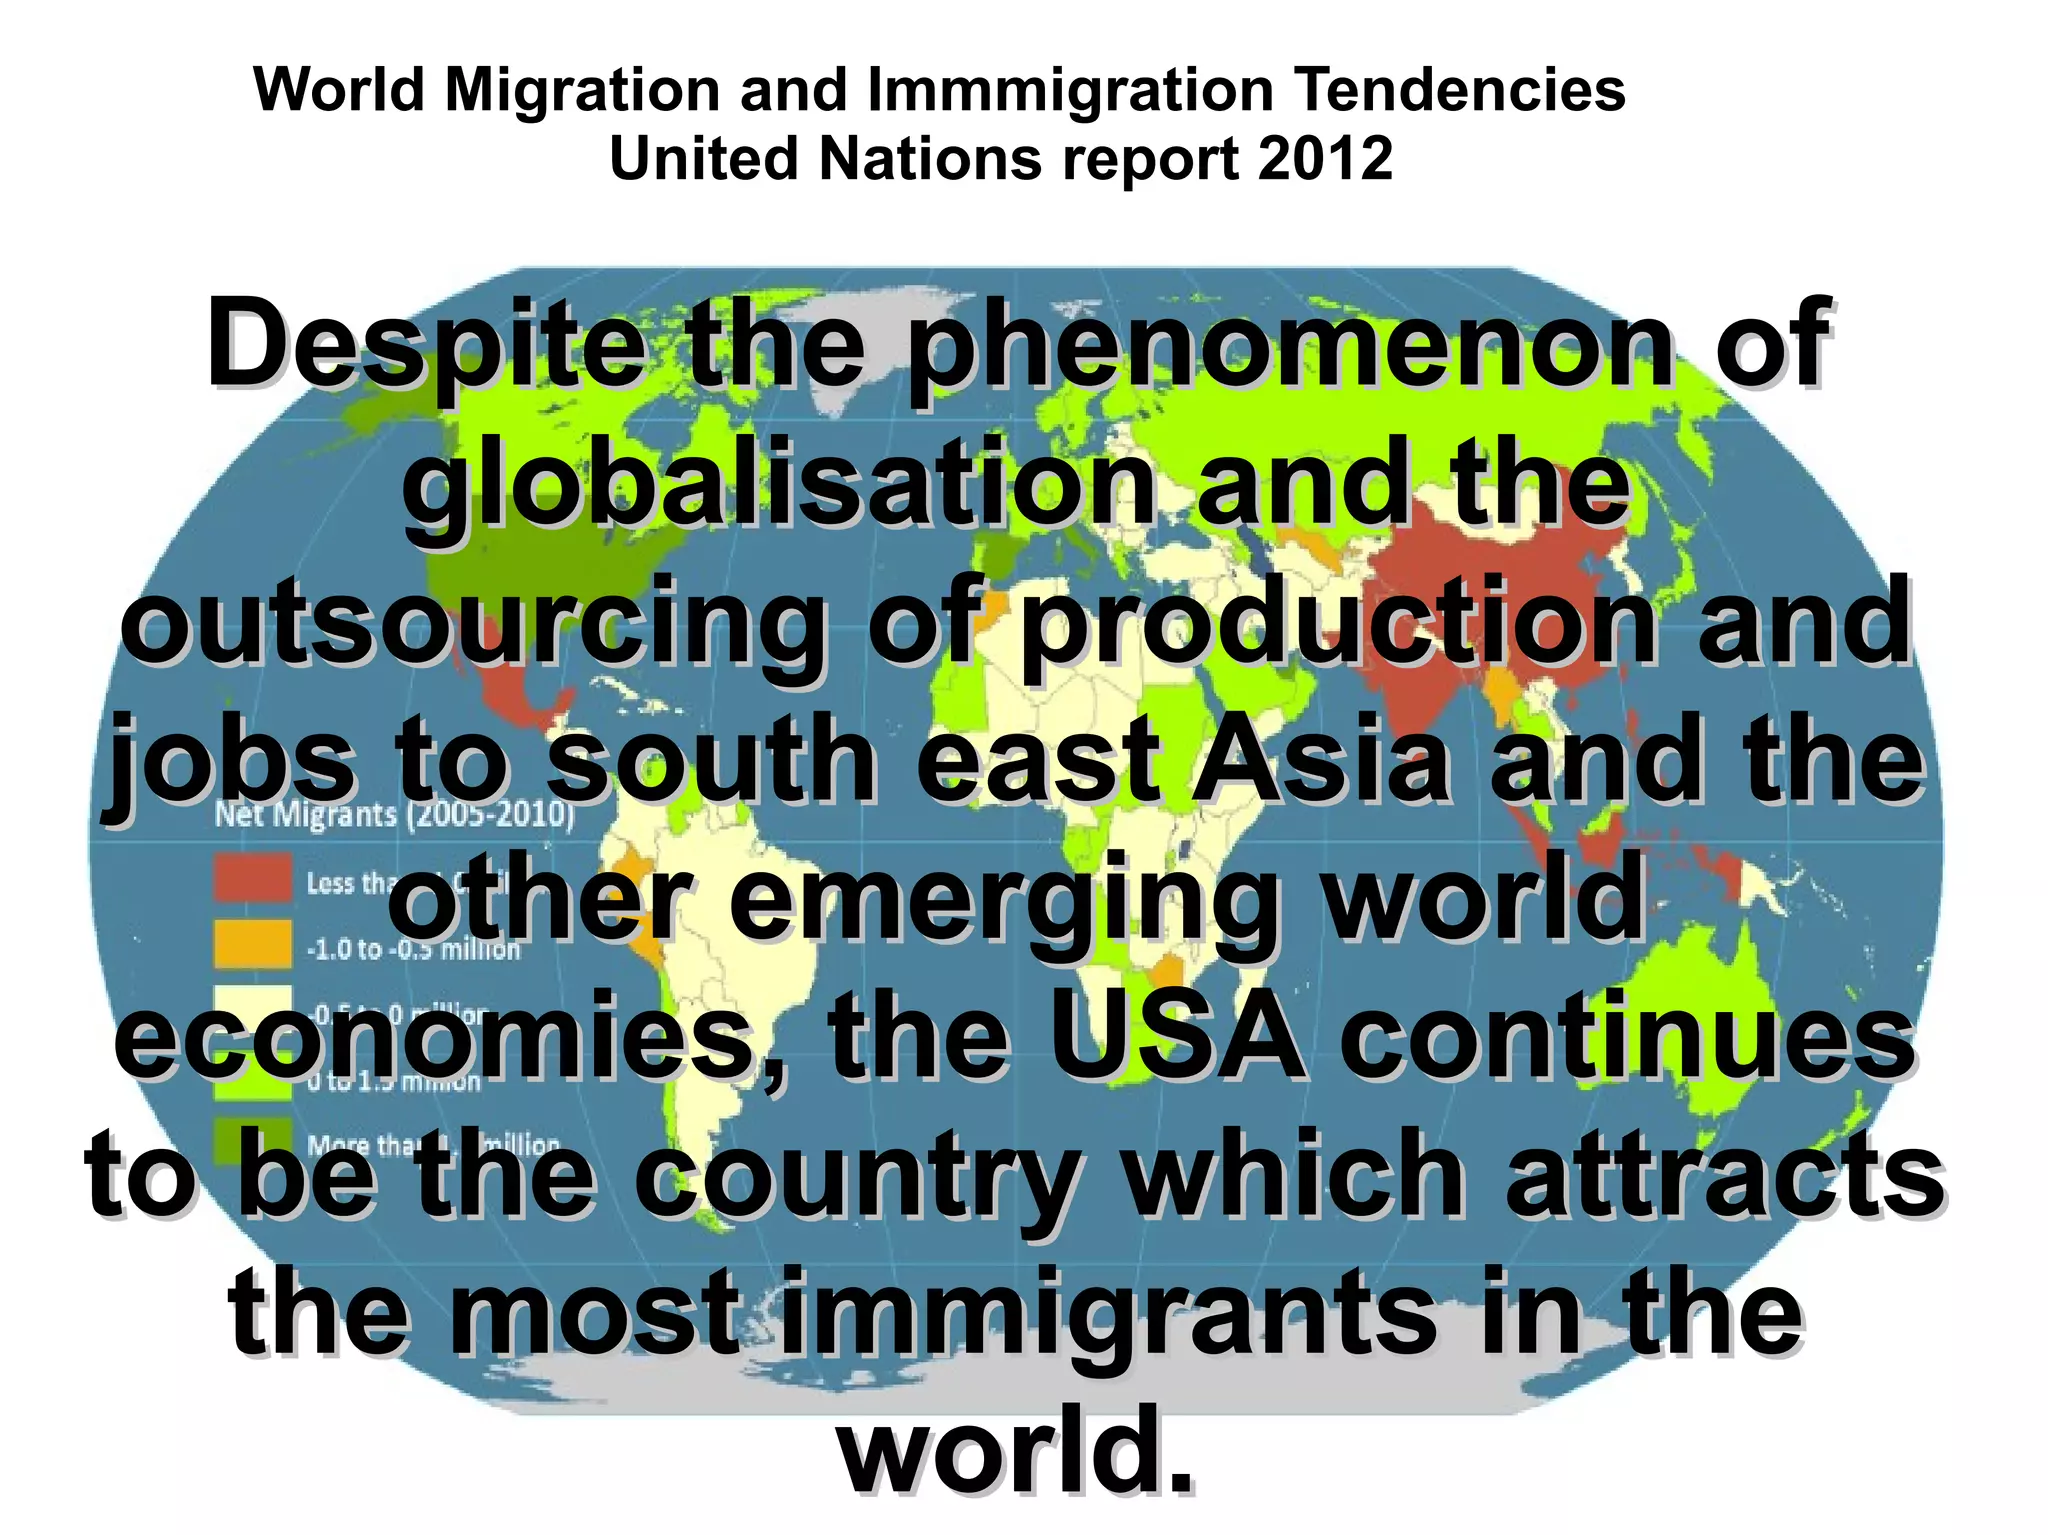
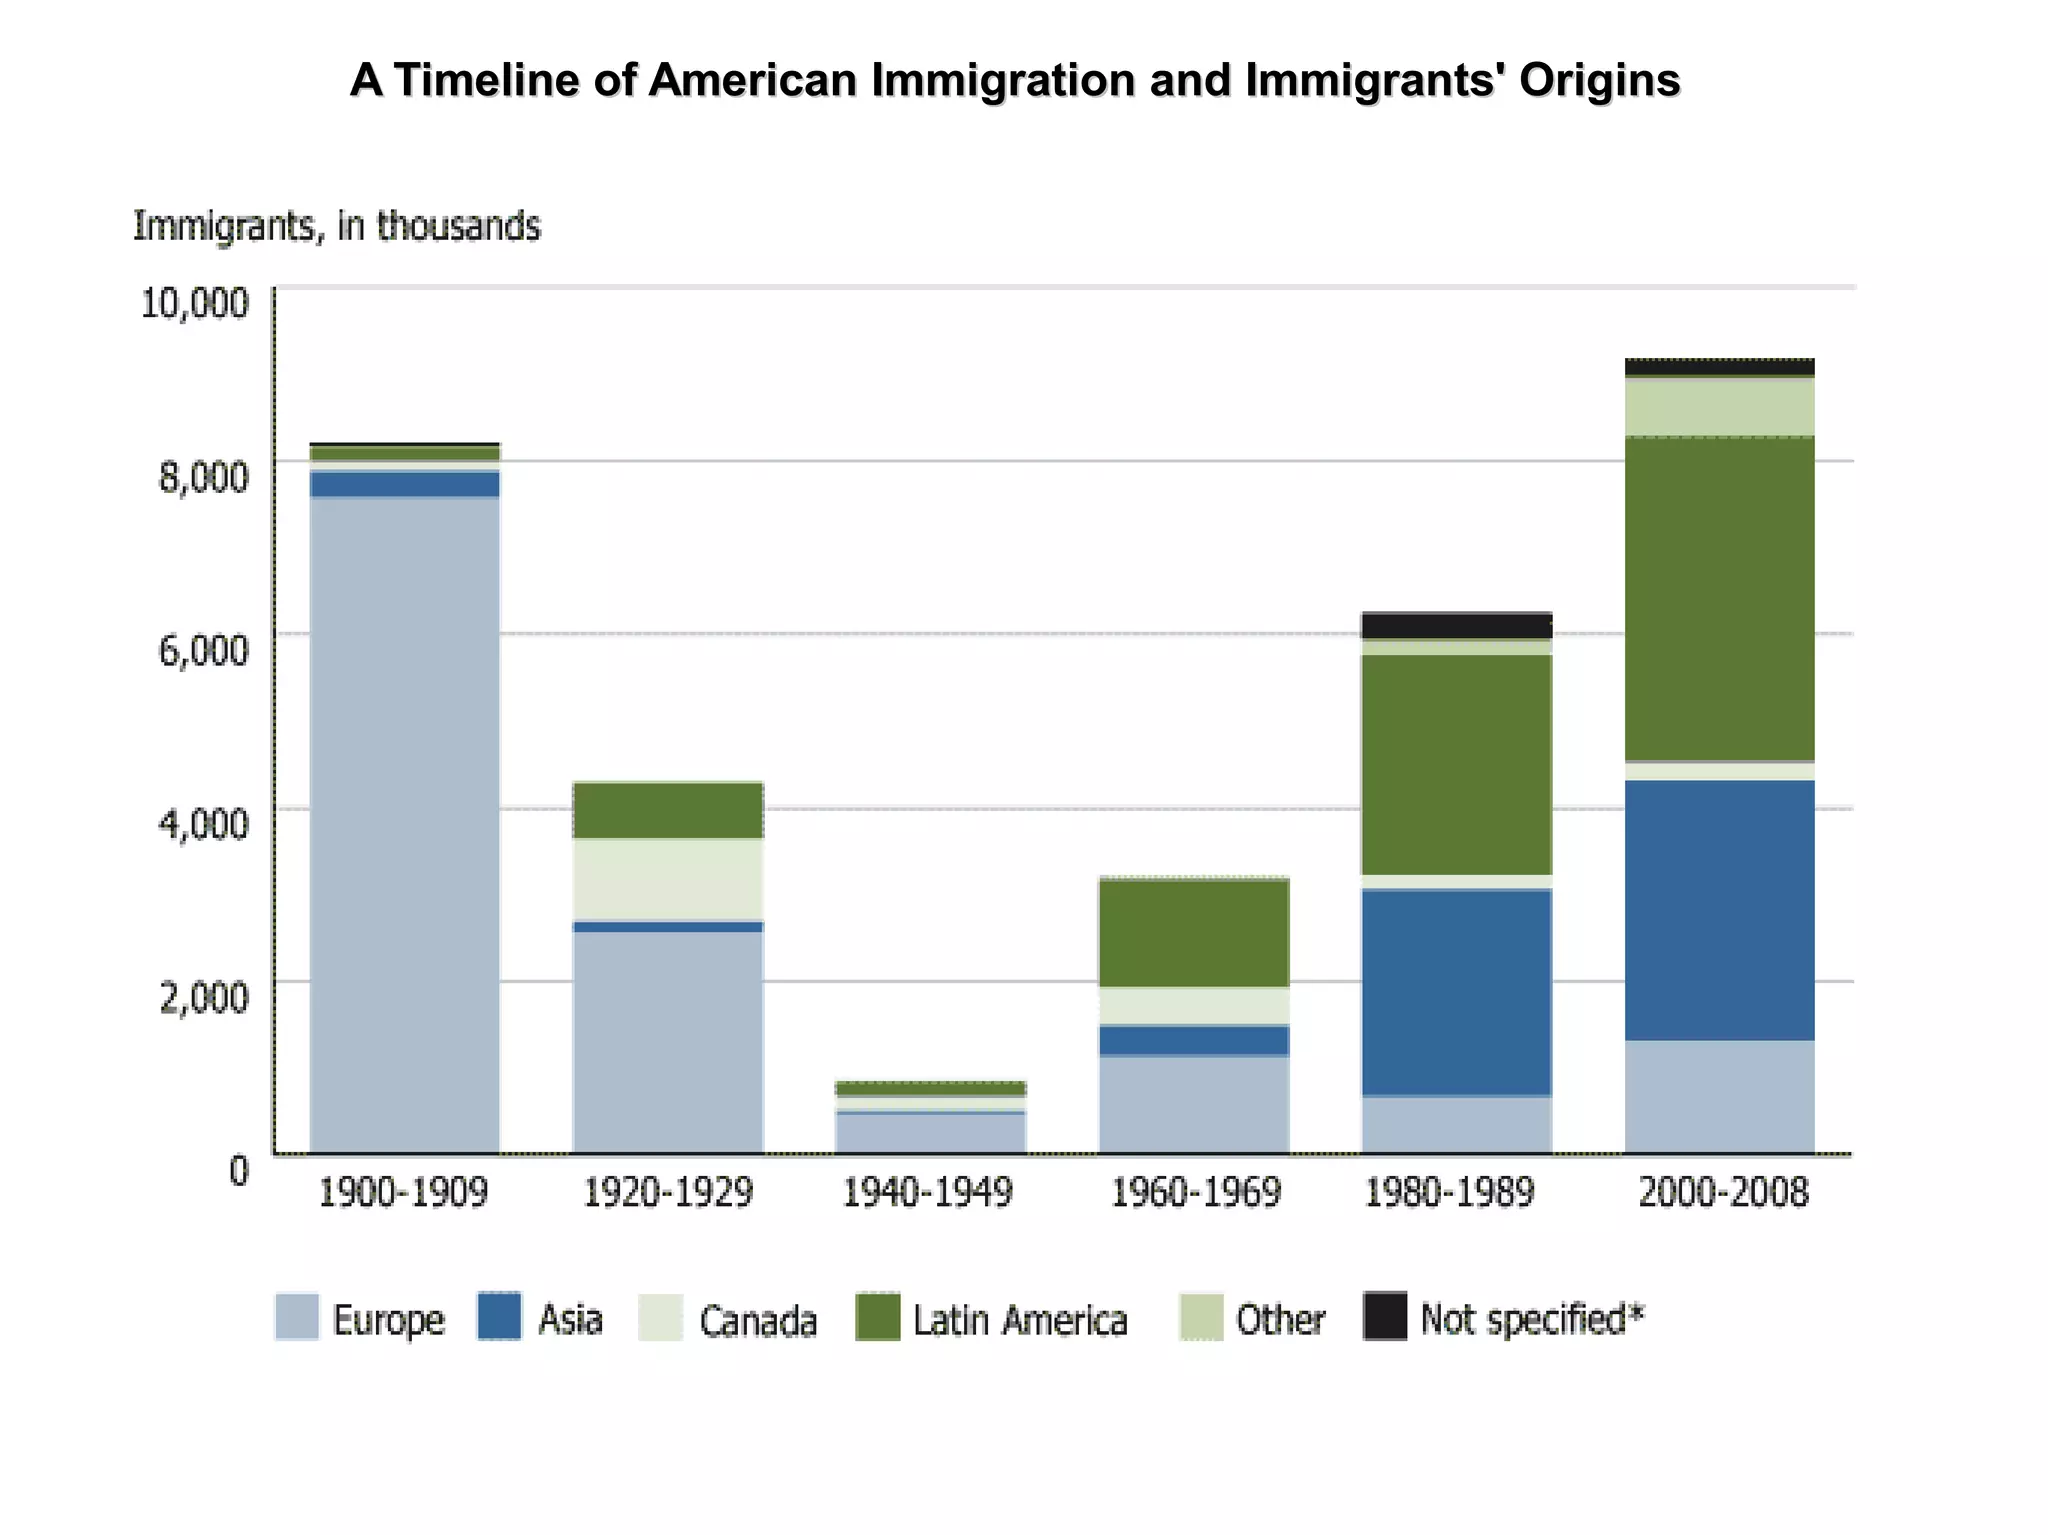
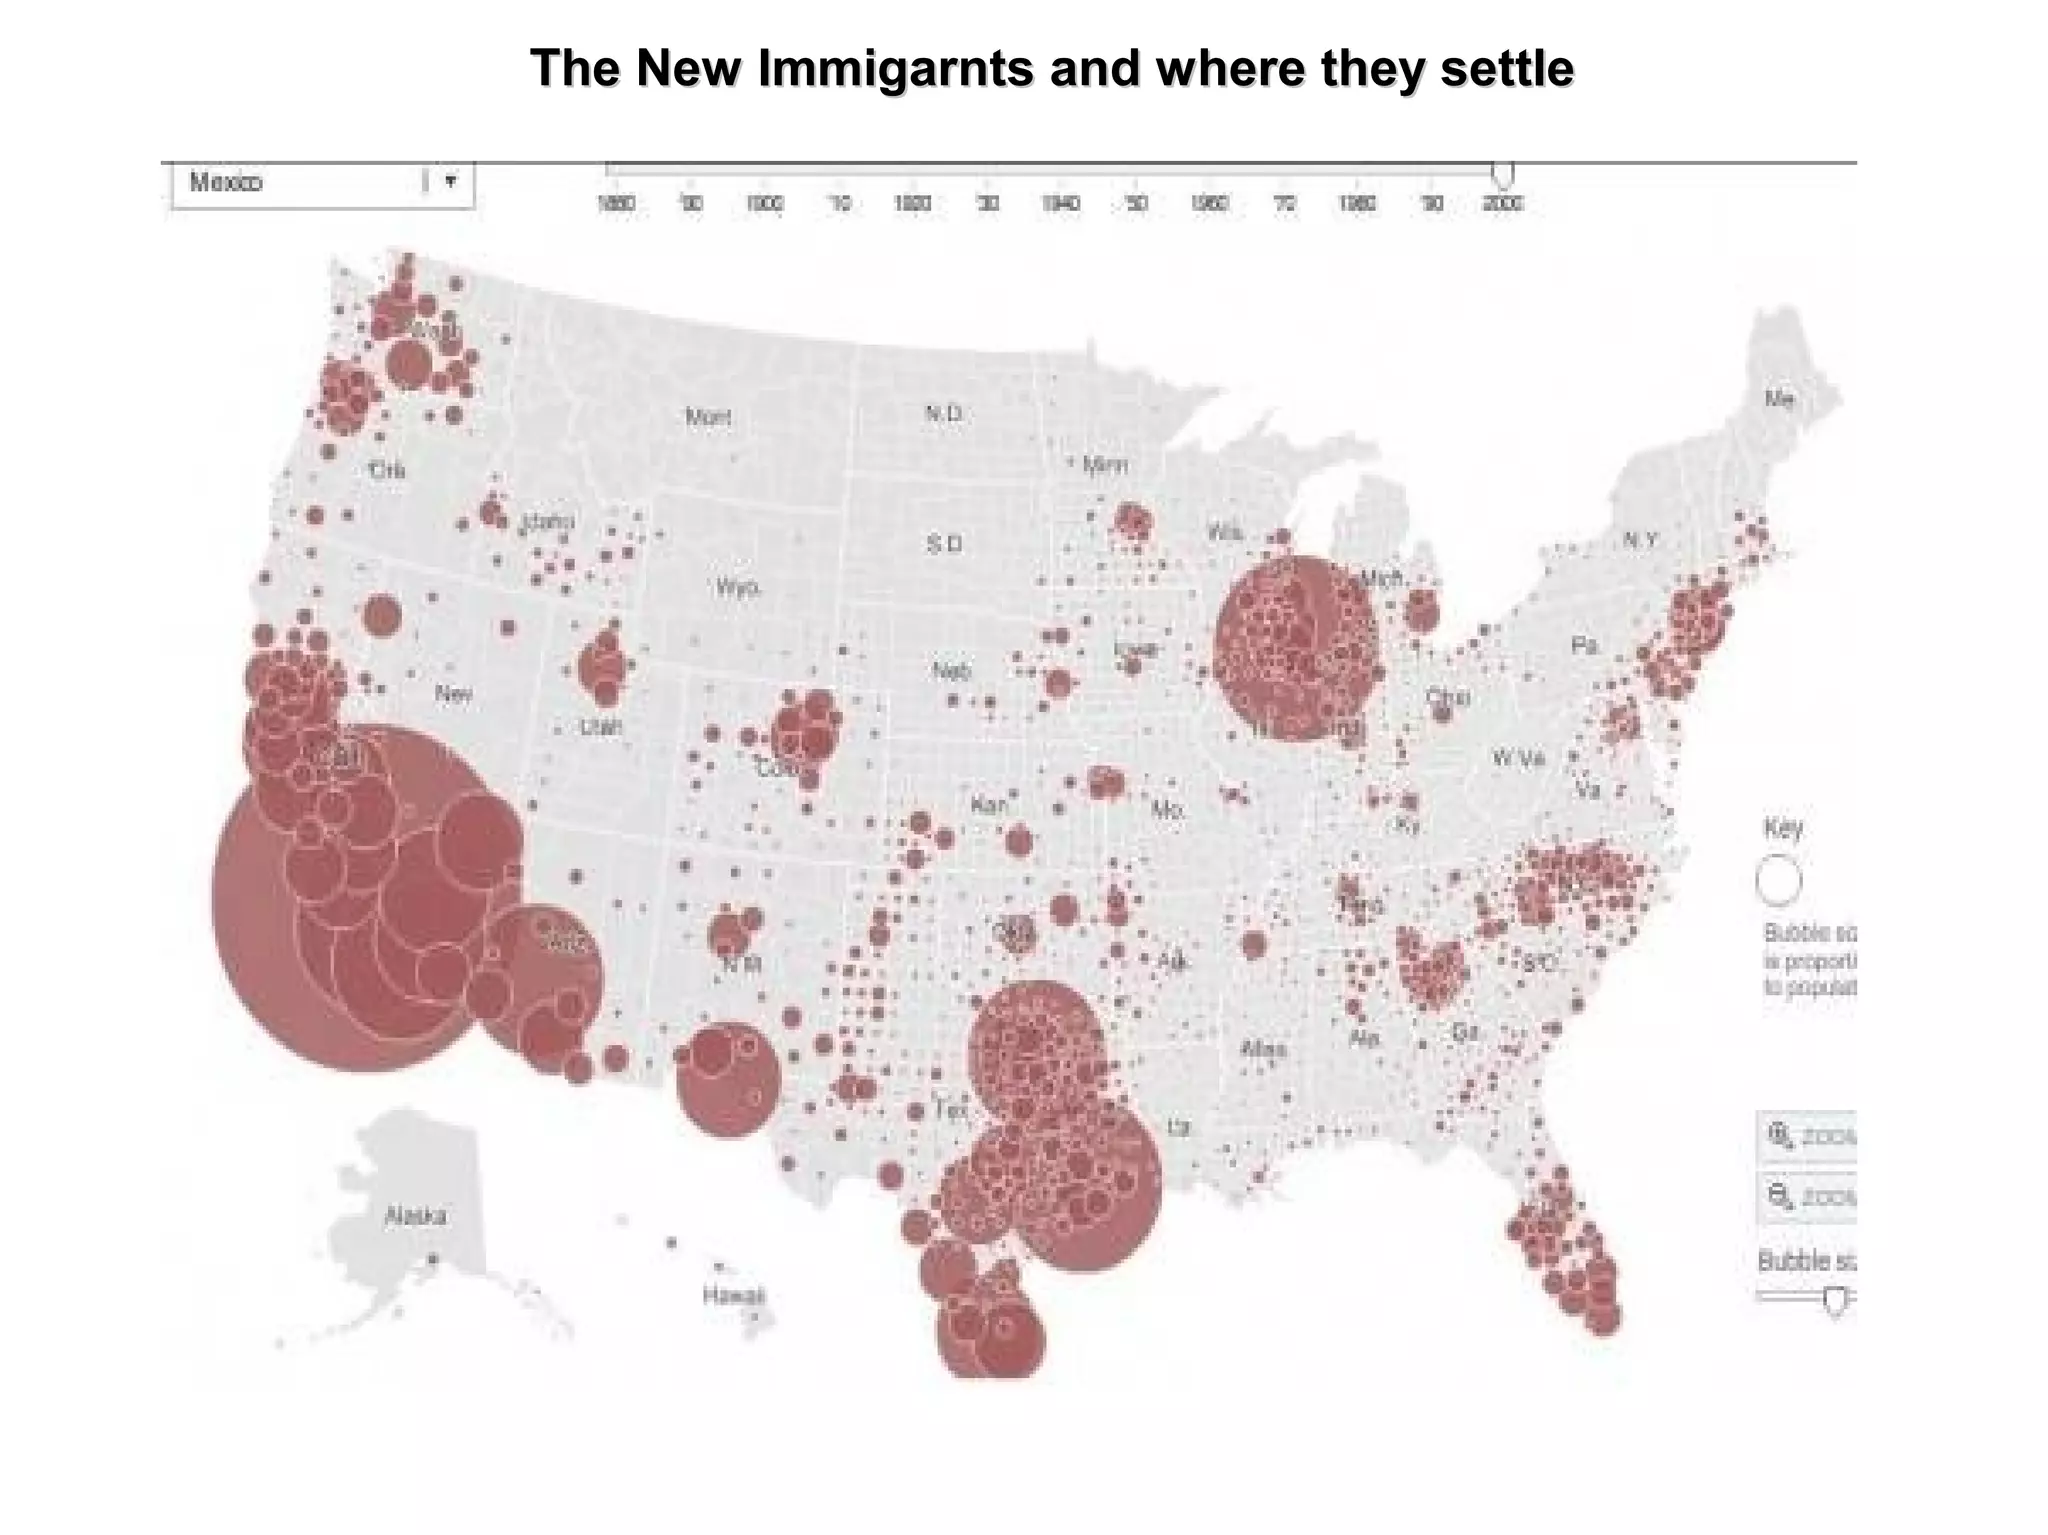
The GLOBALIZATION debate:
A better world for all?
Lesson Plan
1. Brainstorming: what comes to mind?
3. Differing types of globalisation
3. Globalisation as an historical process
4. Defining globalization
5. How does globalization work ?
New actors and processes
7. Migratory flows : the case of the
US-Mexico border
6. Globalization caricatures – analyses
7. Global alternatives ?
GLOBALIZATION
INDUSTRIAL
access to foreign goods
worldwide production markets
Container shipping
Globalized products
Outsourcing / cheap labour
FINANCIAL
worldwide financial markets
CAC40 / Dow Jones / FTSE
NASDAQ / NIKEI DOW
World economic crises
ECOLOGICAL
climate change
global warming
water/air pollution
greenhouse gases
ECONOMIC
IMF / World Bank
Free Trade : no barriers
or tariffs
Imports / Exports
POLITICAL
world governance
United Nations
G8 / G20 / WTO
Economic Blocs
(the EU / NAFTA)
LINGUISTIC / CULTURAL
Rule of English
35% world mail
40% world radio programmes
50% world internet trafic
Western culture ?
Regionalism ?
Globalization as an historical process … origins?
Archaic globalization:
3rd
millenium B.C. / Hellenistic Age / China / India / Silk Road
Proto-globalization:
Voyages of discovery during the Renaissance / British, Dutch, Spanish
and Portuguese empires in the 16th/17th
centuries
Modern:
19th
century steamships and railways / imperialism
Stopped by depression and WWI
Restarts after WWII with Bretton Woods (IMF / World Bank)
Acceleration after the fall of the Communist Bloc 1991
Trying to define globalization
Globalization is … a process of interaction
and integration among people, companies
and governments of different nations. It is a
process driven by international trade and
investment, based on the disappearance of
barriers and tariffs, and aided by information
technology. This process has effects on the
environment, on culture, on political systems,
on economic development and prosperity,
and on human well-being in societies around
the world.
Today, globalization is « farther, faster, cheaper and deeper »
Thomas Friedman NYT
How does
globalization
work?
New actors
and processes
Globalization : new actors and processes
In the new global world order, individual nation states have lost their traditional rôle and
power and have been replaced by Multi-National Corporations (MNCs), blurring borders and
frontiers or even wiping them out completely. Their loss of power has led to the creation of
Non Governmental Organizations (NGOs) to deal with global problems. Nation states have
responded by forming huge economic blocs in order to maintain some power and influence.
Sea Lines of Communication (SLOCs)
Maritime trade and commerce accounts for 90% of the world total
In 2011, the dollar value of world merchandise trade advanced 19% to $18.2
trillion, surpassing the previous peak of $16.1 trillion from 2008
Access to the sea: an imperative in global trade
Landlocked countries
Globalization has been made possible by the revolution in information
technology. It has never been more easy for people to communicate with
each around the world because new technologies are global standard.
However, not everyone has the same access to the internet. The More
Industrialised Countries (MICs) have greater access than sub-Saharan
countries in Africa which is the least connected continent in the world.
The Interconnected Globalized World
Who benefits from modern globalization ?
If we consider the similarities between the world maritime sealines
and the flows in information technology we can come to the following
conclusion :
The documents suggest that the phenomenon of modern
globalization benefits the more industrialised countries of the world
(NAFTA – the EU – East Asia (TRIAD) including China. The triad
countries represent only 8% of the world population but 80% of world
trade and over 50% of world GDP (Gross Domestic Product). The
new emerging countries also benefit from globalization (the BRICS).
This means that there are parts of the world left behind and even
excluded from the phenomenon (landlocked countries).
The importance of information technology and maritime sea routes is
obvious in new global trade and commerce – the race to send new
satellites into space and the current tensions for control in the Pacific
are further proof of this fact.
US Immigration Tendencies
Migratory Flows
19th
Century to Today
America, a Nation of Immigrants …America, a Nation of Immigrants …
but is it still a Land of Immigration ?but is it still a Land of Immigration ?
World Migration and Immmigration Tendencies
United Nations report 2012
Despite the phenomenon ofDespite the phenomenon of
globalisation and theglobalisation and the
outsourcing of production andoutsourcing of production and
jobs to south east Asia and thejobs to south east Asia and the
other emerging worldother emerging world
economies, the USA continueseconomies, the USA continues
to be the country which attractsto be the country which attracts
the most immigrants in thethe most immigrants in the
world.world.
A Timeline of American Immigration and Immigrants' OriginsA Timeline of American Immigration and Immigrants' Origins
Document 1 Immigration Bar Graph
The bar chart shows that the USA has always attracted millions of immigrants to
its shores, from the middle of the 19th
century up to today.
The numbers of immigrants has fluctuated with high points at the turn of the 20th
century, a low point during and after WWII followed by a steady rise up to today
when numbers are at an all time high.
Document 2 Bar Graph of Immigrants' Origins
What has changed is the region of origin of the immigrants. Historically, it was
Europeans who emigrated massively at the trurn of the 20th
century and then
their numbers gradually dwindled up to and following WWII. If immigration has
increased since that time it is because of new immigrants from Asia but
essentially Latin America who have arrived in their millions.
The New Immigarnts and where they settleThe New Immigarnts and where they settle
Document 3 Chart showing countries of origin of modern day immigrants
This pie chart shows the make up of modern day immigrants arriving in the
USA. Whilst 41% come from all over the world, 59% of thenew immigrants are
from Latin America or South East Asia including India. By far the largest group
of immigrants from one country are the Mexicans who make up over a quarter
of all immigrants.
Document 4 Map of the USA showing where immigrants settle
This dot map shows clearly that the new immigrants have not spread evenly
throughout the country. They have massed together in specific areas such
as New York (wealth), the Great Lakes (industry), Florida (employment) but
especially in Texas and on the west coast - the US-Mexican border runs
between Texas and California. The vast majority of new Mexican immigrants
have settled here (proximity/family) which has given rise to numerous
problems (language/education/employment).
The US-Mexico Border – Le Frontera – Facts and Figures
The US-Mexico border is the international border between the two states. It has a
length of 1969 miles or just over 3000 km.
It is the most frequently crossed border in the world with over 250 million people
crossing every year.
It runs from San Diego / Tijuana on the Pacific coast to Brownsville / Matamoros in the
Gulf of Mexico.
Between these two extremities, the border crosses different terrains: the Rio Grande
and the Colorado river, as well as scorching deserts and huge urban conurbations
The Origins and Makeup of Illegal ImmigrationThe Origins and Makeup of Illegal Immigration
Document 5 Origins and settlement of illegal immigrants
The pie chart shows that the vast majority of illigal immigrants in the USA
are from Latin America (over three quarters) and well over half of all illegal
immigrants come specifically from Mexico.
The bar chart shows us that the illegal immigrants have stayed very close to
the border region of the USA and Mexico, especially California but also
Florida, adding to the number of legal immigrants already there.
Document 6 Make up of the illegal immigrant population
The first pie chart shows the huge number of illegal immigrants in the USA –
11 million at the time but now around 13 million. Mexicans make up more than
half of the number of illegal immigrants in the USA.
More importantly, a high number are solo males and females which means
young people looking for work, housing, education and eventually a family life.
The Effects of the New Immigration on Traditional American SocietyThe Effects of the New Immigration on Traditional American Society
Document 7 Graph showing evolution of the Hispanic population of the USA
This bar graph shows how the Hispanic population has increased 17 fold
(1700%) since 1950 to reach 68 miliion today. Knowing that the population of
the USA is around 317 million, the Hispanics make up 21% of the total number.
The projection shows the possible evolution until 2050 when their number will
have tripled, challenging caucasians as the main ethnic group in the country.
Document 8 Graph of changing make up of US society between 2010 and 2030
What this bar chart makes clear is that all the ethnic groups which make up US
society are stable (Black) or increasing (Asian, Other, Hispanic). The only ethnic
group which is decreasing as a precentage of the total population are the
caucasians (white).
National Geographic
Determined What Americans
Will Look Like in 2050
… and It's Beautiful
This is a critical cartoon of corporate globalism. The man in the centre,
representing the MNCs, is misquoting a speech by ML King in 1963 … he has
added the word « trade » to « free ». Free trade was introduced on a global scale
from the 1980s onwards. The stereotyped figure in the middle holds chains in his
left hand and a whip in his right. The chains represent the WTO created in 1995
which replaced the GATT agreements. The WTO is supposed to help govern the
global economic system but in the hands of MNCs it allows them to pay workers in
poor countries extremely low wages and prevent them from having any workers
rights – it maintains them in poverty. The whip stands for NAFTA (North American
Free Trade Agreement) signed in 1994 which set up the free circulation of goods
and services between Canada, the USA and Mexico- the largest trade bloc in the
world. It has led to growing unemployment due to outsourcing and has reduced
workers' rights as they fear for their jobs and livelihoods.
Corporate globalisation benefits only MNCs and their shareholders' dividends while
the workers of the world suffer, both in MICs and LICs. The rich get richer, the rest
Outsourcing in More Industrialised Countries (MICs)
Slave labour in Less Industrialised Countries (LICs)
Greater profits from dividends and shares for the MNCs
This is a cartoon which criticizes corporate globalisation. In it, we can see two rather fat
men,caricatures of businessmen, riding on the backs of the poor (here, they look Indian, Asian
or African). One of the men represents global corporatism and the other the British East India
Company. Modern global corporatism politely asks the way to the future whereas he is
heading in the wrong direction – he's going back to the past. The figure representing the East
India Company assures him he is going the right way.
The British East India company was founded in 1600 and is consodered to be one of the first
examples of an MNC. It was a private company, with no control over it from government. It
became responsible for half of world trade over the next centuries. It exploited workers in
foreign countries and imposed its own military rule in parts of India. This led to exploitation,
starvation and genocide, as indicated on the signpost. Modern day corporate globalisation is
pictured heading in the same direction meaning that it too does exactly the same today –
exploiting poor workers around the world to make more profit for private companies. The past
seems to be repeating itself or perhaos it means that the system has never really changed –
international big business has always exploited others in order to make greater profits for the
shareholders.
Corporate globalisation is nothing more than modern day colonialism.
The colonial past and modern globalisation are one and the
same
Colonialism and globalisation exploit the poor for their own
benefits
The richer countries, normally in the North, have always
exploited the poor, traditionally in the South
This is a cartoon strip which criticises the effects of globalisation. In it we can see children in
a queue, lining up to see Father Christmas (Santa Claus) in a department store. Normally
children tell him what they would like for a Christmas present. All the traditional features are
there – the big chair, the reindeer, the Christmas tree and the elf … but there is no Father
Christmas. In his place, the children find a TV screen and they must tell a man in a call
centre in Bangalore, India, what they would like.
Christmas is the period when companies in the western world make most of their annual
turnover (chiffre d'affaires). It is also a period which plays on our childhood memories. Here,
everything has been changed by globalisation. As one of the children in the queue
comments, Father Christmas has lost his job due to outsourcing – it was cheaper to employ
an Indian in Bangalore than a man in the store. India, and Bangalore in particular, is home to
most of the world's call centres where calls are redirected since the cost is low.
The criticism seems to be that there are no limits to what MNCs will do make a profit –
nothing is sacred, not even Father Christmas. Moreover, the girl looks surprised and
confused – like many people who cannot understand why and how their lives and jobs are
being effected by the consequences of globalisation.
The cartoon plays on our childhood memories
Nothing can resist the consequences of globalisation -
nothing is sacred – not even Father Christmas
We feel confused and often angry at events caused by
globalisation which we cannot control
GROUP 4
Globalization has direct, often disastrous effects on the
environment. In the background, the air is polluted, nothing grows
and animals die. However, there is always room for profit: the gas
mask. Trade and commerce continue in the face of climatic
catastrophe.
GLOBAL ALTERNATIVES?
Sustainable Development …
Fair Trade …
Slow Movement ...
Sustainable Development
… development that meets the needs of the present
without comprimising the ability of future generations to
meet their own needs BRUTLAND COMMISSION 1987
Fair Trade is a trading partnership, based on dialogue, transparency, and
respect, that seeks greater equity in international trade. It contributes to
sustainable development by offering better trading conditions to, and
securing the rights of, marginalized producers and workers – especially in
the South

Globalization presentation 2015 2016

  • 1.
    The GLOBALIZATION debate: Abetter world for all? Lesson Plan 1. Brainstorming: what comes to mind? 3. Differing types of globalisation 3. Globalisation as an historical process 4. Defining globalization 5. How does globalization work ? New actors and processes 7. Migratory flows : the case of the US-Mexico border 6. Globalization caricatures – analyses 7. Global alternatives ?
  • 2.
    GLOBALIZATION INDUSTRIAL access to foreigngoods worldwide production markets Container shipping Globalized products Outsourcing / cheap labour FINANCIAL worldwide financial markets CAC40 / Dow Jones / FTSE NASDAQ / NIKEI DOW World economic crises ECOLOGICAL climate change global warming water/air pollution greenhouse gases ECONOMIC IMF / World Bank Free Trade : no barriers or tariffs Imports / Exports POLITICAL world governance United Nations G8 / G20 / WTO Economic Blocs (the EU / NAFTA) LINGUISTIC / CULTURAL Rule of English 35% world mail 40% world radio programmes 50% world internet trafic Western culture ? Regionalism ?
  • 3.
    Globalization as anhistorical process … origins? Archaic globalization: 3rd millenium B.C. / Hellenistic Age / China / India / Silk Road Proto-globalization: Voyages of discovery during the Renaissance / British, Dutch, Spanish and Portuguese empires in the 16th/17th centuries Modern: 19th century steamships and railways / imperialism Stopped by depression and WWI Restarts after WWII with Bretton Woods (IMF / World Bank) Acceleration after the fall of the Communist Bloc 1991
  • 4.
    Trying to defineglobalization Globalization is … a process of interaction and integration among people, companies and governments of different nations. It is a process driven by international trade and investment, based on the disappearance of barriers and tariffs, and aided by information technology. This process has effects on the environment, on culture, on political systems, on economic development and prosperity, and on human well-being in societies around the world. Today, globalization is « farther, faster, cheaper and deeper » Thomas Friedman NYT
  • 5.
  • 6.
    Globalization : newactors and processes In the new global world order, individual nation states have lost their traditional rôle and power and have been replaced by Multi-National Corporations (MNCs), blurring borders and frontiers or even wiping them out completely. Their loss of power has led to the creation of Non Governmental Organizations (NGOs) to deal with global problems. Nation states have responded by forming huge economic blocs in order to maintain some power and influence.
  • 7.
    Sea Lines ofCommunication (SLOCs) Maritime trade and commerce accounts for 90% of the world total In 2011, the dollar value of world merchandise trade advanced 19% to $18.2 trillion, surpassing the previous peak of $16.1 trillion from 2008
  • 8.
    Access to thesea: an imperative in global trade Landlocked countries
  • 9.
    Globalization has beenmade possible by the revolution in information technology. It has never been more easy for people to communicate with each around the world because new technologies are global standard. However, not everyone has the same access to the internet. The More Industrialised Countries (MICs) have greater access than sub-Saharan countries in Africa which is the least connected continent in the world. The Interconnected Globalized World
  • 10.
    Who benefits frommodern globalization ? If we consider the similarities between the world maritime sealines and the flows in information technology we can come to the following conclusion : The documents suggest that the phenomenon of modern globalization benefits the more industrialised countries of the world (NAFTA – the EU – East Asia (TRIAD) including China. The triad countries represent only 8% of the world population but 80% of world trade and over 50% of world GDP (Gross Domestic Product). The new emerging countries also benefit from globalization (the BRICS). This means that there are parts of the world left behind and even excluded from the phenomenon (landlocked countries). The importance of information technology and maritime sea routes is obvious in new global trade and commerce – the race to send new satellites into space and the current tensions for control in the Pacific are further proof of this fact.
  • 11.
    US Immigration Tendencies MigratoryFlows 19th Century to Today America, a Nation of Immigrants …America, a Nation of Immigrants … but is it still a Land of Immigration ?but is it still a Land of Immigration ?
  • 12.
    World Migration andImmmigration Tendencies United Nations report 2012 Despite the phenomenon ofDespite the phenomenon of globalisation and theglobalisation and the outsourcing of production andoutsourcing of production and jobs to south east Asia and thejobs to south east Asia and the other emerging worldother emerging world economies, the USA continueseconomies, the USA continues to be the country which attractsto be the country which attracts the most immigrants in thethe most immigrants in the world.world.
  • 13.
    A Timeline ofAmerican Immigration and Immigrants' OriginsA Timeline of American Immigration and Immigrants' Origins
  • 14.
    Document 1 ImmigrationBar Graph The bar chart shows that the USA has always attracted millions of immigrants to its shores, from the middle of the 19th century up to today. The numbers of immigrants has fluctuated with high points at the turn of the 20th century, a low point during and after WWII followed by a steady rise up to today when numbers are at an all time high. Document 2 Bar Graph of Immigrants' Origins What has changed is the region of origin of the immigrants. Historically, it was Europeans who emigrated massively at the trurn of the 20th century and then their numbers gradually dwindled up to and following WWII. If immigration has increased since that time it is because of new immigrants from Asia but essentially Latin America who have arrived in their millions.
  • 15.
    The New Immigarntsand where they settleThe New Immigarnts and where they settle
  • 16.
    Document 3 Chartshowing countries of origin of modern day immigrants This pie chart shows the make up of modern day immigrants arriving in the USA. Whilst 41% come from all over the world, 59% of thenew immigrants are from Latin America or South East Asia including India. By far the largest group of immigrants from one country are the Mexicans who make up over a quarter of all immigrants. Document 4 Map of the USA showing where immigrants settle This dot map shows clearly that the new immigrants have not spread evenly throughout the country. They have massed together in specific areas such as New York (wealth), the Great Lakes (industry), Florida (employment) but especially in Texas and on the west coast - the US-Mexican border runs between Texas and California. The vast majority of new Mexican immigrants have settled here (proximity/family) which has given rise to numerous problems (language/education/employment).
  • 17.
    The US-Mexico Border– Le Frontera – Facts and Figures The US-Mexico border is the international border between the two states. It has a length of 1969 miles or just over 3000 km. It is the most frequently crossed border in the world with over 250 million people crossing every year. It runs from San Diego / Tijuana on the Pacific coast to Brownsville / Matamoros in the Gulf of Mexico. Between these two extremities, the border crosses different terrains: the Rio Grande and the Colorado river, as well as scorching deserts and huge urban conurbations
  • 18.
    The Origins andMakeup of Illegal ImmigrationThe Origins and Makeup of Illegal Immigration
  • 19.
    Document 5 Originsand settlement of illegal immigrants The pie chart shows that the vast majority of illigal immigrants in the USA are from Latin America (over three quarters) and well over half of all illegal immigrants come specifically from Mexico. The bar chart shows us that the illegal immigrants have stayed very close to the border region of the USA and Mexico, especially California but also Florida, adding to the number of legal immigrants already there. Document 6 Make up of the illegal immigrant population The first pie chart shows the huge number of illegal immigrants in the USA – 11 million at the time but now around 13 million. Mexicans make up more than half of the number of illegal immigrants in the USA. More importantly, a high number are solo males and females which means young people looking for work, housing, education and eventually a family life.
  • 20.
    The Effects ofthe New Immigration on Traditional American SocietyThe Effects of the New Immigration on Traditional American Society
  • 21.
    Document 7 Graphshowing evolution of the Hispanic population of the USA This bar graph shows how the Hispanic population has increased 17 fold (1700%) since 1950 to reach 68 miliion today. Knowing that the population of the USA is around 317 million, the Hispanics make up 21% of the total number. The projection shows the possible evolution until 2050 when their number will have tripled, challenging caucasians as the main ethnic group in the country. Document 8 Graph of changing make up of US society between 2010 and 2030 What this bar chart makes clear is that all the ethnic groups which make up US society are stable (Black) or increasing (Asian, Other, Hispanic). The only ethnic group which is decreasing as a precentage of the total population are the caucasians (white).
  • 22.
    National Geographic Determined WhatAmericans Will Look Like in 2050 … and It's Beautiful
  • 25.
    This is acritical cartoon of corporate globalism. The man in the centre, representing the MNCs, is misquoting a speech by ML King in 1963 … he has added the word « trade » to « free ». Free trade was introduced on a global scale from the 1980s onwards. The stereotyped figure in the middle holds chains in his left hand and a whip in his right. The chains represent the WTO created in 1995 which replaced the GATT agreements. The WTO is supposed to help govern the global economic system but in the hands of MNCs it allows them to pay workers in poor countries extremely low wages and prevent them from having any workers rights – it maintains them in poverty. The whip stands for NAFTA (North American Free Trade Agreement) signed in 1994 which set up the free circulation of goods and services between Canada, the USA and Mexico- the largest trade bloc in the world. It has led to growing unemployment due to outsourcing and has reduced workers' rights as they fear for their jobs and livelihoods. Corporate globalisation benefits only MNCs and their shareholders' dividends while the workers of the world suffer, both in MICs and LICs. The rich get richer, the rest Outsourcing in More Industrialised Countries (MICs) Slave labour in Less Industrialised Countries (LICs) Greater profits from dividends and shares for the MNCs
  • 27.
    This is acartoon which criticizes corporate globalisation. In it, we can see two rather fat men,caricatures of businessmen, riding on the backs of the poor (here, they look Indian, Asian or African). One of the men represents global corporatism and the other the British East India Company. Modern global corporatism politely asks the way to the future whereas he is heading in the wrong direction – he's going back to the past. The figure representing the East India Company assures him he is going the right way. The British East India company was founded in 1600 and is consodered to be one of the first examples of an MNC. It was a private company, with no control over it from government. It became responsible for half of world trade over the next centuries. It exploited workers in foreign countries and imposed its own military rule in parts of India. This led to exploitation, starvation and genocide, as indicated on the signpost. Modern day corporate globalisation is pictured heading in the same direction meaning that it too does exactly the same today – exploiting poor workers around the world to make more profit for private companies. The past seems to be repeating itself or perhaos it means that the system has never really changed – international big business has always exploited others in order to make greater profits for the shareholders. Corporate globalisation is nothing more than modern day colonialism. The colonial past and modern globalisation are one and the same Colonialism and globalisation exploit the poor for their own benefits The richer countries, normally in the North, have always exploited the poor, traditionally in the South
  • 29.
    This is acartoon strip which criticises the effects of globalisation. In it we can see children in a queue, lining up to see Father Christmas (Santa Claus) in a department store. Normally children tell him what they would like for a Christmas present. All the traditional features are there – the big chair, the reindeer, the Christmas tree and the elf … but there is no Father Christmas. In his place, the children find a TV screen and they must tell a man in a call centre in Bangalore, India, what they would like. Christmas is the period when companies in the western world make most of their annual turnover (chiffre d'affaires). It is also a period which plays on our childhood memories. Here, everything has been changed by globalisation. As one of the children in the queue comments, Father Christmas has lost his job due to outsourcing – it was cheaper to employ an Indian in Bangalore than a man in the store. India, and Bangalore in particular, is home to most of the world's call centres where calls are redirected since the cost is low. The criticism seems to be that there are no limits to what MNCs will do make a profit – nothing is sacred, not even Father Christmas. Moreover, the girl looks surprised and confused – like many people who cannot understand why and how their lives and jobs are being effected by the consequences of globalisation. The cartoon plays on our childhood memories Nothing can resist the consequences of globalisation - nothing is sacred – not even Father Christmas We feel confused and often angry at events caused by globalisation which we cannot control
  • 30.
    GROUP 4 Globalization hasdirect, often disastrous effects on the environment. In the background, the air is polluted, nothing grows and animals die. However, there is always room for profit: the gas mask. Trade and commerce continue in the face of climatic catastrophe.
  • 31.
    GLOBAL ALTERNATIVES? Sustainable Development… Fair Trade … Slow Movement ...
  • 32.
    Sustainable Development … developmentthat meets the needs of the present without comprimising the ability of future generations to meet their own needs BRUTLAND COMMISSION 1987
  • 33.
    Fair Trade isa trading partnership, based on dialogue, transparency, and respect, that seeks greater equity in international trade. It contributes to sustainable development by offering better trading conditions to, and securing the rights of, marginalized producers and workers – especially in the South