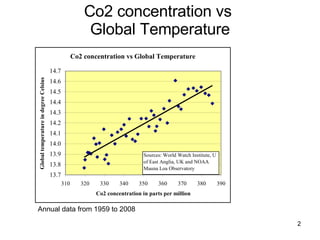
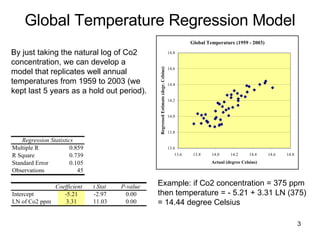
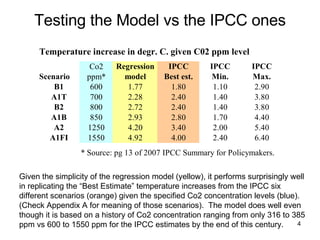
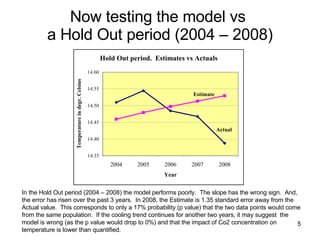
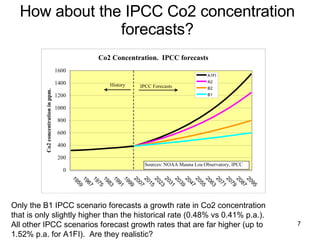
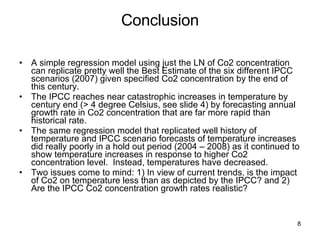
Presenting Climate Change Models that estimate and forecast global temperature levels in association or caused by CO2 concentration (ppm) levels. These models also replicate IPCC scenarios.
Climate change model forecast global temperature out to 2100Gaetan Lion
This study is leveraging a VAR model introduced in an earlier presentation to forecast global temperature out to 2100, and assess how likely are we to keep such temperatures at or under the + 1.5 degree Celsius threshold.
Krishna AchutaRao - Uncertainty from above - can it be reduced?STEPS Centre
Workshop on climate change and uncertainty from below and above, Delhi. http://steps-centre.org/2016/blog/climate-change-and-uncertainty-from-above-and-below/
2005 Carbon Dioxide Forecast for Alarm, NT, CanadaAdam Kuhn
Time series analysis and forecasting of carbon dioxide counts in Alarm, Northern Territories for the year 2005, projected from climate data from prior years.
Emissions slowdown: Are we on the way to 2°C?Glen Peters
A presentation I gave to the School of Economics and Business at the Norwegian University of Life Sciences (invitation from Knut Einar Rosendahl). I discuss recent emission trends, and link those to emission scenarios consistent with keeping global warming below 2°C.
A presentation I gave at the Solar Geoengineering and Carbon Dioxide Removal conference in Berlin (13/10/2017). I focus mainly on how the carbon budget is estimated, its uncertainties, and issues in how it is used.
Beyond carbon budgets & back to emission scenariosGlen Peters
A presentation I gave at the International Energy Agency (IEA) 6 September 2018. I focussed on carbon budget and the diverse array of scenarios consistent with the same temperature level.
A paper in 2017 argued for a considerable revision on the carbon budget for 1.5°C (https://www.nature.com/articles/ngeo3031), & I had some concerns (http://www.cicero.uio.no/no/posts/nyheter/commentary-did-15c-suddenly-get-easier). This is an extended presentation from a debate with the authors (https://www.youtube.com/watch?v=L7JS6x5fBNk)
Emissions slowdown: Are we on the way to 2°C?Glen Peters
A presentation to Industrial Ecology students at the Institute of Environmental Sciences (CML) at Leiden University, at the invitation of Rene Kleijn. I discuss recent trends in CO2 emissions, and link the recent slowdown to emission scenarios. I then go through some key features of 2C scenarios and implications for policy. In the presentation I did not get a chance to present the new scenarios, Shared Socioeconomic Pathways (SSPs), or on stranded assets, but the slides are still included.
A critical look at baseline climate scenariosGlen Peters
A presentation to the Tekna Energy, Industry, and Environment group on RCP8.5. Video available here https://www.tekna.no/fag-og-nettverk/miljo-og-biovitenskap/bio-og-klimabloggen/a-critical-look-at-baseline-climate-scenarios/
Emissions slowdown: Are we on the way to 2C?Glen Peters
A 10 minute presentation (https://www.youtube.com/watch?v=zXhpRt14ccA) on the main causes of the recent slowdown in global carbon dioxide emissions. Builds on a recent paper in Nature Climate Change (http://www.nature.com/nclimate/journal/v7/n2/full/nclimate3202.html).
OERC Seminar September 2018
Bob Lloyd
Director Raynbird Consultants
Former Assoc Professor , Department of Physics, Otago University
The talk will cover the mitigation strategies given in the IPCC AR5 report. How these have changed since 2015 in terms of the climate change models available. I will also discuss the methane problem, the forest CO2 removals problem and the carbon budgets available to mitigate sufficiently, to stay below global temperature rises that could cause runaway climate change scenarios. For NZ, a recap of the latest 7th National communication to the UN and the Governments NZ zero emissions plan for 2050. Is it sufficient and does it have the right targets that will prevent the global problem. Finally I will discuss my efforts in developing countries (The Pacific Island Nations) in developing their mitigation plans and the conflict in such countries between mitigation and development
Tracking progress to "well below 2°C" in overshoot scenriosGlen Peters
My presentation at the International Conference on Negative CO₂ Emissions in Gothenburg, 22-24 May 2018. I focus on key issues on tracking progress when it is possible to overshoot the target, but didn't make much progress on actual indicators.
A presentation on the Social Cost of Carbon at the Norwegian Environmental Agency. I presented on mitigation scenarios with a few reflections on carbon prices and relationship of policy with the SCC.
My presentation at ONS2018 (Centre Court) in Stavanger, 27 August 2018. http://www.ons.no/
Yes, there is place for new oil in a 2°C world, but how much & what criteria is up for discussion (and analysis).
Sacramento's population projections for the State of California are already 1.4 million too high only 3 years into the forecast by 2023. The reason is Sacramento's unrealistic migration assumption. This analysis tests in detail how and why this projection went so wrong.
This study analyzes the temperature history of 24 American cities going back to 1895. Using a LOESS model, it forecasts prospective temperature increases over the next 40 years and out to 2100. And, it compares the 2100 forecast with the NOAA model(s). This comparison uncovers serious deficiencies within the NOAA model(s), as it does not fit the historical data well; and it does not differentiate much forecasts between various cities.
Compact Letter Display (CLD). How it worksGaetan Lion
Compact Letter Display (CLD) renders ANOVA & Tukey HSD testing a lot easier to interpret. It readily ranks and differentiate the tested variables. With CLD you can readily identify the variables that are statistically dissimilar vs. the ones that are similar.
This study compares the benefits and the funding for CalPERS pensions vs. Social Security. It also looks in more detail on the financial burden of CalPERS pensions on the Marin Municipal Water District.
This presentation includes two explanatory models to attempt to predict recessions. The first one is a logistic regression. The second one is a deep neural network (DNN). Both use the same set of independent variables: the velocity of money, inflation, the yield curve, and the stock market. As usual, the DNN fits the historical data a bit better than the simpler logistic regression. But, when it comes to testing or predicting, both models are pretty much even.
Objective:
Studying trends in US inequality along several social dimensions including education, ethnicity, percentiles, and work status. We don’t explore gender because it is not disaggregated within the mentioned data that focuses on families (fairly similar to households).
Data source:
US Government Survey of Consumer Finance (SCF) data. The SCF aggregates financial data on US families every three years. And, it discloses a time series from 1989 to 2019.
The model development two objectives are:
1) To explain home prices using demographic explanatory variables; and
2) To benchmark the accuracy of OLS regressions vs. DNN models.
For home prices, we used county level data from Zillow. For the explanatory variables, we used data from GEOFRED.
This analysis focuses on population aging, population age categories in % (age pyramids), and overall population growth. It looks at various geographic units (countries, continents, regions, World) from 1950 to the Present (2019 & 2020). And, it looks at projections out to 2100.
Africa is an outlier to the overall global aging; its population growth (historical & projected) is far faster than for other major regions.
We are going to analyze several of the major cryptocurrencies as an asset class. And, we are going to address several related questions:
Do they provide diversification benefits relative to the stock market (S&P 500)?
How do their diversification benefits compare with Gold’s diversification benefit vs. the stock market?
Do cryptocurrencies provide diversification benefits when you really need it… during market downturns?
Are cryptocurrencies truly “digital Gold”? Do they behave in a similar way given that their supply is constrained (supposedly in a similar way as Gold is)?
We will test whether :
a) Sequential Deep Neural Networks (DNNs) can predict the stock market (S&P 500) better than OLS regression;
b) DNNs using smooth Rectified Linear activation functions perform better than the ones using Sigmoid (Logit) activation functions.
Can Treasury Inflation Protected Securities predict Inflation?Gaetan Lion
We look at the spread between Treasuries and TIPS to figure out how effective such observations were in predicting actual inflation several years down the road.
This analysis focuses on measures much beyond PE ratios. And, it concludes that the Stock Market is actually really cheap vs. bonds. But, it appears quite overvalued when focusing on inflation measures.
The relationship between the Stock Market and Interest RatesGaetan Lion
This is a study of the relationship between the Stock Market and Interest Rates. We review how the Stock Market has reacted when interest rates rise. We also factor the influence of other macroeconomics variables.
This is a study using historical data and forecasts of life expectancy for several countries. The data and forecasts come from the UN - Population Division. While the historical data is most interesting, the forecasts are highly optimistic as they project a linear trend way into the future. Meanwhile, those forecasts should have followed a much more realistic logarithmic curve reflecting slower increase in life expectancy as the life expectancy rises.
Will Stock Markets survive in 200 years?Gaetan Lion
This study uncovers 11 international stock markets that are already running into existing and prospective demographic and economic growth constraints. This study evaluates their respective fragile long term viability and the implications this has for the investors in such countries.
This study answers three questions:
1) Does it make a difference whether you standardize your variables before running your model or standardize the regression coefficients after you run your model?
2) Does the scale of the respective original non-standardized variables affect the resulting standardized coefficients?
3) Does using non-standardized variables vs. standardized variables have an impact when conducting regularization (Ridge Regression, LASSO)?
This analysis compares his track record vs. Manning, Montana, Marino, Brees, Favre, and Elway. At the end of this analysis, it makes extensive use of the binomial distribution to figure out how much of their respective track records are due to randomness vs. skills.
Regularization why you should avoid themGaetan Lion
Regularization models are supposed to reduce model over-fitting and improve forecasting accuracy. Very often they do just the opposite: increase model under-fitting, and decrease model forecasting accuracy. This study explains how Regularization models often fail, and how to resolve model issues with far simpler and more robust methods.
This study reviews the increasing prevalence of 3-shot points within the NBA. It also compares the record of the 5 top players in NBA history in 3-pt shots. It also considers how many good years left Curry may have.
‘वोटर्स विल मस्ट प्रीवेल’ (मतदाताओं को जीतना होगा) अभियान द्वारा जारी हेल्पलाइन नंबर, 4 जून को सुबह 7 बजे से दोपहर 12 बजे तक मतगणना प्रक्रिया में कहीं भी किसी भी तरह के उल्लंघन की रिपोर्ट करने के लिए खुला रहेगा।
31052024_First India Newspaper Jaipur.pdfFIRST INDIA
Find Latest India News and Breaking News these days from India on Politics, Business, Entertainment, Technology, Sports, Lifestyle and Coronavirus News in India and the world over that you can't miss. For real time update Visit our social media handle. Read First India NewsPaper in your morning replace. Visit First India.
CLICK:- https://firstindia.co.in/
#First_India_NewsPaper
In a May 9, 2024 paper, Juri Opitz from the University of Zurich, along with Shira Wein and Nathan Schneider form Georgetown University, discussed the importance of linguistic expertise in natural language processing (NLP) in an era dominated by large language models (LLMs).
The authors explained that while machine translation (MT) previously relied heavily on linguists, the landscape has shifted. “Linguistics is no longer front and center in the way we build NLP systems,” they said. With the emergence of LLMs, which can generate fluent text without the need for specialized modules to handle grammar or semantic coherence, the need for linguistic expertise in NLP is being questioned.
01062024_First India Newspaper Jaipur.pdfFIRST INDIA
Find Latest India News and Breaking News these days from India on Politics, Business, Entertainment, Technology, Sports, Lifestyle and Coronavirus News in India and the world over that you can't miss. For real time update Visit our social media handle. Read First India NewsPaper in your morning replace. Visit First India.
CLICK:- https://firstindia.co.in/
#First_India_NewsPaper
हम आग्रह करते हैं कि जो भी सत्ता में आए, वह संविधान का पालन करे, उसकी रक्षा करे और उसे बनाए रखे।" प्रस्ताव में कुल तीन प्रमुख हस्तक्षेप और उनके तंत्र भी प्रस्तुत किए गए। पहला हस्तक्षेप स्वतंत्र मीडिया को प्रोत्साहित करके, वास्तविकता पर आधारित काउंटर नैरेटिव का निर्माण करके और सत्तारूढ़ सरकार द्वारा नियोजित मनोवैज्ञानिक हेरफेर की रणनीति का मुकाबला करके लोगों द्वारा निर्धारित कथा को बनाए रखना और उस पर कार्यकरना था।
03062024_First India Newspaper Jaipur.pdfFIRST INDIA
Find Latest India News and Breaking News these days from India on Politics, Business, Entertainment, Technology, Sports, Lifestyle and Coronavirus News in India and the world over that you can't miss. For real time update Visit our social media handle. Read First India NewsPaper in your morning replace. Visit First India.
CLICK:- https://firstindia.co.in/
#First_India_NewsPaper
role of women and girls in various terror groupssadiakorobi2
Women have three distinct types of involvement: direct involvement in terrorist acts; enabling of others to commit such acts; and facilitating the disengagement of others from violent or extremist groups.
3. Global Temperature Regression Model By just taking the natural log of Co2 concentration, we can develop a model that replicates well annual temperatures from 1959 to 2003 (we kept last 5 years as a hold out period). Example: if Co2 concentration = 375 ppm then temperature = - 5.21 + 3.31 LN (375) = 14.44 degree Celsius
4. Testing the Model vs the IPCC ones Given the simplicity of the regression model (yellow), it performs surprisingly well in replicating the “Best Estimate” temperature increases from the IPCC six different scenarios (orange) given the specified Co2 concentration levels (blue). (Check Appendix A for meaning of those scenarios). The model does well even though it is based on a history of Co2 concentration ranging from only 316 to 385 ppm vs 600 to 1550 ppm for the IPCC estimates by the end of this century.
5. Now testing the model vs a Hold Out period (2004 – 2008) In the Hold Out period (2004 – 2008) the model performs poorly. The slope has the wrong sign. And, the error has risen over the past 3 years. In 2008, the Estimate is 1.35 standard error away from the Actual value. This corresponds to only a 17% probability (p value) that the two data points would come from the same population. If the cooling trend continues for another two years, it may suggest the model is wrong (as the p value would drop to 0%) and that the impact of Co2 concentration on temperature is lower than quantified.
6. Is the Model poor because it does not capture the effect of other greenhouse gases? … Not necessarily, the IPCC Summary of 2007 suggests that Co2 accounts for 96.5% of the total greenhouse effect.
7. How about the IPCC Co2 concentration forecasts? Only the B1 IPCC scenario forecasts a growth rate in Co2 concentration that is only slightly higher than the historical rate (0.48% vs 0.41% p.a.). All other IPCC scenarios forecast growth rates that are far higher (up to 1.52% p.a. for A1FI). Are they realistic?
8.
9. Appendix A: IPCC Scenarios Definitions As a reference historical CAGR of Co2 concentration was only 0.41% between 1959 and 2008. Source: 2007 IPCC Summary for Policymakers.