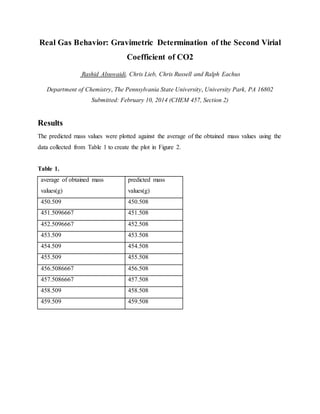
1. The document reports on an experiment to determine the second virial coefficient of carbon dioxide gas through gravimetric measurements at varying pressures and temperatures.
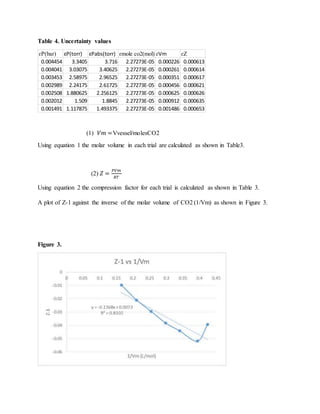
2. A plot of compression factor versus inverse molar volume yielded a second virial coefficient of -0.1368±0.02962 L/mol with an R2 value of 0.8102, indicating some experimental errors.
3. The obtained value has a 22.83% difference from the literature value of -0.1270 L/mol, which is within the experimental uncertainty likely due to temperature fluctuations during the experiment.
1. Real Gas Behavior: Gravimetric Determination of the Second Virial
Coefficient of CO2
Rashid Alsuwaidi, Chris Lieb, Chris Russell and Ralph Eachus
Department of Chemistry, The Pennsylvania State University, University Park, PA 16802
Submitted: February 10, 2014 (CHEM 457, Section 2)
Results
The predicted mass values were plotted against the average of the obtained mass values using the
data collected from Table 1 to create the plot in Figure 2.
Table 1.
average of obtained mass
values(g)
predicted mass
values(g)
450.509 450.508
451.5096667 451.508
452.5096667 452.508
453.509 453.508
454.509 454.508
455.509 455.508
456.5086667 456.508
457.5086667 457.508
458.509 458.508
459.509 459.508
2. Figure 1.
The graph in Figure 1 was plotted to guarantee balance accuracy and an R2 of 1 proves it an
accurate mass.
Table 2.
The pressure was calculated in bars but were converted to torr units. This was added with the
atmospheric temperature to calculate the absolute pressure. By subtracting the mass of the vessel
and mass of vessel with CO2 gas you will get the mass of CO2.This is divided by its molecular
weight of 44g/mol to get the amount of CO2 in moles. A plot of absolute pressure against moles
of CO2 was created as shown in Figure 2.
temp(˚K) pressure(bar) pressure(torr) Pabs(torr) mass of vessel(g) mass of vessel +gas(g) masss of co2(g) moles co2(mol)
292.85 8.908 6681 7432 449.508 459.97 10.462 0.237772727
292.75 8.082 6061.5 6812.5 449.508 459.227 9.719 0.220886364
292.75 6.906 5179.5 5930.5 449.508 457.9 8.392 0.190727273
292.75 5.978 4483.5 5234.5 449.508 456.87 7.362 0.167318182
292.95 5.015 3761.25 4512.25 449.508 455.793 6.285 0.142840909
293.05 4.024 3018 3769 449.508 454.71 5.202 0.118227273
292.95 2.981 2235.75 2986.75 449.508 453.585 4.077 0.092659091
3. Figure 2.
The y-intercept was calculated to be 182.5±48.8 torr which is the amount of pressure in the
vessel when you have no CO2.This must be zero because the vessel should contain no gases but
it is probably air that has entered the vessel.
Table 3.
Vm Z Z-1 1/Vm
2.360237 0.960528 -0.03947 0.423686
2.540673 0.948096 -0.0519 0.393597
2.942421 0.955858 -0.04414 0.339856
3.354089 0.961716 -0.03828 0.298144
3.928846 0.970417 -0.02958 0.254528
4.74679 0.97899 -0.02101 0.210669
6.05661 0.990214 -0.00979 0.165109
4. Table 4. Uncertainty values
(1) 𝑉𝑚 =Vvessel/molesCO2
Using equation 1 the molar volume in each trial are calculated as shown in Table3.
(2) 𝑍 =
𝑃𝑉𝑚
𝑅𝑇
Using equation 2 the compression factor for each trial is calculated as shown in Table 3.
A plot of Z-1 against the inverse of the molar volume of CO2 (1/Vm) as shown in Figure 3.
Figure 3.
ɛP(bar) ɛP(torr) ɛPabs(torr) ɛmole co2(mol) ɛVm ɛZ
0.004454 3.3405 3.716 2.27273E-05 0.000226 0.000613
0.004041 3.03075 3.40625 2.27273E-05 0.000261 0.000614
0.003453 2.58975 2.96525 2.27273E-05 0.000351 0.000617
0.002989 2.24175 2.61725 2.27273E-05 0.000456 0.000621
0.002508 1.880625 2.256125 2.27273E-05 0.000625 0.000626
0.002012 1.509 1.8845 2.27273E-05 0.000912 0.000635
0.001491 1.117875 1.493375 2.27273E-05 0.001486 0.000653
5. Using Figure 3, the second viral coefficient was determined from the slope which is -
0.1368±0.02962L/mol.The R2 value was 0.8102 which indicates that the data was not consistent
and had many errors.
Discussion
In Figure 1, we got and R2 of 1 which meant we got good measurements for the mass of the
vessel. In Figure 2, the y-intercept was calculated to be 182.5±48.8 torr which is the amount of
pressure in the vessel when you have no CO2.This must be zero because the vessel should
contain no gases but it is probably air that has entered the vessel and this contributed some error
in our experiment.. We got and R2 of 0.9996 which meant our data is consistent. The second viral
coefficient (B) was determined from the slope in Figure 3 which was -0.1368±0.02962L/mol.The
R2 value was 0.8102 which indicates that the data was not consistent and had many errors. This
was probably due to difficulties in maintaining a constant temperature at 19.8˚C during the
experiment. The literature value for the second viral coefficient is 127cm3/mol which is -0.1270
L/mol at 292.95K (19.8˚C).2 This is a 22.83% difference which is within the uncertainty.