Global Innovation Index 2022
•
0 likes•79 views

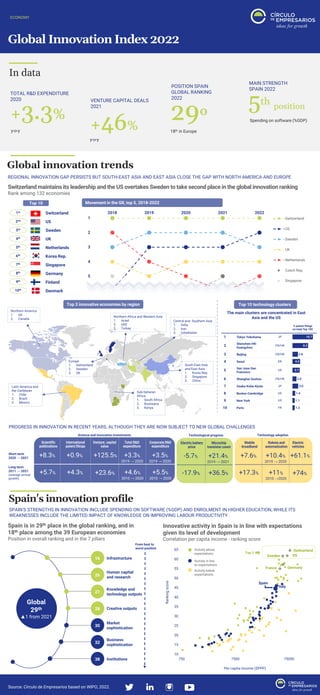
Global innovation trends REGIONAL INNOVATION GAP PERSISTS BUT SOUTH-EAST ASIA AND EAST ASIA CLOSE THE GAP WITH NORTH AMERICA AND EUROPE Switzerland maintains its leadership and the US overtakes Sweden to take second place in the global innovation ranking Spain's innovation profile SPAIN'S STRENGTHS IN INNOVATION INCLUDE SPENDING ON SOFTWARE (%GDP) AND ENROLMENT IN HIGHER EDUCATION, WHILE ITS WEAKNESSES INCLUDE THE LIMITED IMPACT OF KNOWLEDGE ON IMPROVING LABOUR PRODUCTIVITY Spain is in 29th place in the global ranking, and in 18th place among the 39 European economies Innovative activity in Spain is in line with expectations given its level of development
Recommended

Recommended
More Related Content
Similar to Global Innovation Index 2022
Similar to Global Innovation Index 2022 (20)
More from Círculo de Empresarios
More from Círculo de Empresarios (20)
Recently uploaded
Recently uploaded (20)
Global Innovation Index 2022
- 1. Global Innovation Index 2022 ECONOMY In data Global innovation trends REGIONAL INNOVATION GAP PERSISTS BUT SOUTH-EAST ASIA AND EAST ASIA CLOSE THE GAP WITH NORTH AMERICA AND EUROPE Source: Círculo de Empresarios based on WIPO, 2022. TOTAL R&D EXPENDITURE 2020 +3.3% y-o-y 5th position MAIN STRENGTH SPAIN 2022 Spending on software (%GDP) POSITION SPAIN GLOBAL RANKING 2022 29º 18th in Europe Spain's innovation profile SPAIN'S STRENGTHS IN INNOVATION INCLUDE SPENDING ON SOFTWARE (%GDP) AND ENROLMENT IN HIGHER EDUCATION, WHILE ITS WEAKNESSES INCLUDE THE LIMITED IMPACT OF KNOWLEDGE ON IMPROVING LABOUR PRODUCTIVITY Spain is in 29th place in the global ranking, and in 18th place among the 39 European economies Position in overall ranking and in the 7 pillars VENTURE CAPITAL DEALS 2021 +46% y-o-y Switzerland maintains its leadership and the US overtakes Sweden to take second place in the global innovation ranking Rank among 132 economies Innovative activity in Spain is in line with expectations given its level of development Correlation per capita income - ranking score Spain Italy France Sweden Germany US Switzerland 10 15 20 25 30 35 40 45 50 55 60 65 750 7500 75000 Ranking score Per capita income ($PPP) Activity above expectations Activity in line to expectations Activity below expectations Movement in the GII, top 5, 2018-2022 Top 10 Switzerland 1st US Sweden UK Netherlands Korea Rep. Singapore Germany Finland Denmark 2nd 3rd 4th 5th 6th 7th 8th 9th 10th 1 2 3 4 5 2018 2019 2020 2021 2022 Switzerland US Sweden UK Netherlands Czech Rep. Singapore Top 3 innovative economies by region Northern America 1. US 2. Canada Latin America and the Caribbean 1. Chile 2. Brazil 3. Mexico Europe 1. Switzerland 2. Sweden 3. UK Sub-Saharan Africa 1. South Africa 2. Bostwana 3. Kenya Northern Africa and Western Asia 1. Israel 2. UAE 3. Turkey Central and Southern Asia 1. India 2. Iran 3. Uzbekistan South East Asia and East Asia 1. Korea Rep. 2. Singapore 3. China Top 10 technology clusters The main clusters are concentrated in East Asia and the US PROGRESS IN INNOVATION IN RECENT YEARS, ALTHOUGH THEY ARE NOW SUBJECT TO NEW GLOBAL CHALLENGES Short term 2020 → 2021 Long term 2011 → 2021 (average annual growth) Electric battery price Microchip transistor count -5.7% +21.4% 2019 → 2021 -17.9% +36.5% Technological progress Mobile broadband Robots and automatization Electric vehicles +7.6% +10.4% 2019 → 2020 +61.1% +74% +17.3% +11% 2010 →2020 Technology adoption 16 Global 29th ▲1 from 2021 26 27 28 30 32 38 Infrastructure Human capital and research Knowledge and technology outputs Creative outputs Market sophistication Business sophistication Institutions From best to worst position Top 3 Scientific publications International patent filings Venture capital value +8.3% +0.9% +125.5% +23.6% +5.7% +4.3% Science and innovation investments Total R&D expenditure +3.3% 2019 → 2020 +4.6% 2010 → 2020 Corporate R&D expenditure +3.5% 2019 → 2020 +5.5% 2010 → 2020