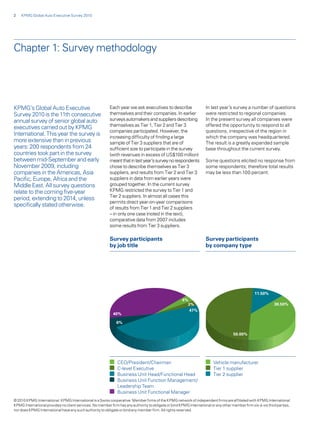
Au to m ot i v e


KPMG’s Global Auto Executive
Survey 2010
Industry Concerns and Expectations to 2014


kpm g i nt e r n A t i o n A l
Contents


Chapter                                                                                                                                                         Page
1 Survey methodology                                                                                                                                               2
2 Executive summary                                                                                                                                                3
3 Introduction                                                                                                                                                     4
4 The growth prospect                                                                                                                                              6
  Executive view: volume automaker – Europe                                                                                                                        8
  Overcapacity is now critical                                                                                                                                     9
  Emerging markets are becoming overbuilt                                                                                                                         11
5 The performance angle                                                                                                                                           12
  Executive view: mid-size automaker – US                                                                                                                         14
  No easy cost savings expected                                                                                                                                   15
  Capital costs to remain high                                                                                                                                    17
  M&A set to grow                                                                                                                                                 18
  Debt and technology needs will drive M&A                                                                                                                        20
6 Product innovation and consumer change                                                                                                                          22
  Fuel efficiency and environment top of consumer concerns                                                                                                        24
  Low-cost producers to win most market share                                                                                                                     26
  Hybrid technology rated clear leader                                                                                                                            28
  Executive view: large Tier 1 supplier – US                                                                                                                      30
  R&D will win most investment                                                                                                                                    31
7 Investing in new markets                                                                                                                                        34
  Executive view: diversified supplier – emerging market                                                                                                          36
  BRIC sales forecasts continue to grow                                                                                                                           37
  Smaller emerging markets to gain                                                                                                                                40


© 2010 KPMG International. KPMG International is a Swiss cooperative. Member firms of the KPMG network of independent firms are affiliated with KPMG International.
KPMG International provides no client services. No member firm has any authority to obligate or bind KPMG International or any other member firm vis-à-vis third parties,
nor does KPMG International have any such authority to obligate or bind any member firm. All rights reserved.
Foreword       1


Foreword


                                                          KPMG’s Global Auto Executive Survey                        And there are huge technology challenges
                                                          2010 was conducted at the end of a historic                to be met. Last year companies told
                                                          year for the auto business. The intensity of               us that fuel efficiency and emissions
                                                          the crisis that engulfed the entire industry               improvements were top of their agenda.
                                                          can hardly be underestimated.                              This year they are still top of their agenda.

                                                          Last year we surveyed an industry that                     Meanwhile, companies face the challenge
                                                          had been plunged, very suddenly, into                      of financing the cycle of innovation – and
                                                          total uncertainty. As one of the large                     let us not forget that we are still in the
                                                          automakers interviewed as part of this                     middle of a rapid innovation cycle – while
                                                          year’s report said, “a year ago we were                    consumers feel they are poorer than
Dieter Becker                                             in the middle of nowhere … anything                        before, and less inclined to spend. That,
Global Chair, Automotive                                  was possible.”                                             say our respondents, means that companies
KPMG ELLP                                                                                                            are likely to have to compete on technology
                                                          This crisis was in part a consequence                      and on cost. That is a tall order.
                                                          of success. Auto products are better
                                                          than they have ever been: with today’s                     Meeting that challenge inevitably means
                                                          high levels of reliability and longevity,                  more change – more change in the structure
                                                          many customers can defer the purchase                      and in the practices of the auto industry.
                                                          of a new vehicle. So when confidence                       If anything is clear from what respondents
                                                          collapsed on a global scale at the end                     are saying to us today, it is that change has
                                                          of 2008, that is exactly what customers                    only just begun.
                                                          did. Sales plummeted in almost every
                                                          market, while financial conditions became
                                                          intolerable even for companies with
                                                          moderate levels of indebtedness. The
                                                          destruction of large segments of the
                                                          world’s auto industry – and other
                                                          industries too – became a real possibility.

                                                          As our survey records, the industry is
                                                          already on the way out of that period
                                                          of crisis. Confidence is higher, while
                                                          growth and new investment are back
                                                          on the agenda.

                                                          But more striking is the record of auto
                                                          industry caution that the survey depicts.
                                                          We have come a long way, respondent
                                                          companies are saying, but we have a lot
                                                          further to go. In particular, we note that
                                                          many companies are saying that
                                                          overcapacity is still at very high levels –
                                                          respondents believe it is significantly
                                                          higher than last year, despite a year of
                                                          closures and bankruptcies – and the
                                                          consequence is that much of the
                                                          expected restructuring of the industry
                                                          may still lie in the future.
© 2010 KPMG International. KPMG International is a Swiss cooperative. Member firms of the KPMG network of independent firms are affiliated with KPMG International.
KPMG International provides no client services. No member firm has any authority to obligate or bind KPMG International or any other member firm vis-à-vis third parties,
nor does KPMG International have any such authority to obligate or bind any member firm. All rights reserved.
2   KPMG Global Auto Executive Survey 2010


Chapter 1: Survey methodology


KPMG’s Global Auto Executive                              Each year we ask executives to describe                    In last year’s survey a number of questions
Survey 2010 is the 11th consecutive                       themselves and their companies. In earlier                 were restricted to regional companies.
annual survey of senior global auto                       surveys automakers and suppliers describing                In the present survey all companies were
                                                          themselves as Tier 1, Tier 2 and Tier 3                    offered the opportunity to respond to all
executives carried out by KPMG
                                                          companies participated. However, the                       questions, irrespective of the region in
International. This year the survey is                    increasing difficulty of finding a large                   which the company was headquartered.
more extensive than in previous                           sample of Tier 3 suppliers that are of                     The result is a greatly expanded sample
years: 200 respondents from 24                            sufficient size to participate in the survey               base throughout the current survey.
countries took part in the survey                         (with revenues in excess of US$100 million)
between mid-September and early                           meant that in last year’s survey no respondents            Some questions elicited no response from
November 2009, including                                  chose to describe themselves as Tier 3                     some respondents; therefore total results
companies in the Americas, Asia                           suppliers, and results from Tier 2 and Tier 3              may be less than 100 percent.
Pacific, Europe, Africa and the                           suppliers in data from earlier years were
Middle East. All survey questions                         grouped together. In the current survey
relate to the coming five-year                            KPMG restricted the survey to Tier 1 and
                                                          Tier 2 suppliers. In almost all cases this
period, extending to 2014, unless
                                                          permits direct year-on-year comparisons
specifically stated otherwise.                            of results from Tier 1 and Tier 2 suppliers
                                                          – in only one case (noted in the text),
                                                          comparative data from 2007 includes
                                                          some results from Tier 3 suppliers.

                                                          Survey participants                                        Survey participants
                                                          by job title                                               by company type


                                                                                                                                                  11.50%
                                                                                                      4%
                                                                                                        3%                                                    38.50%
                                                                                                         47%
                                                            40%

                                                              6%

                                                                                                                                     50.00%


                                                           CEO/President/Chairman                                        Vehicle manufacturer
                                                           C-level Executive                                             Tier 1 supplier
                                                           Business Unit Head/Functional Head                            Tier 2 supplier
                                                                   Vehicle Manufacturer
                                                           Business Unit Function Management/                                                 Tier 1 Supplier
                                                           Leadership Team
                                                        CEO/President/ChairmanManager
                                                           Business Unit Functional                                                                                         C-level exe
© 2010 KPMG International. KPMG International is a Swiss cooperative. Member firms of the KPMG network of independent firms are affiliated with KPMG International.
                                                       Business Unit Head/Functional Head
KPMG International provides no client services. No member firm has any authority to obligate or bind KPMG International or any other member firm vis-à-vis third parties,
                                                                                                                                                                            Business U
nor does KPMG International have any such authority to obligate or bind any member firm. All rights reserved.
                                                        Business Unit Functional Manager
Executive Summary         3


Chapter 2: Executive Summary


Key results                                               The performance angle                                      Alternative propulsion technologies are
Expectations of emerging market                           Profitability expectations have fallen.                    the key technological focus for companies.
performance and auto investment                           Respondents believe best performers will                   Electric power ranks only just behind
accumulation have strengthened                            be companies able to leverage the whole                    hybrid power developments and battery
considerably.                                             of the supply chain, with higher profits                   and fuel-cell approaches are ascribed
                                                          expected of automakers, and the lowest                     almost equal priority.
Overcapacity is still seen to be very high                expectation for Tier 3 suppliers.
over the five-year period in the Americas,                                                                           Companies say they will direct most
Europe and Japan; M&A activity is                         Companies expect financial conditions                      investment capital to technology and
expected to be strong.                                    to improve, but only moderately, with                      new model development. New plant
                                                          conditions better for consumers than                       building is accorded very low priority.
The long-term investment focus remains                    for companies.
on new products and new technologies,                                                                                New markets
especially fuel efficiency.                               Expectations for M&A have risen, marginally,               Companies are nearly unanimous in
                                                          from an already high level in the preceding                expecting emerging markets to build most
The growth prospect                                       year, with the exception of the dealer                     automotive capacity and to provide the
All emerging economy regions are                          business, where after a year of closure                    most growth in automotive revenues.
expected to contribute growth: not only                   and rationalization companies now see                      The majority of companies surveyed say
Asia excluding Japan, but also Eastern                    M&A falling back.                                          they intend to increase their investments
Europe and Russia.                                                                                                   in the BRICs.
                                                          Companies expect to find fewer cost-saving
Growth expectations for Western Europe                    opportunities in existing businesses.                      Expectations for both domestic and
are low, and lower still for both Japan and                                                                          export Chinese sales have increased.
North America.                                            Product innovation and
                                                          consumer change                                            The consensus view of companies on
The industry still believes that overcapacity             New products and new technologies have                     sales growth in Brazil, India and Russia
in the established manufacturing “triad” –                moved higher in the ranking of concerns                    is also strong, although Russian export
North America, Europe and Japan –                         from an already high leading position.                     potential is not rated so highly.
remains very high.
                                                          Fuel efficiency and the environmental                      Beyond the BRICs companies expect
Companies also have strong concerns                       profile of products continue to be                         strong demand growth and auto
over the emergence of automotive                          considered by companies the most                           investment in South East Asia and
overcapacity in the BRICs. Concern is                     significant consumer buying issues.                        in Eastern Europe.
highest in Russia but companies also
believe that the automotive industry                      Chinese and Indian brands remain in the                    Top-rated individual destinations for
in Brazil will be overbuilt in the near to                top three places in terms of expectation of                auto investment beyond the BRICs
medium term, and that China and India                     market share gain, but conviction is slightly              are Ukraine, Thailand and Mexico.
will also have significant overcapacity                   lower than last year. Two significant
not much later.                                           winners of market share competition are
                                                          seen as Hyundai/Kia and VW.

                                                          Companies in all three global regions cite
                                                          exactly the same three vehicle types as top
                                                          market share gainers (hybrids, other
                                                          alternative-fuel vehicles and low-cost
                                                          introduction cars).


© 2010 KPMG International. KPMG International is a Swiss cooperative. Member firms of the KPMG network of independent firms are affiliated with KPMG International.
KPMG International provides no client services. No member firm has any authority to obligate or bind KPMG International or any other member firm vis-à-vis third parties,
nor does KPMG International have any such authority to obligate or bind any member firm. All rights reserved.
4   KPMG Global Auto Executive Survey 2010


Chapter 3: Introduction


Last year’s KPMG Global Auto Executive                    Yet the worst was avoided. Exceptional                     But we are left with a world that has
Survey reported on an industry falling into               government intervention helped to shield                   changed: a deep restructuring of the
crisis. Sales were collapsing, growth                     the industry from the worst of the fall in                 automotive industry has begun, and
expectations were swinging from positive                  demand, and allowed some companies                         continues. One dimension of this has
to negative, investment schedules were                    to begin to rebuild themselves behind the                  been a significant transfer of automotive
being torn up, and for more than one large                wall of temporary bankruptcy. Above all,                   technology to the emerging world.
company, bankruptcy loomed.                               the sudden loss of confidence in demand                    Existing producers with lower costs have
                                                          and growth in the big emerging economies                   seen their businesses strengthened.
This year, we report on an industry that                  was counteracted by an equally sudden                      And with a global market that has clearly
has confronted the crisis, and has just                   resurgence, as it became clear that                        shrunk, many established producers are
begun to emerge into a landscape of                       emerging world growth was much more                        having to confront the fact that competition
greater stability. In many ways the crisis                resilient than pessimists feared. The                      for sales is likely to be much, much
was much worse than the gloomiest                         stabilization and subsequent recovery of                   tougher in the next few years than any
predictions. Bankruptcy became a reality                  asset prices against a background of less                  time in the last two decades.
for a number of large automakers, as                      volatile energy costs helped immeasurably.
demand fell further and faster than                                                                                  As one European automaker interviewed
expected, and as the ability of indebted                                                                             for this report commented: “this last year
businesses to finance themselves simply                                                                              has made us confront reality”.
evaporated.


© 2010 KPMG International. KPMG International is a Swiss cooperative. Member firms of the KPMG network of independent firms are affiliated with KPMG International.
KPMG International provides no client services. No member firm has any authority to obligate or bind KPMG International or any other member firm vis-à-vis third parties,
nor does KPMG International have any such authority to obligate or bind any member firm. All rights reserved.
6   KPMG Global Auto Executive Survey 2010


Chapter 4: The growth prospect


The current survey shows that the gradual                 All emerging economy regions are                                          On a regional basis, pessimism on
reorientation of growth expectations away                 expected to contribute growth: not only                                   revenues in the Americas is strongest
from the mature economies and toward                      Asia (excluding Japan), but also Eastern                                  in European and Asian companies.
Asia and other significant emerging                       Europe and Russia. The balance of                                         Companies in the Americas are slightly
economies has passed a tipping point.                     expectations for Western Europe is now                                    more positive both regarding their own
Although previous surveys show that                       even between companies expecting                                          region, and on growth prospects in Asia.
companies have consistently been                          some decline and companies expecting
forecasting a decline in the growth trend                 some improvement (most expect little
for some years, the great majority of                     change), but the balance Increase
                                                                                   is negative for                                   Stable                              Decline
companies now locate all their significant                both Japan and North America: more
growth expectations for the next five                     companies now expect decline in those
years in the emerging world.                              regions than expect improvement.

                                                          What are your forecasts for auto industry revenues
                                                          in the following regions and countries?

                                                          • Growth expectations largely geared to Asia
                                                          • Eastern Europe shows second biggest increase
                                                          • Biggest declines seen in North America and Japan
                                                                                                                    ia
                                                                                                                    ss
                                                                        n)


                                                                                            ica


                                                                                                                Ru
                                                                        pa


                                                                                            er


                                                                                                                &
                                                                    Ja


                                                                                        Am


                                                                                                                                  pe
                                                                                                           pe
                                                                  ing


                                                                                                                                                                                           ica
                                                                                                                                ro


                                                                                                                                                             a
                                                                                                           ro
                                                                                       h


                                                                                                                                                            ric
                                                                                                                               Eu
                                                              lud


                                                                                       ut


                                                                                                                                                                                          er
                                                                                                       Eu


                                                                                                                                                        Af
                                                                                   So


                                                                                                                                                                                        Am
                                                             xc


                                                                                                                           rn
                                                                                                       n


                                                                                                                                                       &
                                                                                                   er


                                                                                                                          te
                                                          (e


                                                                                  l&


                                                                                                                                                                                    rth
                                                                                                                                                       st
                                                                                                  st


                                                                                                                          es
                                                         ia


                                                                              ra


                                                                                                                                                   Ea
                                                                                                  Ea


                                                                                                                                                                                   No
                                                                                                                         W
                                                        As


                                                                             nt


                                                                                                                                                                   n
                                                                                                                                                  le
                                                                             Ce


                                                                                                                                                                  pa
                                                                                                                                              idd


                                                                                                                                                                  Ja
                                                                                                                                              M


                                                              6.00%                                    23.50%                  24.00%                                                   31.50%
                                                                                  17.50%
                                                              15.50%                                                                                                   27.00%
                                                                                                                                                  19.00%


                                                                                  42.00%
                                                              76.00%                                   28.00%                  50.00%
                                                                                                                                                   52.50%

                                                                                                                                                                       47.00%           44.50%


                                                                                                       47.00%


                                                                                  36.00%


                                                                                                                               24.50%
                                                                                                                                                                                          21.50%
                                                                                                                                                    20.00%
                                                                                                                                                                       19.00%


                                                                  Increase                         Stable                               Decline

© 2010 KPMG International. KPMG International is a Swiss cooperative. Member firms of the KPMG network of independent firms are affiliated with KPMG International.
KPMG International provides no client services. No member firm has any authority to obligate or bind KPMG International or any other member firm vis-à-vis third parties,
nor does KPMG International have any such authority to obligate or bind any member firm. All rights reserved.
The growth prospect            7


What are your forecasts for auto industry revenues in the following regions and countries?*

• Companies in the Americas most optimistic on emerging economy growth                                                                                             * Percentage of companies
                                                                                                                                                                     expecting improvements
• Japan rated lowest growth market by EMEA companies
• Broad regional consensus on high Eastern European and Asian growth


                                                                                                             86.67%


                                                                                                                               74.20%

                                                                                                                      69.23%


                                                                                           48.71%
                                                                                  46.67%
                                                                                                    45.16%
                                                                                                                                        41.66%
                                                                                                                                                 38.46%


 30.00%
                                              29.03%
                            26.67%                                       27.42%                                                                           27.42%
                                                                                                                                                                               23.08%
                   19.36%            19.23%
                                                       18.34%                                                                                                         18.34%            17.74%
          16.66%
                                                                14.11%


North America               Western Europe             Japan                      Eastern Europe &           Asia (excluding            Central & South              Middle East &
                                                                                  Russia                     Japan)                     America                      Africa

    Americas                Europe, Middle East and Africa (EMEA)                             Asia Pacific (ASPAC)

© 2010 KPMG International. KPMG International is a Swiss cooperative. Member firms of the KPMG network of independent firms are affiliated with KPMG International.
                                                                                                                       ASPAC
                                                                            EMEA
KPMG International provides no client services. No member firm has any authority to obligate or bind KPMG International or any other member firm vis-à-vis third parties,
nor does KPMG International have any such authority to obligate or bind any member firm. All rights reserved.
8   KPMG Global Auto Executive Survey 2010


Executive view: volume automaker – Europe


This Europe-headquartered global                         “My confidence level has increased                          As for the global picture, I think the next
automaker with significant                                significantly in the last 12 months. A year                five years are going to see the industry
manufacturing and sales in all                            ago we were in the middle of nowhere –                     challenged to compete both on technology
                                                          not just in the auto industry; it applied to all           and on cost. In technology we have a huge
regions of the world says that more
                                                          businesses. Nobody knew what the next                      challenge ahead of us, especially in CO2
than ever the key to success is                           24 months would bring. Anything was                        reduction where expectations are enormous.
product excellence.                                       possible. But now we have some clarity.                    And on the cost front there is no reason to
                                                                                                                     expect our mature-economy consumers
                                                          Consumer demand has recovered better                       to become very much wealthier over the
                                                          than we expected a year ago. It is still                   next few years, so there is also going to be
                                                          going to take a long time to recover fully,                a strong focus on affordability.
                                                          but the important thing is that recovery
                                                          is predictable.                                            The last year has shown us that the
                                                                                                                     winners in tough situations are always
                                                          I share the general faith in demand from                   the companies with strong products at
                                                          the emerging markets. From the consumer                    affordable cost. If you have weak products
                                                          point of view these markets are simply                     you are going to suffer even with a good
                                                          better placed than the US or Europe or                     cost situation. That is irrespective
                                                          Japan. In the past these economies were                    of segment or market”
                                                          highly dependent on foreign direct
                                                          investment for their growth, but now they
                                                          are generating their own trade surpluses,
                                                          they have growth that is not investment-
                                                          dependent, and some of them are still
                                                          benefiting from very low interest rates.

                                                          So the emerging market economies will
                                                          be fairly positive over the next one to two
                                                          years. The question is, what does this
                                                          mean for autos? We’ve seen a huge
                                                          increase in demand over 2009, but for the
                                                          near future I am more doubtful about auto
                                                          demand. I don’t expect a collapse, but
                                                          incentives like we have seen in China and
                                                          Brazil cannot continue forever.


© 2010 KPMG International. KPMG International is a Swiss cooperative. Member firms of the KPMG network of independent firms are affiliated with KPMG International.
KPMG International provides no client services. No member firm has any authority to obligate or bind KPMG International or any other member firm vis-à-vis third parties,
nor does KPMG International have any such authority to obligate or bind any member firm. All rights reserved.
The growth prospect         9


Overcapacity is now critical


For several years KPMG’s Global                           The result is one of the most striking in                  Those companies that do see overcapacity,
Executive Auto Survey has asked                           the survey. After a year of unprecedented                  are more likely to rate the level of
companies about their perceptions of                      change in the structure of the auto                        overcapacity higher in North America than
overcapacity: the extent to which the                     industry, one in which automakers –                        elsewhere, with a consensus of around
manufacturing capacity of the industry is                 including the large US manufacturers                       25 percent overcapacity, although a
overbuilt is a key determinant of profitability           – and suppliers closed capacity around                     significant minority see higher levels –
now and the likely path of restructuring                  the world, the industry still believes                     one in ten companies thinks overcapacity
through mergers, acquisitions and                         that overcapacity in the established                       in North America is more than 40 percent,
divestments in the coming five years.                     manufacturing “triad” – North America,                     for example.
In the current survey these questions                     Europe and Japan – remains very high.
were expanded to provide an insight
into industry perceptions of regional                     Companies see more overcapacity in
overcapacity. (It is worth noting that                    North America than in other regions,
these questions on overcapacity relate                    but in all cases the majority sees
to long-term capacity: companies were                     significant overcapacity.
asked to rate levels of overcapacity over
a whole business cycle, and not just
overcapacity in relation to the current
year’s market).


                                                          Is there automotive overcapacity
                                                          in North America today?                                    How much?

                                                          • North America seen as most overbuilt
                                                          • Perceptions of 20 percent plus
                                                            overcapacity have risen strongly
                                                            year-on-year


                                                                                       9.00%            3.00%
                                                                                                                                  37.50%
                                                                                                                                             35.80%
                                                                                                    88.00%


                                                                                                                                                         13.64%
                                                                                                                                                                    10.22%


                                                                                                                       2.84%


                                                Yes                                                                  1-10%       11-20%     21-30%     31-40%     More
                                                                                                                                                                  than 40%
                                                No
                                                DK/Refuse
                                                               Yes                          No
                                                               Don’t know
© 2010 KPMG International. KPMG International is a Swiss cooperative. Member firms of the KPMG network of independent firms are affiliated with KPMG International.
KPMG International provides no client services. No member firm has any authority to obligate or bind KPMG International or any other member firm vis-à-vis third parties,
nor does KPMG International have any such authority to obligate or bind any member firm. All rights reserved.
10 KPMG Global Auto Executive Survey 2010


                                                          Is there automotive overcapacity
                                                          in Western Europe today?                                   How much?


                                                                               13.00%
                                                                                              6.50%
                                                                                                                                  37.27%

                                                                                                      80.50%
                                                                                                                                              30.43%


                                                                                                                      18.01%


                                                                                                                                                          9.32%

                                                                                                                                                                     4.97%


                                                    Yes
                                                    No                                                               1-10%       11-20%     21-30%     31-40%     More
                                                    DK/Refuse                                                                                                     than 40%

                                                               Yes                          No
                                                               Don’t know


                                                          Is there automotive overcapacity
                                                          in Japan today?                                            How much? overcapacity
                                                                                                                       Extent of


                                                                                            8.50%
                                                                      16.50%
                                                                                                                                  35.33%
                                                                                                      75.00%
                                                                                                                                             32.00%


                                                                                                                      17.33%


                                                                                                                                                         8.67%
                                                                                                                                                                     6.67%


                                                    Yes
                                                    No                                                               1-10%       11-20%     21-30%     31-40%     More
                                                    DK/Refuse                                                                                                     than 40%

                                                               Yes                          No
                                                               Don’t know

© 2010 KPMG International. KPMG International is a Swiss cooperative. Member firms of the KPMG network of independent firms are affiliated with KPMG International.
KPMG International provides no client services. No member firm has any authority to obligate or bind KPMG International or any other member firm vis-à-vis third parties,
nor does KPMG International have any such authority to obligate or bind any member firm. All rights reserved.
The growth prospect 11


    Emerging markets are becoming overbuilt


    Given the high level of expectation of                    near-term capacities is highest in Russia,
    revenue growth in the BRICs and the                       where almost 12 percent of companies
    high level of expressed intentions to build               think that overcapacity is already emerging
    investment in those economies, the fact                   and 19 percent believe it will emerge
    that companies also have strong concerns                  within two years.
    over the emergence of automotive
    overcapacity in the BRICs is striking.                    However, it is worth noting that it is not
                                                              irrational for companies to plan investment
    Companies believe that the automotive                     in locations where they believe overcapacity
    industries in both Russia and Brazil will be              is emerging: more efficient manufacturers
    overbuilt in the near to medium term,                     can always utilize fully their own investments
    and that China will also have significant                 and make profits in an overbuilt economy.
    overcapacity not much later. Concern over

                                                              When do you expect overcapacity in the BRICs
                                                              to become a serious issue?

                                                              • Overcapacity not confined to ‘triad’
                                                              • Russia seen as most overbuilt in the short run
                                                              • Brazil seen as most overbuilt in five year forecast


                                                                                                                                                          ia
                                                                                                                           il
                                                              ina


                                                                                                                                                         ss
                                                                                            dia


                                                                                                                          az


                                                                                                                                                       Ru
                                                             Ch


                                                                                                                         Br
                                                                                           In


s                                                                          23.24%                           24.04%                     13.64%                         22.62%


s
                                                                                                                                       30.68%


                                                                           30.99%                                                                                     28.57%
                                                                                                            43.27%


                                                                                                                                       43.18%

                                                                                                                                                                      29.76%
                                                                           33.10%


                                                                                                            27.88%


                                                                                                                                                                      7.14%

                                                                            5.63%                                                      6.82%
                                                                                                                                                                      11.9%
                                                                            7.04%                 2.88%                                 5.68%
                                                                                                  1.92%


                                                                    Now                                   1-2 years                             3-5 years
                                                                    6-10 years                            >10 years

    © 2010 KPMG International. KPMG International is a Swiss cooperative. Member firms of the KPMG network of independent firms are affiliated with KPMG International.
    KPMG International provides no client services. No member firm has any authority to obligate or bind KPMG International or any other member firm vis-à-vis third parties,
    nor does KPMG International have any such authority to obligate or bind any member firm. All rights reserved.
12 KPMG Global Auto Executive Survey 2010


Chapter 5: The performance angle


Who will best be able to make profits                     companies believe that higher profits will
against this background of falling revenue                accrue to companies better able to leverage
expectations? Industry expectations of                    the whole of the supply chain, with higher
profitability by company type over the next               profits expected of automakers, and the
five years are strikingly negative – especially           lowest expectation for Tier 3 suppliers.
when companies are asked about the                        On a regional basis, profitability corresponds
profitability of their own type of company.               roughly to revenue expectations, with the
Overall, it is unsurprising that in an era                best outlook in ASPAC.
expected to be highly competitive


                                                          How profitable do you think the global automaking, supplier
                                                          and dealer industries will be over the next five years?

                                                          • Financial services seen as most profitable
                                                          • Tier 3 suppliers expected to show lower profitability
                                                          • Profitability expected to decrease along value chain


                                                                                                                                                                   40.50%
                                                             33.00%              40.50%               44.50%
                                                                                                                                               22.00%


                                                                                                                          31.50%


                                                                                                                                              34.50%

                                                             39.50%
                                                                                                                                                                   42.50%
                                                                                 36.50%
                                                                                                      36.00%              38.50%


                                                                                                                                               40.00%


                                                             27.50%
                                                                                  22.50%
                                                                                                      18.50%                                                        19.50%
                                                                                                                           14.50%


                                                          Automakers           Tier 1              Tier 2               Tier 3              Financial           Dealers
                                                                               suppliers           suppliers            suppliers           services

                                                               Increase                     Stable                       Decline

© 2010 KPMG International. KPMG International is a Swiss cooperative. Member firms of the KPMG network of independent firmsStable
                                                                                                       Increase                                  Decline
                                                                                                                                  are affiliated with KPMG International.
KPMG International provides no client services. No member firm has any authority to obligate or bind KPMG International or any other member firm vis-à-vis third parties,
nor does KPMG International have any such authority to obligate or bind any member firm. All rights reserved.
The performance angle 13


How profitable do you think the global automaking, supplier
and dealer industries will be over the next five years?*

• EMEA profitability expectations lowest                                                                                                              * Percentage of companies
                                                                                                                                                        expecting improvements
• Across the whole value chain ASPAC expectations highest


                                                                                                                                          51.61%
                                                                                                                        46.67%


                                                                                                                                                                        32.26%
  30.00%


                       30.64%
 30.00%


                                                     27.42%


                                                                                                                                 25.64%
                                                                                 25.81%
              23.07%


                                   23.34%


                                                                                                              22.58%
                                                               21.67%


                                                                                                                                                       20.00%
                                            17.95%


                                                                                             13.33%
                                                                        10.26%


                                                                                                      8.97%


                                                                                                                                                                8.97%


Automakers                        Tier 1 suppliers            Tier 2 suppliers             Tier 3 suppliers            Financial services             Dealers

           Americas             Europe, Middle East and Africa (EMEA)                     Asia Pacific (ASPAC)

© 2010 KPMG International. KPMG International is a Swiss cooperative. Member firms of the KPMG network of independent firms are affiliated with KPMG International.
                                      Americas      EMEA
KPMG International provides no client services. No member firmASPAC authority to obligate or bind KPMG International or any other member firm vis-à-vis third parties,
                                                                 has any
nor*does KPMG International have any such authority to obligate or bind any member firm. All rights reserved.
     Percentage of companies expecting improvement
14 KPMG Global Auto Executive Survey 2010


Executive view: mid-size automaker – US


This subsidiary of a Japanese-     “Over the last year my confidence level                                           When the cash assistance scheme ended,
owned global manufacturer remains has not improved much. Unfavorable                                                 sales plummeted. There just isn’t the natural
extremely cautious about long-term  fundamentals in the market have been with                                        demand in the market. So it is going to be
                                    us for some time now, but if anything it is                                      a very difficult 12 months, at least. But we
sales and profit prospects.
                                                          getting harder for people to sustain their                 are going to have to grow our way out of it.
                                                          spending. No, I’m not much more confident.                 Government can’t go on making sales for us.

                                                          We have cut capacity. Perhaps not as much                  Growth is the challenge, and that means
                                                          as we should have done. If it weren’t for                  investment is the challenge. When you look
                                                          our contract with the United Auto Workers                  at the return on a dollar of investment in China
                                                          we would have done a lot more. We have                     or in India, and you look at the return in the
                                                          changed the product mix as well – the old big              US, the US does not look attractive. So the
                                                          SUV products, for example, are just not                    future is going to be all about operating more
                                                          viable any more. Our competitive offers now                efficiently. We just cannot afford to waste
                                                          are in compact and crossover vehicles.                     money on anything inefficient.
                                                          When we started developing small SUVs
                                                          people thought we were crazy – but now we                  The winners from what has happened in
                                                          are developing crossovers that are even                    2009 will be primarily the Korean companies.
                                                          smaller, and people understand what we are                 They have the lowest cost of production in
                                                          doing. These are the cars people want.                     the US. That means they can profit in this
                                                                                                                     very weak market. But Japanese companies
                                                          The government assistance scheme in the                    also have low costs – lower than the
                                                          US certainly had an impact, although of                    domestic US makers, even after all the
                                                          course it was not as great as we might have                restructuring. The Japanese also have the
                                                          hoped. Whether a company benefits from a                   culture, the camaraderie and the dedication
                                                          cash assistance program like that depends a                on the factory floor. If the domestic US
                                                          lot on the level of inventory it holds. We gave            automakers cannot reproduce that, they
                                                          up on the strategy of holding high inventory               will never prosper.”
                                                          and waiting for a miracle a long time ago –
                                                          but when “cash-for-clunkers” came in, we
                                                          just didn’t have the inventory. The Koreans
                                                          on the other hand do hold very high
                                                          inventories, so they had a home run.


© 2010 KPMG International. KPMG International is a Swiss cooperative. Member firms of the KPMG network of independent firms are affiliated with KPMG International.
KPMG International provides no client services. No member firm has any authority to obligate or bind KPMG International or any other member firm vis-à-vis third parties,
nor does KPMG International have any such authority to obligate or bind any member firm. All rights reserved.
The performance angle
                                                                                                                                                                         4/Beyond crisis: challenges and opportunities                15


No easy cost savings expected


Falling expectations of both revenues and                                                    white-collar salaries is higher – this year’s
profitability over the next five years imply                                                 survey is the first in which companies
a continued intense concern with cost-saving                                                 have been asked to distinguish between
opportunities. Yet in the current survey the                                                 wage and salary savings opportunities).
overall picture is that company expectations
of finding cost-saving opportunities have                                                    On a regional basis (results not shown
fallen somewhat: in particular, there is less                                                in chart) ASPAC companies are more
expectation of finding savings through                                                       likely to view new design technologies as a
overhead cost-reduction and supply chain                                                     cost-saving opportunity. Companies in the
innovation, and more interest in                                                             Americas are clearly more concerned than
implementing advanced IT in design.                                                          other regions about salary costs and see
There is a low expectation of finding                                                        this as a cost opportunity, while European
savings through cutting wage costs                                                           companies continue to focus more on
(the opportunity for making savings in                                                       low-cost country sourcing.

What are the cost-saving opportunities for auto manufacturers and suppliers?*

• Cost focus shifts away from restructuring                                                                                                                                                * Percentage of companies seeing
                                                                                                                                                                                            cost-saving opportunities by year
• Increasing number of companies believe supply chains are fully optimized
• Computer modelling rated sharply higher
         67.00%


                                             65.00%
62.00%


                           61.00%


                                    59.00%


                                                                                                                     58.00%
                  57.00%


                                                      55.00%


                                                                                          50.00%


                                                                                                            48.00%
                                                                                 47.00%


                                                                                                                                                                                                         46.00%
                                                                                                   46.00%


                                                                                                                                                                                                                                    46.00%
                                                                        43.00%
                                                               43.00%


                                                                                                                                  38.00%


                                                                                                                                                                30.50%


                                                                                                                                                                                                29.00%


                                                                                                                                                                                                                           28.00%
                                                                                                                                                                                       27.00%
                                                                                                                                                 23.50%


                                                                                                                                                                                                                  21.50%


                                                                                                                              x            x x            x x              x x
* Percentage of companies seeing cost saving opportunities
Product          Low-cost       Computer        Overhead                                                    Supply                Marketing      Tax            Salary                 Wage                       Health care
materials        country        modeling        cost                                                        chain                 and sales      efficiency     costs                  costs/direct
innovation       sourcing                       reduction                                                   management                                                                 labor

         2009                                         2008                                           2007                         X No data for 2008                         X No data for 2007
                                                         2009         2008     2007      x No data for 2008 and 2007
© 2010 KPMG International. KPMG International is a Swiss cooperative. Member firms of the KPMG network of independent firms are affiliated with KPMG International.
KPMG International provides no client services. No member firm has any authority to obligate or bind KPMG International or any other member firm vis-à-vis third parties,
nor does KPMG International have any such authority to obligate or bind any member firm. All rights reserved.
16 KPMG Global Auto Executive Survey 2010


What are the cost-saving opportunities for auto manufacturers and suppliers?*
                                                                                                                                                                                                                          * Percentage of companies seeing
• OEMs see higher cost saving opportunities                                                                                                                                                                                       cost-saving opportunities
• Materials innovation, computer modeling and low-cost sourcing top opportunities for OEMs
• Tier 2 suppliers most likely to cut labor costs
• Wage and benefits cost opportunities rated low by most companies
                                                                                                             68.83%


                                                                                                                                                                   66.24%
                                                                                                                               65.21%


                                                                                                                                                                                                                         62.34%
                                                                                                                                                                            60.00%


                                                                                                                                                                                     56.52%
                                                                                                                      54.00%
51.95%


                                                                                                                                                                                                                52.17%


                                                                                                                                                                                                                                  51.00%

                                                                                                                                                                                                                                           47.83%
                                                                                                                                                                                              48.05%
         47.00%


                                                                                                                                                                                                       45.00%
                                                                                                    43.48%


                                                                                                                                                          43.48%
                                                                                                                                        42.86%
                  39.13%


                                                                        34.78%


                                                                                                                                                 33.00%
                                                      31.17%


                                                               29.00%
                                    26.00%


                                                                                          25.00%
                                                                                 24.67%


                                                                                                                                                                                                                                                             23.00%
                           22.08%


                                                                                                                                                                                                                                                    18.19%
                                             17.39%


                                                                                                                                                                                                                                                                      7.09%


Supply                     Tax                         Salary costs              Wage costs/                 Low cost                    Marketing                 Product                    Overhead                   Computer                   Healthcare
chain                      efficiency                                            direct labor                country                     and sales                 materials                  cost                       modeling
management                                                                                                   sourcing                                              innovations                reductions

                                                                                 No data for 2008, 2007
         OEMs                                         Tier 1 suppliers                               Tier 2 suppliers
                                                                       Tier 1 suppliers            OEMs
                                                                                                 Tier 2 suppliers
© 2010 KPMG International. KPMG International is a Swiss cooperative. Member firms of the KPMG network of independent firms are affiliated with KPMG International.
KPMG International provides no client services. No member firm has any authority to obligate or bind KPMG International or any other member firm vis-à-vis third parties,
nor does KPMG International have any such*authority to obligate or bind any membersaving opportunities
                                            Percentage of companies seeing cost firm. All rights reserved.
The performance angle 17


Capital costs to remain high


The sudden contraction in late 2008 in the                The chart shows company expectations
availability of capital for consumers and                 of improvement. They expect the
companies, and the increase in borrowing                  improvement to be less apparent in
costs which remain high despite low policy                corporate financing than in consumer
interest rates, have been key components                  financing, and European companies are
of the auto business crisis of the last year.             most pessimistic about an early return
In the current survey, companies were                     to easy finance.
asked for the first time how they expected
financial conditions for consumers and
companies to evolve.


                                                          How do you expect financial conditions
                                                          to evolve in the next 12 months?*

                                                          • Companies expecting financial improvement outnumber                                     * Percentage of companies
                                                                                                                                                       expecting improvement
                                                            those expecting decline
                                                          • EMEA companies most pessimistic on corporate financing


                                                                                                                                                     51.67%


                                                                                                                                                                       41.94%


                                                                                                                                        37.10%
                                                                                                                                                              34.62%
                                                                                                           33.87%
                                                                                         33.34%
                                                          31.67%                                                               32.06%
                                                                            30.65%


                                                                   25.64%                                             25.00%


                                                                                                  14.10%


                                                          Cost of capital               Availability of capital      Cost of consumer credit        Availability of
                                                                                                                                                    consumer credit

                                                               Americas              Europe, Middle East and Africa (EMEA)                       Asia Pacific (ASPAC)
                                                                                                                Americas                   EMEA              ASPAC
© 2010 KPMG International. KPMG International is a Swiss cooperative. Member firms of the KPMG network of independent firms are affiliated with KPMG International.
KPMG International provides no client services. No member firm has any authority to obligate or bind KPMG International or any other member firm vis-à-vis third parties,
nor does KPMG International have any such authority to obligate or bind any member firm. All rights reserved.
18 KPMG Global Auto Executive Survey 2010


M&A set to grow


Perceptions of a continued high level of                 M&A is also expected in growth markets
overcapacity in the face of a diminished                 as well as in stagnant markets: companies
consumer market imply continuing merger                  believe that the rate of M&A will not only
and acquisition activity. The results in the             be high in the Americas and Europe, but
current survey show that expectations for                also in Eastern Europe and in Asia.
M&A have risen, marginally, from an                      Companies appear to be telling us that
already high level in the preceding year –               M&A may be driven by high growth as
although interestingly the one exception to              well as by overcapacity in the mature
that rising expectation is in the dealer                 economies. Expectations for Japan are
business, where after a year of closure                  lower, but still highly significant given
and rationalization companies now see                    the historically low rate of M&A activity
M&A falling back.                                        in Japan.

                                                         How will M&A in these types of companies develop
                                                         over the next five years?*

                                                         • Expectations of OEM M&A growth stay                                                                         * Percentage of companies
                                                                                                                                                                               expecting increase
                                                           at last year’s high levels
                                                         • Increasing expectation of M&A growth
                                                           for Tier 2 and Tier 3 suppliers
                                                         • Only dealer M&A set to fall back
                                                          73.50%


                                                                                                          72.00%
                                                                    72.00%


                                                                                               71.00%
                                                                                      70.50%


                                                                                                                                     64.00%


                                                                                                                                                                                      60.00%
                                                                                                                   56.00%


                                                                                                                            52.00%


                                                                                                                                                                             52.00%


                                                                                                                                                                                               49.00%
                                                                                                                                                48.50%
                                                                             47.00%


                                                                                                                                                         43.00%


                                                                                                                                                                  x
                                                         Automakers                   Tier 1 suppliers             Tier 2 suppliers            Tier 3 suppliers             Dealers

                                                                   2009                                 2008                            2007                          X No data for 2007

© 2010 KPMG International. KPMG International is a Swiss cooperative. Member firms of the KPMG network of independent firms are affiliated with KPMG International.
                                                                       2007    2008                                 x No data for member firm vis-à-vis third parties,
KPMG International provides no client services. No member firm has any authority to obligate or bind KPMG International or any other 2007
                                                                                                           2009
nor does KPMG International have any such authority to obligate or bind any member firm. All rights reserved.
The performance angle 19


                                                                                                Increase                          Remain the same                      Decrease


                                                          How will M&A in these regions develop over the next five years?

                                                          • High expectations of Eastern European and Asian M&A
                                                          • Less than one in ten companies expect M&A to decline anywhere

                                                                                                                             ia
                                                                                                                             ss


                                                                                                                                                   n)


                                                                                                                                                                       ica
                                                                                                                           Ru


                                                                                                                                                   pa


                                                                                                                                                                       er
                                                                                                                                               Ja
                                                                                  pe


                                                                                                                         &


                                                                                                                                                                   Am
                                                                                                                    pe


                                                                                                                                                                                              a
                                                                                                                                             ing
                                                                ica


                                                                                  ro


                                                                                                                                                                                           ric
                                                                                                                                                                  h
                                                                               Eu


                                                                                                                    ro
                                                               er


                                                                                                                                         lud


                                                                                                                                                                  ut


                                                                                                                                                                                        Af
                                                                                                                  Eu
                                                             Am


                                                                                                                                                              So
                                                                             rn


                                                                                                                                        xc


                                                                                                                                                                                       &
                                                                             te


                                                                                                                n


                                                                                                                                     (e


                                                                                                                                                             l&


                                                                                                                                                                                      st
                                                                                                              er
                                                         rth


                                                                          es


                                                                                             n


                                                                                                                                                                                  Ea
                                                                                                                                    ia
                                                                                                             st


                                                                                                                                                         ra
                                                                                           pa
                                                                         W
                                                        No


                                                                                                                                   As
                                                                                                           Ea


                                                                                                                                                        nt


                                                                                                                                                                                 le
                                                                                          Ja


                                                                                                                                                        Ce


                                                                                                                                                                             idd
                                                                                                                                                                             M
                                                               8.50%           7.00%
                                                                                                                  5.00%                   5.50%
                                                                                                 6.50%                                                       8.00%
                                                                              28.00%                            30.50%                   28.00%                                       7.00%
                                                             30.50%                            55.00%
                                                                                                                                                             57.00%
                                                                                                                                                                                   60.00%


                                                                               64.00%                                                    64.50%
                                                                                                                  62.00%
                                                             59.00%


                                                                                                35.00%
                                                                                                                                                             30.00%
                                                                                                                                                                                      25.50%


                                                                  Increase                  Stay the same                       Decline

© 2010 KPMG International. KPMG International is a Swiss cooperative. Member firms of the KPMG network of independent firms are affiliated with KPMG International.
KPMG International provides no client services. No member firm has any authority to obligate or bind KPMG International or any other member firm vis-à-vis third parties,
nor does KPMG International have any such authority to obligate or bind any member firm. All rights reserved.
20 KPMG Global Auto Executive Survey 2010


Debt and technology needs will drive M&A


Companies believe that a rising rate of                   technologies rise in companies’ ratings
M&A will be driven partly by crisis factors,              of the drivers of M&A, while access to
and partly by the long-term imperative of                 raw materials is seen as less important
finding and developing new technology                     against a background of falling raw material
solutions for a changing market (the                      prices during 2009. Pension and labor
continued high stress that companies                      costs fall further from an already low
place upon new technology development                     position in companies’ ratings of
is explored further in chapter 6 of                       M&A drivers.
this survey). So both debt and new


What will drive M&A over the next five years?

• Indebtedness now seen as top driver of M&A
• All cost pressures now seen as less significant


                                                                   95.00%

89.00%

                            84.00%                                                                                                                                     85.00%
                                                  82.00% 83.00%                                                                                               83.00%
                                     80.00%

                                                                                     74.00%                                                                                     75.00%
         73.00%

                                                                                              67.00%
                                                                                                                          65.00%


                  55.00%                                                    54.50%                                                                   55.00%
                                                                                                                 53.00%

                                                                                                        47.00%


                                                                                                                                            33.00%
                                                                                                                                   30.00%


                                              x
Debt and risk of            Access to new         Access to new             Raw materials and           Labor cost                 Pension and                Potential for
bankruptcy                  technologies and      markets and               cost pressures              pressures                  health cost                product synergies
                            products              customers                                                                        pressures
    x    No data for 2007
     2009                             2008                        2007                    X No data for 2007
                                      2009                    2008                               2007
© 2010 KPMG International. KPMG International is a Swiss cooperative. Member firms of the KPMG network of independent firms are affiliated with KPMG International.
KPMG International provides no client services. No member firm has any authority to obligate or bind KPMG International or any other member firm vis-à-vis third parties,
nor does KPMG International have any such authority to obligate or bind any member firm. All rights reserved.
The performance angle 21


                                                                                                                                                    51.67%


                                                          What will drive M&A over the next five years from
                                                          a regional perspective?*
                                                                                                                                                     * The four largest regional
                                                          • Americas and EMEA level of global consensus                                                      disparities shown
                                                            on M&A drivers is high
                                                          • Americas companies more concerned with market access
                                                          • ASPAC more concerned with raw materials cost pressure


                                                                                        95.00%

                                                          90.00%   88.46%
                                                                                                                                                             87.18%
                                                                                                 83.33%                                             83.33%


                                                                                                                                                                       77.42%

                                                                            72.58%
                                                                                                          67.74%
                                                                                                                                        66.13%


                                                                                                                      51.67%
                                                                                                                               47.44%


                                                          Access to new                 Access to new                 Raw materials                  Product synergies
                                                          technologies                  markets                       cost pressure

                                                               Americas              Europe, Middle East and Africa (EMEA)                       Asia Pacific (ASPAC)
                                                                                                   EMEA
© 2010 KPMG International. KPMG International is a Swiss cooperative. Member firms of the KPMG network of independent firms are affiliated with KPMG International.
KPMG International provides no client services. No member firm has any authority to obligate or bind KPMG International or any other member firm vis-à-vis third parties,
nor does KPMG International have any such authority to obligate or bind any member firm. All rights reserved.
22 KPMG Global Auto Executive Survey 2010


Chapter 6: Product innovation and consumer change


When asked about their long-range                                                  Cost reduction has moved slightly lower,                                But there are differences – ASPAC
priorities, automotive companies have                                              and, interestingly, in a reversal of trend                              companies are markedly more concerned
consistently told KPMG’s Global Auto                                               environmental issues are now accorded                                   than others with managing labor, and
Executive Survey that their highest-ranking                                        slightly less weight than in last year’s                                markedly more concerned with product
concerns are with new technology and new                                           survey, suggesting that companies believe                               quality (the proportion of ASPAC
products. That remained the case in the                                            they have already made significant                                      companies rating it “very important”
current survey: both new products and new                                          environmental advances. Managing labor                                  as against “moderately important” is
technologies have moved higher in the                                              relations remains a low priority.                                       high). ASPAC companies are also more
ranking of concerns from an already high                                                                                                                   concerned with pricing, while companies
leading position in last year’s survey.                                            Regional results show very similar                                      in the Americas and in Europe prefer to
                                                                                   patterns, suggesting as in earlier surveys                              prioritize total affordability.
                                                                                   that the broad shape of priorities remains
                                                                                   the same in all regions of the world: auto
                                                                                   companies tend to take a global view.
How important today are the following issues to the global auto industry?*
                                                                                                                                                                                               * Percentage of companies rating
• Companies are shifting focus from quality improvement to new products                                                                                                                                     issues as important
• Total affordability and pricing seen as less important than innovation
• Environment falls in rating for first time in three years                                                                                                         96.00%
                                                                                                    89.00%


                                                                                                                                                           90.00%
                                                                                86.00%
84.50%


                            85.00%


                                                                       85.00%
                                              83.00%
                                     82.00%
          81.00%


                                                              80.50%
                   79.00%


                                                                                           74.50%


                                                                                                                                72.00%


                                                                                                                                                                                      72.00%
                                                                                                                                         65.00%
                                                                                                                       64.00%


                                                                                                                                                                             64.00%
                                                                                                             63.00%


                                                                                                                                                  62.00%


                                                                                                                                                                                                                              59.00%
                                                                                                                                                                                                            49.50%


                                                                                                                                                                                                                     49.50%


                                                                                                                                                                                                    x
* Percentage of companies seeing cost saving opportunities
Developing          Developing new        Reducing                                         Meeting                     Pricing and                Improving                  Improving total                Managing labor
new products        technologies          costs                                            environmental               sales incentives           product quality            affordability                  relations
                                                                                           demands

         2009                                 2008                                       2007                         X No data for 2007
                                                  2008 2009  2007      x No data for 2007
© 2010 KPMG International. KPMG International is a Swiss cooperative. Member firms of the KPMG network of independent firms are affiliated with KPMG International.
KPMG International provides no client services. No member firm has any authority to obligate or bind KPMG International or any other member firm vis-à-vis third parties,
nor does KPMG International have any such authority to obligate or bind any member firm. All rights reserved.
Product innovation and consumer change 23


                                                          How important today are the following
                                                          issues to the global auto industry?*
                                                                                                                                                      * The four largest regional
                                                          • Asian companies least concerned with total affordability,                                         disparities shown
                                                            most concerned with quality
                                                          • EMEA companies give low rating to quality improvement
                                                          • Affordability a leading issue for companies in the Americas


                                                                                                                                                                             C
                                                                                             s


                                                                                                                                                                          PA
                                                                                          ica


                                                                                                                                                                         AS
                                                                                         er
                                                                                        Am


                                                                                                                                               C
                                                                                                                                            PA


                                                                                                                                                          s
                                                                                                                                                      ica
                                                                                                                                           AS
                                                                                                                                 EA


                                                                                                                                                      er
                                                                                                   EA


                                                                                                                                                                          32.26%
                                                                                                                                EM


                                                                                                                                                     Am
                                                                                                  EM


                                                                                         45.00%
                                                                                                                           as
                                                                                                                          ic


                                                                                                                                            38.71%
                                                                                  C


                                                                                                                       er
                                                                               PA


                                                                                                                C


                                                                                                                      Am
                                                                                                             PA
                                                                              AS


                                                                                                                                  33.33%              36.67%
                                                                                                   39.74%
                                                                                                            AS


                                                                                                                                                                EA
                                                              s


                                                                                                                                                               EM
                                                            ica


                                                                               30.65%                                  26.67%
                                                           er


                                                                                                             43.55%
                                                         Am


                                                                     EA


                                                                                                                                                                30.77%
                                                                    EM


                                                           28.33%                                                                                                         43.55%


                                                                     26.92%

                                                                                                                                 32.05%
                                                                                                                       30.00%               30.65%
                                                                                         28.33%                                                       28.33%
                                                                               25.81%
                                                                                                   24.36%


                                                                                                                                                                17.95%
                                                           15.00%
                                                                                                             11.29%
                                                                     10.26%


                                                          Managing labor                Improving total               Pricing and sales              Improving product
                                                          relations                     affordability                 incentives                     quality

                                                                Extremely                     Somewhat
                                                                      Extremely                    Somewhat
© 2010 KPMG International. KPMG International is a Swiss cooperative. Member firms of the KPMG network of independent firms are affiliated with KPMG International.
KPMG International provides no client services. No member firm has any authority to obligate or bind KPMG International or any other member firm vis-à-vis third parties,
nor does KPMG International have any such authority to obligate or bind any member firm. All rights reserved.
24 KPMG Global Auto Executive Survey 2010


Fuel efficiency and environment top of consumer concerns


In qualitative interviews which accompanied               In the current survey fuel efficiency and the              inclined to rate consumer preferences as
the preparation of the current survey,                    environmental profile of products continue                 “very important” than are companies in
companies repeatedly stated that they                     to be considered by companies the most                     other regions. The relatively low priority
believe that adaptation to changing                       significant consumer buying issues. But                    ascribed to telematics is consistent with
consumer demand will be an important                      on a regional basis it is clear that consumer              results last year – globally, telematics
key to survival in the coming five years.                 concerns are believed to differ: the high                  received the highest number of “not
The survey questions on drivers of                        rating accorded to safety is due to ASPAC                  important” scores. Overall, the efficiency
consumer buying give an insight into                      companies citing this issue – and on                       of vehicles is believed to dominate
just how companies will do that.                          all issues ASPAC companies are more                        consumer concerns.


                                                          How important are these product issues to consumer
                                                          purchase decisions over the next five years?*
                                                                                                                                     * Percentage of companies rating issues as
                                                          • Fuel efficiency top concern over last three years                            important (the top three issues shown)
                                                          • Companies think consumer concerns on
                                                            environment continue to rise


                                                                       96.00%
                                                           93.50%


                                                                                  84.00%
                                                                                                    80.50%


                                                                                                               70.00%                        71.00%       72.00%

                                                                                                                           65.00%


                                                                                                                                                                      50.00%


                                                          Fuel efficiency                          Environmental                            Safety innovation
                                                                                                   friendliness

                                                                  2007
                                                               2009                           2008
                                                                                            2008                            2009
                                                                                                                         2007

© 2010 KPMG International. KPMG International is a Swiss cooperative. Member firms of of companies ratingof independent firms are affiliated with KPMG International.
                                                                            *Percentage the KPMG network issue as important
KPMG International provides no client services. No member firm has any authority to obligate or bind KPMG International or any other member firm vis-à-vis third parties,
nor does KPMG International have any such authority to obligate or bind any member firm. All rights reserved.
Product innovation and consumer change 25


How important are these product issues to consumer purchase decisions over the next five years?*
                                                                                                                                                                 * Percentage of companies rating
• Asian companies now rate styling, comfort and safety significantly higher than others                                                                                       issues as important
• Asian companies also most likely to rate environment as top consumer concern
• Fuel efficiency for all regions most important
                                                                                       95.00%


                                                                                                         93.55%
                                                                                                92.31%
                                                 83.87%
                                        80.77%
                     79.03%


                               76.67%


                                                                             74.19%
 70.00%


                                                                                                                                                                                             67.75%
            65.39%


                                                                                                                                                                                    58.98%
                                                                                                                                                                 56.45%


                                                                                                                                                                           56.67%
                                                           50.00%


                                                                                                                                     50.00%
                                                                                                                   45.00%
                                                                    44.87%


                                                                                                                                               40.00%
                                                                                                                            35.90%


                                                                                                                                                        33.33%


Safety innovation             Environmental               Ergonomics                  Fuel efficiency             Enhanced vehicle            Telematics/                 Vehicle styling
                              friendliness                and comfort                                             lifespan                    personal assistance
                                                                                                                                              services

          Americas            Europe, Middle East and Africa (EMEA)                                 Asia Pacific (ASPAC)
                              Americas       EMEA        ASPAC
© 2010 KPMG International. KPMG International is a Swiss cooperative.important firms of the KPMG network of independent firms are affiliated with KPMG International.
                          * Percentage of companies rating issue as Member
KPMG International provides no client services. No member firm has any authority to obligate or bind KPMG International or any other member firm vis-à-vis third parties,
nor does KPMG International have any such authority to obligate or bind any member firm. All rights reserved.
26 KPMG Global Auto Executive Survey 2010


Low-cost producers to win most market share


Company expectations of market                                            Two significant winners emerge                             Both Mercedes and BMW are also seen
share gain and loss have changed in                                       in year-on-year comparisons:                               as better placed to win market share, both
significant ways. Chinese and Indian                                      Hyundai/Kia is one – a result that may                     companies having defied expectations of
brands remain in the top three places in                                  reflect the success of Korean automakers                   a collapse of premium vehicle sales.
terms of expectation of market share                                      in profiting from government sales
gain, but conviction is slightly lower                                    subsidies during 2009 – and VW is the
than in last year’s survey. Both Toyota                                   second. Market share gain expectations
and Honda are expected to win market                                      for the big three US makers remain low
share at a lower rate than in previous                                    and Chrysler has fallen further, although
years, and there has been a fall in                                       Fiat, now the key actor in Chrysler’s
expectation for Russian brands. Overall                                   immediate future, is rated higher in terms
we note that the top six rated companies                                  of market share prospects than in the
have either very strong cost or product                                   previous year.
advantages, or both.


How will market share by company change in the next five years?

• Low cost makers in top three places
• Toyota and Honda fall in ratings for first time in three years
• VW seen as strongest European OEM, Ford as strongest US OEM
                                                                                                                                                       n


                                                                                                                                                                                               s
                                                                                                                                                   oe
                                                                                              an


                                                                                                                                                                                               or
          ds


                                                                                            ss


                                                                                                                                                                                            ot
                                                                                                                                                  itr
                                                en
                                   ds
      an


                     ia


                                                                                                                                       ds


                                                                                                                                                                                          lM
                                                                                                                                                 t/C
                                                                                              i


                                                                                                                            s
                                                                                           /N
                                                ag


                                                                                                                           de
                    i/K


                                an
      br


                                                                                                                                     an


                                                                                                                                                                                 i
                                                                                                                                              eo


                                                                                                                                                                                                         r
                                                                                       ult


                                                                                                                                                                            ish
                                          sw


                                                                                                                                                                                       ra


                                                                                                                                                                                                     sle
                                                                                                                           ce
                               br
                da


                                                        a
     se


                                                                 a


                                                                                                    W


                                                                                                                                     br


                                                                                                                                                                  uji
                                                       ot


                                                                                                                                                                                      ne
                                                                                                                                            ug
                                                                                      na


                                                                                                             rd
                                                                 nd


                                                                                                                                                                            ub
                                           lk


                                                                                                                       er
               un


                                                                                                                                                                                                    ry
                               n
ine


                                                                            t


                                                                                                   BM
                                                        y


                                                                                                                                                              u/F
                                                                                                                                 ian
                                                                                                             Fo
                                                                           Fia


                                                                                                                                                                                     Ge
                                                                                      Re


                                                                                                                                            Pe
                          dia


                                        Vo


                                                                Ho
                                                     To


                                                                                                                       M


                                                                                                                                                                                                    Ch
                                                                                                                                                                        its
               Hy
Ch


                                                                                                                                ss


                                                                                                                                                             ar
                          In


                                                                                                                                                                        M
                                                                                                                                                              b
                                                                                                                                Ru


                                                                                                                                                           Su


                                            6.50%      11.00%    10.00%      25.00%    15.00%       11.50%    26.00%   15.00%                27.50%                                   68.00%         72.50%
 5.00%          10.50%         9.50%                                                                                                                                    42.50%
                                           22.50%                                                                                35.00%                      31.50%
 13.00%
                13.00%     14.50%                      30.50%    36.50%                             56.50%
                                                                                       49.00%                          57.00%

 78.50%
                73.50%     72.50%                                            32.50%                           44.00%
                                           70.00%                                                                                            53.50%


                                                                                                                                                             45.50%
                                                                                                                                 38.00%
                                                       57.00%
                                                                                                                                                                        37.50%
                                                                 51.50%


                                                                             40.50%

                                                                                       34.50%
                                                                                                    30.50%                                                                            17.50%
                                                                                                              29.00%
                                                                                                                       26.50%                                                                        18.00%
                                                                                                                                 20.50%
                                                                                                                                             17.50%                     16.00%
                                                                                                                                                            16.00%
                                                                                                                                                                                      13.00%

                                                                                                                                                                                                     7.50%


          Increase                              Stay the same                Decrease
© 2010 KPMG International. KPMG International is a Swiss cooperative. Member firms of the KPMG network of independent firms are affiliated with KPMG International.
KPMG International provides no client services. No member firm has any authority to obligate or bind KPMG International or any other member firm vis-à-vis third parties,
nor does KPMG International have any such authority to obligate or bind any member firm. All rights reserved.
                                                Increase    Remain the same              Decrease
Product innovation and consumer change 27


Expectations of the performance of sales
by vehicle type show a remarkable degree
of consensus: companies in all three
global regions cite exactly the same three
vehicle types as top performers (hybrids,
other alternative fuel vehicles and low-cost
introduction cars). Expectations of declining
sales performance are perhaps not
surprisingly focused on larger and more
inefficient vehicles, although it is notable
that companies in the Americas do not cite
luxury vehicles in their “bottom three”.


How will sales by vehicle type change in the next five years?*
                                                                                                                                                                                             * Regional best and worst performers
• Hybrids, alternative fuel and low cost vehicles lead in all regions
• Inefficient vehicles to lose most sales
                                                                                                                    les


                                                                                                                                                                                                   les
                                   les


                                                                                                                hic


                                                                                                                                                                                               hic
                               hic


                                                                                                                                rs


                                                                                                                                                                                                               rs
                                               rs


                                                                                                                            ca


                                                                                                                                                                                                           ca
                                           ca


                                                                                                               ve


                                                                                                                                                                                              ve
                              ve


                                                                                                                          ion


                                                                                                                                                                                                         ion
                                         ion


                                                                                                          el


                                                                                                                                                                                         el
                          el
           les


                                                                                                                                                                          les
                                                                                            les


                                                                                                         fu


                                                                                                                                                                                         fu
                          fu


                                                                                                                       ct


                                                                                                                                                                                                      ct
                                      ct


                                                                                                                     du


                                                                                                                                                                                                     du
          hic


                                                                                                                                                                         hic
                                     du


                                                                                                        ive


                                                                                                                                                                                       ive
                       ive


                                                                                         hic


                                                                                                                                                                                                                                les
                                                                                                                                                         les
                                                                                                                    ro


                                                                                                                                                                                                   ro
                                   ro


                                                    ps


                                                                                                                                                                                                                    ps
      ve


                                                                                                                                                                     ve
                                                                                                                                 ps
                                                                                                    at


                                                                                                                                                                                                                                            ps
                                                                                                                                                                                    at
                     at


                                                                                       ve


                                                                                                                                                                                                                              hic
                                                                                                                                                     hic
                                                                                                                 int


                                                                                                                                                                                               int
                                int


                                                                                                   rn


                                                                                                                                                                                  rn
                  rn


                                                ku


                                                                                                                                                                                                                ku
                                                                                                                                ku


                                                                                                                                                                                                                                         ku
     el


                                                                                                                                                                    el
                                                                                     el


                                                                                                  lte


                                                                                                                                                                                                                           ve
                                                                                                                                                                                lte
                                                                                                                                                    ve
                 lte


                                                                                                               st


                                                                                                                                                                                              st
                                              pic


                                                                                                                                                                                                              pic
     fu


                                                                                                                                                                    fu
                               st


                                                                       ns


                                                                                                                               pic


                                                                                                                                                                                                                                       pic
                                                                                    fu


                                                                                                              -co


                                                                                                                                                                                         -co
                                                                                               ra
                             -co


                                                                                                                                                                               ra
                ra


                                                                                                                                                                                                                         ry
                                                                      va


                                                                                                                                                ry
 id


                                                                                                                                                                id
                                                                                id
                                                         Vs
                                           e


                                                                                                                                                                                                           e
                                                                                                                            e


                                                                                                                                      Vs


                                                                                                                                                                                                                                      all
                                                                                                                                                                                                                         xu
                                                                                            he


                                                                                                                                               xu
br


                                                                                                                                                               br


                                                                                                                                                                           he
            he


                                          rg


                                                                                                          w


                                                                                                                                                                                                          rg
                                                                                                                                                                                         w
                                                                  ini


                                                                               br
                          w


                                                                                                                          rg
                                                      SU


                                                                                                                                                                                                                                  Sm
                                                                                                                                     SU
Hy


                                                                                                                                                               Hy
                                                                                                        Lo


                                                                                                                                                                                                                     Lu
                                                                                                                                                                                        Lo
                                         La


                                                                                                                                                                                                         La
                                                                                                                                               Lu
                         Lo


                                                                               Hy


                                                                                            Ot


                                                                                                                          La


                                                                                                                                                                         Ot
                                                                  M
          Ot


                1.67%                                                               1.28%        1.28%                                                                         1.61%
                              3.33%                                                                                                                             3.23%
 5.00%                                                                                                         5.13%                                                                         3.23%
                                           68.33%        60.00%       45.00%        7.69%      16.67%                       62.82%    60.00%    35.90%
                10.00%                                                                                                                                          4.84%          17.74%        14.52%           32.26%     32.26%        24.19%
 95.00%                      10.00%                                                                           12.82%
                                                                                91.03%
                                                                                                                                                                91.94%
                88.33%
                             85.00%
                                                                                               82.05%         80.77%
                                                                                                                                                                               79.03%        80.65%
                                                                                                                                                                                                                                      27.42%


                                                                                                                                                                                                              45.16%      37.10%
                                                                                                                                                44.87%


                                                                      38.33%
                                                                                                                                      30.77%
                                                                                                                                                                                                                                       48.39%


                                                         23.33%
                                                                                                                            24.36%

                                           23.33%

                                                                                                                                                                                                                         29.03%
                                                                                                                                                                                                           22.58%
                                                                      16.75%                                                          19.23%    19.23%
                                                         16.67%
                                                                                                                            12.82%
                                              8.33%


                               Americas                                                                         EMEA                                                                         ASPAC
Americas                                                                       EMEA                                                                            ASPAC
                 Best                                    Worst                                    Best                                Worst                                     Best                                     Worst

      Increase                                       Stay the same                  Decrease
© 2010 KPMG International. KPMG International is a Swiss cooperative. Member firms of the KPMG network of independent firms are affiliated with KPMG International.
                                                                                    Increase            Remain same             Decrease
KPMG International provides no client services. No member firm has any authority to obligate or bind KPMG International or any other member firm vis-à-vis third parties,
nor does KPMG International have any such authority to obligate or bind any member firm. All rights reserved.
28 KPMG Global Auto Executive Survey 2010


Hybrid technology rated clear leader


The primary importance that companies                             survey responses, and battery and
ascribe to vehicle efficiency and the                             fuel-cell approaches are ascribed almost
further development of alternative                                equal priority. Regional views of other
propulsion technologies is already                                alternatives are clearly influenced by
apparent from earlier questions in the                            regional issues, particularly the extent of
current survey, as well as from the                               installed fuel infrastructure; accordingly,
growing emphasis on these developments                            ethanol is rated low priority by EMEA
in year-on-year responses despite                                 companies, while LPG is considered
relatively low sales (see next page).                             considerably less important in the
Electric power ranks only just behind                             Americas than elsewhere.
hybrid power developments in the current

How important are these alternative fuel technologies over the next five years?*
                                                                                                                                                                     *Percentage of companies rating
• Strong global consensus on importance of hybrids and electric technologies                                                                                               technologies as important
• ASPAC companies rate solar power much higher than other regions


                                                                                                                                                   85.90%
                                                                                                                                          85.00%


                                                                                                                                                            82.26%
                            68.34%


                                     67.95%


                                              67.74%
                   64.52%
63.34%


          61.54%


                                                                                                                                 61.29%
                                                                                                      46.78%
                                                                                  46.67%
                                                       41.66%


                                                                                                                                                                                                 41.94%
                                                                         40.33%


                                                                                           34.62%


                                                                                                                        34.61%


                                                                                                                                                                                        23.07%
                                                                20.51%


                                                                                                               20.00%


                                                                                                                                                                               18.34%


Fuel-cell electric          Battery electric           Ethanol                    Biodiesel                     LPG/LNG                   Hybrid fuel                          Solar power
power                       power                                                                                                         systems

         Americas             Europe, Middle East and Africa (EMEA)                                 Asia Pacific (ASPAC)
                               Americas
© 2010 KPMG International. KPMG International is a Swiss cooperative. Member firms of the KPMG network of independent firms are affiliated with KPMG International.
                                             EMEA        ASPAC
KPMG International provides no client services. No member firm has any authority to obligate or bind KPMG International or any other member firm vis-à-vis third parties,
nor does KPMG International have any such authority to obligate or bind any member firm. All rights reserved.
     * Percentage of companies rating technologies important
Product innovation and consumer change 29


                  How many alternative fuel vehicles (not including hybrids) will be sold in 2010?*
                                                                                                                                                                                                *2008 sales approximately 1.5 million


                                                          11.50%                                                                     7.69%                                                 19.35%
                                10.00%                                                                                                           1.28%                                                                       1.61%
                                                                                                         17.95%
                                                                         6.67%                                                                7.69%
                                                                                                                                                                                                                         16.13%

                                                                              13.33%
                                                                                                                                                   25.64%

                                                                                                                                                                   24.19%

                                                                                                                                                                                                                         38.71%
                                                                         55.00%


                                                                                                                            39.74%


                  Americas                                                                     EMEA                                                              ASPAC

                       <1 million                           1-1.5 million                            1.5-2 million                    2-2.5 million
                       >2.5 million                         Don’t know


                  How many hybrid vehicles will be sold in 2010?*
Fewer than 1 million                                                         1 - 1.5 million                                                   1.5 - 2 million
                                                                                                                                                                                                  *2008 sales approximately 780,000


2 - 2.5 million                                                              More than 2.5 million                                             Don’t know


                                               Americas                                                                    EMEA                                                                       ASPAC


                                             16.67%
                                                                                                              12.82%                 8.97%
                                                                               1.67%                                                                                               24.19%                                     1.61%
                             10.00%
                                                                                                                                             10.26%                                                                      37.10%
                                                                          43.33%


                                                                                                                                                  29.49%
                                                                                                                                                                   17.74%


                               28.33%
                                                                                                                  38.46%                                                                     19.34%


                  * 2008 sales approximately 780,000
                  Americas                                                                     EMEA                                                              ASPAC

                       <750,000                             750,000-1 million                                 1-1.25 million                          1.25-1.5 million
                       >1.5 million                         Don’t know

                  © 2010 KPMG International. KPMG International is a Swiss cooperative. Member firms of the KPMG network of independent1firms are affiliated with KPMG International.
                                               Fewer than 750,000                                                                     750,000 - million

                  KPMG International provides no client services. No member firm has any authority to obligate or bind KPMG International or any other member firm vis-à-vis third parties,
                  nor does KPMG International have any such authority to obligate or bind any member firm. All rights reserved.
                                                       Greater than 1 million - 1.25 million                                                                     Greater 1.25 million - 1.5 million
30 KPMG Global Auto Executive Survey 2010


Executive view: large Tier 1 supplier – US


This large US supplier believes that                     “I am a little bit more optimistic than I was a             Overall the industry still needs to cut
the industry has made progress                            year ago, but there are a lot of uncertainties.            capacity. It is much easier to cut capacity
in 2009, but that more needs to                                                                                      in the US than it is in Europe, and that is
                                                          The US is only going to sell around 10 million             one reason why the big three have all cut
be done.
                                                          cars this year. Whether the recovery we’ve                 capacity in the US. That is something they
                                                          seen during the second half of the year                    still have to do in Europe. The carmakers
                                                          is sustainable in 2010 is uncertain:                       will all need to continue moving European
                                                          the economy has not bottomed yet, and                      production to the East to cut costs, and
                                                          unemployment is still rising. Elsewhere,                   they will need to cut their production in
                                                          China is still growing, although that bubble               Western Europe because there just won’t
                                                          may burst. India still has huge potential,                 be the sales for those plants.
                                                          although whether consumers have the
                                                          money to buy cars in volume we don’t yet                   I think the biggest winner over the last
                                                          know. And Europe I think may have a more                   year has been General Motors. And it has
                                                          difficult time next year than this, once the               a pretty good model line-up now. As for
                                                          ending of the government incentive                         the others, Ford has had to borrow money
                                                          schemes hits home. But South America                       and that has damaged their finances.
                                                          will grow, and especially Brazil will grow.                Chrysler still has to be turned around, and
                                                                                                                     it’s an open question whether Fiat can
                                                          My sense is that in the US people still do                 achieve that. I think European makers will
                                                          not understand how things are changing.                    suffer unless they can find more ways to
                                                          The automakers are very busy developing                    cut costs. Even Toyota has seen a fall in
                                                          smaller cars, but whether they are going                   US market share for the first time. Almost
                                                          to sell them to the US consumer is another                 everyone has suffered in some way.
                                                          matter: the mindset is not there, not yet.
                                                                                                                     For the US the question is all about demand.
                                                          We are working with a number of                            The potential for selling 16 or 17 million
                                                          companies on electric cars, hybrid-cars                    cars a year is there – the demographics
                                                          and super-economical vehicles. I think the                 are there. The only question is, will people
                                                          pure electric car as a mass-market product                 have the money to buy those cars? I don’t
                                                          is ten years away at least. For now, plug-in               know the answer to that.”
                                                          hybrids have more potential. But in both
                                                          cases the economics of the vehicles are
                                                          unfavorable. For example, we are working
                                                          on a small electric vehicle, but it will still
                                                          have to cost around $40,000 – that’s an
                                                          expensive car. Even with hybrids, if you
                                                          do the math then they don’t really make
                                                          sense. People don’t buy them for economic
                                                          reasons, because as things stand you will
                                                          never get your money back in fuel savings.
                                                          It is hard to see that as a mass market
                                                          proposition.


© 2010 KPMG International. KPMG International is a Swiss cooperative. Member firms of the KPMG network of independent firms are affiliated with KPMG International.
KPMG International provides no client services. No member firm has any authority to obligate or bind KPMG International or any other member firm vis-à-vis third parties,
nor does KPMG International have any such authority to obligate or bind any member firm. All rights reserved.
Product innovation and consumer change 31


R&D will win most investment


When companies were asked where they                      to invest, reflecting the concern of many                 border dealer expansion will be muted,
would direct investment capital, while new                Tier 2 suppliers (supported by the results                especially in the Americas and in EMEA.
technology and new model development                      on profitability earlier in this survey) that             We also note companies’ expectation of
remained top priorities, companies also                   they need to invest to raise profitability.               significant IT and training investment in
said they would spend more on marketing                                                                             the dealer industry; this reinforces results
– but less on logistics and much less on                  The responses on dealer investment                        from KPMG’s study of the global dealer
new plants. The pattern of investment                     represent the views of manufacturers on                   industry published in early 2009, which
intentions for suppliers remains the same                 dealer businesses (dealers themselves                     found that dealers themselves believe
as in last year’s survey, but for suppliers               were not participants in the survey).                     that the industry suffers from an IT and
too the reduction in expectation of new                   Companies believed that ASPAC dealers                     training deficit.
plant building is striking. Tier 2 suppliers              will have a higher propensity to invest,
are expected to show a higher propensity                  and believed that domestic and cross-

                                                          Do you expect manufacturers to increase their investment
                                                          over the next two years?*
                                                                                                                                                     * Positive responses from
                                                          • Investment growth expectations of OEMs fall slightly                                            manufacturers only
                                                            year-on-year
                                                          • Expectations of investment growth in innovation
                                                            remain high


                                                                                             93.00%        93.51%    93.00%


                                                                                   85.71%


                                                                                                                                   55.84%
                                                                                                                                                                     53.00%
                                                                                                                                            49.00%
                                                                      45.00%                                                                              44.16%


                                                            25.97%


                                                          New plants              New models/              New                    Marketing and          Logistics/
                                                                                  products                 technologies           advertising            distribution

                                                               2009                         2008

© 2010 KPMG International. KPMG International is a Swiss cooperative. Member firms of the KPMG network of independent firms are affiliated with KPMG International.
KPMG International provides no client services. No member firm has any authority to obligate or bind KPMG International or any other member firm vis-à-vis third parties,
nor does KPMG International have any such authority to obligate or bind any member firm. All rights reserved.
32 KPMG Global Auto Executive Survey 2010


  Do you expect suppliers to increase their investment over the next two years?*
                                                                                                                                                      * Positive responses from suppliers only. 2008 results include
  • Supplier expectations of innovation investment have grown                                                                                                                 some responses from Tier 3 suppliers
  • Investment growth in new plants to fall by almost half
  • Tier 2 suppliers expect to increase investments in marketing and advertising
                                                                                                    r


                                                                                                              r


                                                                                                                        r


                                                                                                                                  r
                                                                                                   lie


                                                                                                             lie


                                                                                                                       lie


                                                                                                                                 lie
                                                                                                   pp


                                                                                                             pp


                                                                                                                       pp


                                                                                                                                 pp
                                                        r


                                                                   r


                                                                            r


                                                                                       r
                                                       lie


                                                                 lie


                                                                           lie


                                                                                     lie


                                                                                               su


                                                                                                         su


                                                                                                                   su


                                                                                                                             su
                                                       pp


                                                                 pp


                                                                           pp


                                                                                     pp


                                                                                              1


                                                                                                         1


                                                                                                                   2


                                                                                                                             2
                                                   su


                                                              su


                                                                       su


                                                                                  su


                                                                                               r


                                                                                                        r


                                                                                                                  r


                                                                                                                            r
                                                                                           Tie


                                                                                                    Tie


                                                                                                              Tie


                                                                                                                        Tie
                                                  1


                                                             1


                                                                       2


                                                                                 2
                                                   r


                                                            r


                                                                       r


                                                                                r
                                               Tie


                                                        Tie


                                                                   Tie


                                                                            Tie


                                                                                                                                                r


                                                                                                                                                           r


                                                                                                                                                                     r


                                                                                                                                                                               r
                                                                                                                                               lie


                                                                                                                                                         lie


                                                                                                                                                                   lie


                                                                                                                                                                             lie
                                                                                                                                               pp


                                                                                                                                                         pp


                                                                                                                                                                   pp


                                                                                                                                                                             pp
                                                                                                                                           su


                                                                                                                                                      su


                                                                                                                                                                su


                                                                                                                                                                          su


                                                                       95.65%                                     100.00%
                                                                                                                                          1


                                                                                                                                                     1


                                                                                                                                                               2


                                                                                                                                                                         2
                                                                                                                                           r


                                                                                                                                                    r


                                                                                                                                                               r


                                                                                                                                                                         r
                                                                                                                                       Tie


                                                                                                                                                Tie


                                                                                                                                                           Tie


                                                                                                                                                                     Tie


                                                                                 93.00%
                                                                                                                                                                                            r


                                                                                                                                                                                                       r


                                                                                                                                                                                                                r


                                                                                                                                                                                                                          r
                                                                                                                             93.00%
                                                                                                                                                                                           lie


                                                                                                                                                                                                     lie


                                                                                                                                                                                                               lie


                                                                                                                                                                                                                         lie
                                                 89.00%                                      91.00% 91.00%
                                                                                                                                                                                           pp


                                                                                                                                                                                                     pp


                                                                                                                                                                                                               pp


                                                                                                                                                                                                                         pp
                                                             88.00%
                                                                                                                                                                                       su


                                                                                                                                                                                                  su


                                                                                                                                                                                                           su


                                                                                                                                                                                                                     su
                                                                                                                                                               82.61%
                                                                                                                                                                                      1


                                                                                                                                                                                                 1


                                                                                                                                                                                                           2


                                                                                                                                                                                                                     2
         r


                       r


                                 r


                                           r
        lie


                    lie


                               lie


                                         lie


                                                                                                                                                                                       r


                                                                                                                                                                                               r


                                                                                                                                                                                                           r


                                                                                                                                                                                                                    r
                                                                                                                                                                                   Tie


                                                                                                                                                                                            Tie


                                                                                                                                                                                                       Tie


                                                                                                                                                                                                                Tie
        pp


                  pp


                               pp


                                         pp
    su


              su


                            su


                                      su
   1


              1


                           2


                                     2
    r


             r


                         r


                                     r
Tie


         Tie


                     Tie


                                 Tie


                                                                                                                                                                                                                     70.00%

                                                                                                                                          64.00%                                                 64.00%
                                                                                                                                                                         62.00%
                                     59.00%                                                                                                          59.00%
              57.00%


                                                                                                                                                                                                           47.83%

                                                                                                                                                                                      44.00%


   32.00%
                           30.43%


  New plants                                     New models/                                 New                                         Marketing and                               Logistics/
                                                 products                                    technologies                                advertising                                 distribution


         2009                                  2008

  © 2010 KPMG International. KPMG International is a Swiss cooperative. Member firms of the KPMG network of independent firms are affiliated with KPMG International.
  KPMG International provides no client services. No member firm has any authority to obligate or bind KPMG International or any other member firm vis-à-vis third parties,
  nor does KPMG International have any such authority to obligate or bind any member firm. All rights reserved.
Product innovation and consumer change 33


Do you expect dealers to increase their investment over the next two years?*
                                                                                                                                            * Results from manufacturers and suppliers
• ASPAC companies see HR deficit as significant dealer issue
• All regions expect dealers to improve IT


                                                                                                                                                                                   22.58%
                                                                                                                                                       60.00%

                                                                                                                                                       s


                                                                                                                                                                 EA


                                                                                                                                                                                  C
                                                                                                                                                                     47.44%
                                                                                                                                                      ica


                                                                                                                                                                               PA
                                                                                                                                                                EM
                                                                53.85%
                                                                                                                                                    er


                                                                                                                                                                              AS
                                                                                                  s


                                                                                                            EA


                                                                                                                            C
                                                                                                ica


                                                                                                                                                  Am
                                                                                                                         PA
                                                                                                           EM
                                                                                              er


                                                                                                                     AS
                                                                                             Am


                                                                                                                                                                                   77.42%

                                                                                                                            72.58%

                                                                                                  66.67%
                                                  s


                                                            EA


                                                                             C
                                                ica


                                                                          PA
                                                           EM
     s


               EA


                               C


                                               er


                                                                         AS
  ica


                            PA


                                             Am
              EM
 er


                        AS
Am


                                                                                                                51.28%
                                                                              46.77%                                                                                 46.15%
                              43.55%

                   38.46%                                                                                                                              38.33%
                                                                 35.90%
     31.67%

                                                  25.00%


 Domestic expansion                            Cross-border expansion                         IT systems and                                         HR training
 and acquisitions                              and acquisitions                               communication

       Yes
        Yes                            No

© 2010 KPMG International. KPMG International is a Swiss cooperative. Member firms of the KPMG network of independent firms are affiliated with KPMG International.
KPMG International provides no client services. No member firm has any authority to obligate or bind KPMG International or any other member firm vis-à-vis third parties,
nor does KPMG International have any such authority to obligate or bind any member firm. All rights reserved.
34 KPMG Global Auto Executive Survey 2010


Chapter 7: Investing in new markets


Companies are nearly unanimous in                                reflect companies’ revenue expectations:
expecting emerging markets to build most                         the strongest expectations are for revenues
automotive capacity and to provide the                           from China although a very small minority
most growth in automotive revenues. The                          of companies envisage revenue decline in
majority of companies say they intend to                         China. In India many more companies see
increase their investments in the BRICs                          moderate growth than see strong growth,
(Brazil, Russia, India and China).                               although no companies at all envisage
                                                                 revenue falls. Moderate rather than strong
Of companies with existing investments in                        growth is also the majority expectation for
the BRICs, most say they will increase the                       Brazil. Russia is the outlier – while more
value of those investments (the number of                        than half of all investors have expectations
companies with existing investments that                         of moderate or strong growth, a significant
say they have no plans to change their level                     minority now anticipate a fall in revenues
of investment is negligible). Those results                      over five years.


                                       North America (ie US & Canada)           Over the next five years which
                                                                                                      Western Europe                                                        Japan

                                                                                region of the world or country do
                                                                                you think will build the most
                                       Eastern Europe & Russia                                        Asia excluding Japan                                                  Centra


                                       Middle East & Africa                     manufacturing capacity?
                                                                                                      Don’t know


                                                                                                                     2.50%
                                                                                                                          2.50%
                                                                                                                              1.00%


                                                                                                                        6.50%
                                                                                                                                      1.00%
                                                                                                                                         3.00%

                                                                                                                           10.00%


                                                                                                                     73.50%


                                                                                    North America (US & Canada)
                                                                                    Western Europe
                                                                                    Japan
                                                                                    Eastern Europe and Russia
                                                                                    Asia (excluding Japan)
                                                                                    Central & South America
                                                                                    Middle East & Africa
                                                                                    Don’t know
© 2010 KPMG International. KPMG International is a Swiss cooperative. Member firms of the KPMG network of independent firms are affiliated with KPMG International.
KPMG International provides no client services. No member firm has any authority to obligate or bind KPMG International or any other member firm vis-à-vis third parties,
nor does KPMG International have any such authority to obligate or bind any member firm. All rights reserved.
Investing in new markets 35


       Do you plan to increase or
       decrease your investment                                                                         What are your revenue forecasts for the
       in the BRICs?                                                                                    BRICs?

       • Existing BRIC investors will increase                                                          • India and China seen as biggest growth markets
         exposure                                                                                       • Significant minority see Russian decline
       • Reduction of investment negligible


                                                                                                                                                                      ia
                                                                                                       ina


                                                                                                                                                il


                                                                                                                                                                      ss
                                                                                                                           dia


                                                                                                                                               az


now
                                                                                                                                                                 Ru
                                                                                                      Ch


                                                                                                                                             Br
                                                                                                                          In
      ina


                                                                                                                                                     1.14%                 2.38%
      Ch


                                                                                                             2.82%    0.70%                                   3.41%
                                                                                                                                 16.35%
                                                                                                                                                                           15.48%


te decline
                    2.00%                                                                                    7.75%                                   29.55%

           58.50%                                                                                            46.48%
                                                                                                                                 53.85%                                    25.00%
                          dia
                        In


/stable
                                                             ia
                                                          ss
                                                        Ru


                                                                                                                                                     53.41%
                            43.00%                                0.50%
                                       il


                                                                                                                                                                           41.67%
                                     az
                                     Br


te improvement                                       2.00%
                                                               35.00%


                                                                                                             42.25%
                                            26.00%


mprovement                                                                                                                       29.81%


                                                                                                                                                                           15.48%
                                                                                                                                                     12.50%


             Increase                       Decrease                                                         Strong improvement                 Moderate improvement
                                                                                                             Neutral/stable                     Moderate decline
                                                                                                             Don’t know
       © 2010 KPMG International. KPMG International is a Swiss cooperative. Member firms of the KPMG network of independent firms are affiliated with KPMG International.
       KPMG International provides no client services. No member firm has any authority to obligate or bind KPMG International or any other member firm vis-à-vis third parties,
       nor does KPMG International have any such authority to obligate or bind any member firm. All rights reserved.
36 KPMG Global Auto Executive Survey 2010


Executive view: diversified supplier – emerging market


This India-focused supplier, part                        “I am almost 100 percent more confident                     As we go into 2010 I can see a lot of M&A
of a group with sales of over half                        than I was at this time last year, and I am                opportunities. Many companies outside
a billion US dollars and over 6,000                       especially confident about the Indian market.              of Asia are not in good shape, and we may
                                                                                                                     be able to buy them cheaply. The limiting
employees, says that automotive
                                                          The crisis certainly had a very negative                   factor is financing: banks have cut lending,
demand in emerging markets is                             effect on many of our customers. We saw                    and we will have to rely on internal sources
set to grow at breakneck speed.                           the worst effects in the commercial                        of capital.
                                                          vehicle market. Vehicle usage was down,
                                                          demand for new vehicles was down, and                      We would look for market share and for
                                                          it was very difficult for companies to                     technology. In commercial vehicles, for
                                                          finance new purchases. Private passenger                   example, we have the market share, but
                                                          car demand held up better: personal                        we are concerned that we don’t have
                                                          finances were more resilient than                          future technology. For passenger cars
                                                          company finances.                                          we need market share.

                                                          We have cut output, but we did that by                     For the next five years our biggest
                                                          reducing staffing, a cut of somewhere                      challenges are going to be dealing with
                                                          between 20-30 percent. We have not                         a growing market. We have two or three
                                                          closed any facilities. And in the last                     main competitors in India, and we need
                                                          quarter of 2009 we stopped cutting                         to maintain market share as the market
                                                          manpower. It is quite likely that by the end               grows. A key will be winning business
                                                          of the first quarter of 2010 all those job                 from the world’s main OEMs as they
                                                          cuts will be reversed.                                     invest more in India.”

                                                          We have also cut costs by reducing the
                                                          number of processes we outsource,
                                                          things like powder coating and machining.
                                                          Our strategy has been to increase the
                                                          amount of value we add in-house.


© 2010 KPMG International. KPMG International is a Swiss cooperative. Member firms of the KPMG network of independent firms are affiliated with KPMG International.
KPMG International provides no client services. No member firm has any authority to obligate or bind KPMG International or any other member firm vis-à-vis third parties,
nor does KPMG International have any such authority to obligate or bind any member firm. All rights reserved.
Investing in new markets 37


BRIC sales forecasts continue to grow


In previous editions of this survey,                      When will China sell a significant number (1 million+ a year)
companies were asked to give specific                     of cars in other markets?
forecasts of domestic unit sales growth
ranges and export sales in China in five                  • Expectations of Chinese exports improve after falling last year
years’ time: the current survey extended                                             2009                                                                2008
these questions to all of the BRIC markets.
                                                                                    28.90%                                                     36.00%

Expectations for both domestic and export
Chinese sales have increased. There has
been an increase in expectation for the higher
ranges of domestic sales to be achieved by
2014, except in the extreme high range of
18 million plus: we believe this indicates both
a growth in optimism on and knowledge of                                             71.10%                                                                     64.00%
the Chinese market on the part of companies.
The proportion of companies expecting
export sales to pass one million within five
years has also increased.                                 2009                                                             2008


                                                               Within 5 years                  Beyond 5 years


What do you estimate will be the annual volume of unit sales in China by 2014?*
                                                                                                                      *2008 sales approximately 9.4 million cars and commercial vehicles


                                                               42.25%


                                             30.00%


                                                                                                20.42%       20.00%                                                            20.00%


                                                                                                                                  13.38%
                                 10.56%
              10.00%                                                       10.00%                                                             10.00%                 9.15%


    1.41%


<10 million                  10-12 million                 12-14 million                     14-16 million                   16-18 million                       >18 million

    2009                         2008
© 2010 KPMG International. KPMG International is a Swiss cooperative. Member firms of the KPMG network of independent firms are affiliated with KPMG International.
KPMG International provides no client services. No member firm has any authority to obligate or bind KPMG International or any other member firm vis-à-vis third parties,
nor does KPMG International have any such authority to obligate or bind any member firm. All rights reserved.
38 KPMG Global Auto Executive Survey 2010


The consensus views of companies on                              It should also be noted that investment
sales in Brazil, India and Russia are also                       intentions noted elsewhere in this
strikingly strong. Expectations of sales                         survey for India in particular do not seem
volumes in India are equivalent to a                             commensurate with sales expectations,
consensus that growth of 17 percent will                         suggesting that companies may be
be achieved annually. The consensus is for                       expecting to sell in India a significant
growth of around 30 percent over five                            proportion of vehicles manufactured
years in Brazil, and of around 40 percent                        elsewhere.
over five years in Russia (although it should
be noted that a significant minority think
Russian sales will be flat or even fall).


What do you estimate will be the annual                                                          What do you estimate will be the annual
volume of unit sales in India in 2014?*                                                          volume of unit sales in Brazil in 2014?*
*2008 sales approximately 2.3 million cars and commercial vehicles                               *2008 sales approximately 3.2 million cars and commercial vehicles


                                                                                                                           47.73%


                          47.12%


                                                                                                    36.36%


                                                  25.96%


                                                                       15.38%


   11.54%
                                                                                                                                                    9.09%


                                                                                                                                                                      4.55%


     2-3 million                     3-4 million                                                      3-4 million                     4-5 million
     4-5 million                     >5 million                                                       5-6 million                     >6 million
© 2010 KPMG International. KPMG International is a Swiss cooperative. Member firms of the KPMG network of independent firms are affiliated with KPMG International.
*2008 sales approximately 2.3 million services. commercial vehicles any authority to obligate or bind KPMG International or any other member firm vis-à-vis third parties,
KPMG International provides no client cars and No member firm has
nor does KPMG International have any such authority to obligate or bind any member firm. All rights reserved.
Investing in new markets 39


                                                                                                                        China
Expectations for the achievement of                             be achieved by Brazil within the five-year                                                 31.50%

export sales of over one million rank in                        horizon. However companies do not
order India, Brazil and Russia. Over 50                         believe that Russia is in that league:                           2.82%
percent of companies think that level will                      almost two thirds of companies believe
be achieved by India within five years, and                     Russia will not sell more than one million                                                   29.81%
                                                                                                                                42.25%
over 45 percent of companies think it will                      cars outside its borders within five years.


                                                                                                                                                             53.85%


                                                                                                                                46.48%


                                                                                                                      When will Brazil, Russia and India
What do you estimate will be the annual                                                                               sell a significant number (1 million +
volume of unit sales in Russia in 2014?*                                                                              a year) of cars in other markets?
                                                                                                                                                             16.35%
                                                                                                                      0.70%                                                         3
*2008 sales approximately 2.8 million cars and commercial vehicles                                                               7.75%


                                                                                                                                                                      ia
                                                                                                                                            il


                                                                                                                                                                      ss
                                                                                                                  dia


                                                                                                                                           az


                                                                                                                                                                    Ru
                                                                                                                                          Br
                                                                                                                 In


                       Beyond 5 years
                                                                                                                        47.12%                   54.55%                    63.10%


                          42.86%


                       Within 5 years
                                                 32.14%


                                                                                                                         52.88%


                                                                                                                                                  45.45%


                                                                                                                                                                           36.90%

                                                                      15.47%


    7.14%


     2-3 million                     3-4 million                                                                                Within 5 years             Beyond 5 years
     4-5 million                     >5 million
© 2010 KPMG International. KPMG International is a Swiss cooperative. Member firms of the KPMG network of independent firms are affiliated with KPMG International.
KPMG International provides no client services. No member firm has any authority to obligate or bind KPMG International or any other member firm vis-à-vis third parties,
nor does KPMG International have any such authority to obligate or bind any member firm. All rights reserved.
40 KPMG Global Auto Executive Survey 2010


Smaller emerging markets to gain


For companies looking for new growth                             and EMEA companies on the latter.
markets, the BRICs are no longer the only                        However, ASPAC companies are shown
game in town. Companies in KPMG’s                                to be considerably more interested in
Global Auto Executive Survey say they                            Africa than any others, reflecting Asian
expect growth and auto investment in                             companies’ long-standing willingness to
many other growing economies, with the                           invest in economies that others may see
strongest expectations for Southeast Asia                        as marginal. Companies in both EMEA and
and for Eastern Europe, with ASPAC                               the Americas are more likely to expect
companies most focused on the former                             investment in the Middle East.


Not counting the BRICs which regions will attract most auto industry investment over the next five years?

• For all regions expectations of South East Asian investment highest


                       Americas                                                         EMEA                                                       ASPAC


                                             35.00%                                                   41.03%                                                           22.58%
  35.00%


 6.67%                                                               39.74%


                                                                       6.41%
                                                                                                                                                                     12.9%

                        23.33%                                                 10.26%                                                  51.61%
                                                                                                                                                 4.84%


                                                                                                                                                         1.61%


Americas                                                         EMEA                                                ASPAC

    Eastern Europe including Ukraine                         Central and South America including Mexico                  Middle East including North Africa
    Africa excluding North Africa                            Southeast Asia
                                  Eastern Europe including Ukraine                                                      Central and South America including Mexico

© 2010 KPMG International. KPMG International is a Swiss cooperative. Member firms of the KPMG network of independent firms are affiliated with KPMG International.
KPMG International provides no client services. No member firm has any authority to obligate or bind KPMG International or any other member firm vis-à-vis third parties,
nor does KPMG International have any such including North Africa
                                  Middle East authority to obligate or bind any member firm. All rights reserved.       Africa excluding North Africa
Investing in new markets 41


 It is striking that when asked which                             Malaysia over Thailand, and ASPAC
 individual countries outside the BRICs will                      companies prefer Vietnam slightly over
 attract auto investment in the coming five                       Malaysia). In the Middle East Morocco was
 years there are clear winners: Ukraine is                        the clear leader in investment expectations,
 seen as the outstanding East European                            albeit on a low base of companies responding.
 destination (although on regional basis                          In South and Central America, Mexico
 Americas and EMEA favor Poland); Thailand                        emerges – unsurprisingly given its
 is the outstanding destination in Southeast                      significance as a manufacturing base for US
 Asia (although on a regional basis both                          companies – as the outstanding destination.
 ASPAC and EMEA companies prefer


 Which emerging economies will attract most auto investment over the next five years?*
                                                                                                                                                                   *Top five investment destinations
 • Biggest existing manufacturing countries to attract most new investment


                                                                                                                                              ico
                                                                                                                                          ex
                                                                                                                                          M


                                                                                                                                               71.05%
                                                                       d
                                                                    an
 ine


                                                                   ail
ra


                                                                  Th
Uk


                                                                                    ia
                                                                                   ys
                                                                                ala


                                                                                                 m


                                                                       34.68%
                                                                                M
                d


                                                                                               na


  33.00%
           lan


                                                                                                                                                             ina
                                                                                                et
                              ia
           Po


                          an


                                                                                                                                                         nt
                                                                                             Vi
                                                 c


                                                                                                                                                        ge
                         m


                                               bli
                         Ro


                                                                                                                                                        Ar
                                              pu


                                                                                                                   sia


                                                                                    25.81%
                                            Re


                                                                                                                ne


                22.00%                                                                           22.58%
                                                                                                             do
                                         h


                                                            y
                                       ec


                                                         ar


                                                                                                          In
                                                      ng
                                       Cz


                              18.00%                                                                                                                      18.42%
                                                                                                                               es
                                                     Hu


                                                                                                                                                                    ile


                                                                                                                                                                                       la
                                                                                                                            pin


                                                                                                                                                                                   ue
                                                                                                                                                                   Ch
                                                                                                                           ilip


                                                                                                                                                                                  ez


                                                                                                                                                                                                ia


                                                                                                                 12.1%
                                                                                                                                                                                               liv
                                                                                                                         Ph


                                                                                                                                                                                   n
                                                                                                                                                                                Ve


                                                                                                                                                                                               Bo


                                            10.00%
                                                          8.00%
                                                                                                                                                                        6.58%
                                                                                                                                  3.23%                                                             1.32%
                                                                                                                                                                                       2.63%


 Eastern Europe                                                     Southeast Asia                                                            Central and South America
                                                                                                                                              South East Asia
     Eastern Europe                                                    Central & Sth America


 © 2010 KPMG International. KPMG International is a Swiss cooperative. Member firms of the KPMG network of independent firms are affiliated with KPMG International.
 KPMG International provides no client services. No member firm has any authority to obligate or bind KPMG International or any other member firm vis-à-vis third parties,
 nor does KPMG International have any such authority to obligate or bind any member firm. All rights reserved.
kpmg.com


                     Global Automotive contacts                                                                    Regional Automotive contacts

                     Dieter Becker                                                                                 ASPAC
                     Global Chair, Automotive                                                                      Chang Soo Lee
                     KPMG ELLP                                                                                     Samjong KPMG in Korea
                     T: +49 711 9060 41720                                                                         T: +82 (2) 2112 0600
                     E: dieterbecker@kpmg.com                                                                      E: changsoolee@kr.kpmg.com

                     Stephanie Goering                                                                             The Americas
                     Global Executive, Automotive                                                                  Gary Silberg
                     KPMG ELLP                                                                                     KPMG in the US
                     T: +49 711 9060 41271                                                                         T: +1 312 665 1916
                     E: sgoering@kpmg.com                                                                          E: gsilberg@kpmg.com

                                                                                                                   EMA
                                                                                                                   Dieter Becker
                                                                                                                   KPMG ELLP
                                                                                                                   T: +49 711 9060 41720
                                                                                                                   E: dieterbecker@kpmg.com


The information contained herein is of a general nature and is not intended to address the circumstances of any particular            © 2010 KPMG International Cooperative (“KPMG
individual or entity. Although we endeavor to provide accurate and timely information, there can be no guarantee that such            International”), a Swiss entity. Member firms of the KPMG
information is accurate as of the date it is received or that it will continue to be accurate in the future. No one should act upon   network of independent firms are affiliated with KPMG
such information without appropriate professional advice after a thorough examination of the particular situation.                    International. KPMG International provides no client services.
                                                                                                                                      No member firm has any authority to obligate or bind KPMG
The views and opinions expressed herein are those of the interviewees and do not necessarily represent the views and                  International or any other member firm vis-à-vis third parties,
opinions of KPMG International or KPMG member firms.                                                                                  nor does KPMG International have any such authority to
                                                                                                                                      obligate or bind any member firm. All rights reserved.

                                                                                                                                      KPMG and the KPMG logo are registered trademarks of
                                                                                                                                      KPMG International Cooperative (“KPMG International”),
                                                                                                                                      a Swiss entity.
                                                                                                                                      Designed by Roundel
                                                                                                                                      Publication name: KPMG’s Global Auto Executive Survey
                                                                                                                                      2010
                                                                                                                                      Publication number: 912007
                                                                                                                                      Publication date: December 2009
                                                                                                                                      Printed on recycled material

Global auto-survey-2010

  • 1.
    Au to mot i v e KPMG’s Global Auto Executive Survey 2010 Industry Concerns and Expectations to 2014 kpm g i nt e r n A t i o n A l
  • 2.
    Contents Chapter Page 1 Survey methodology 2 2 Executive summary 3 3 Introduction 4 4 The growth prospect 6 Executive view: volume automaker – Europe 8 Overcapacity is now critical 9 Emerging markets are becoming overbuilt 11 5 The performance angle 12 Executive view: mid-size automaker – US 14 No easy cost savings expected 15 Capital costs to remain high 17 M&A set to grow 18 Debt and technology needs will drive M&A 20 6 Product innovation and consumer change 22 Fuel efficiency and environment top of consumer concerns 24 Low-cost producers to win most market share 26 Hybrid technology rated clear leader 28 Executive view: large Tier 1 supplier – US 30 R&D will win most investment 31 7 Investing in new markets 34 Executive view: diversified supplier – emerging market 36 BRIC sales forecasts continue to grow 37 Smaller emerging markets to gain 40 © 2010 KPMG International. KPMG International is a Swiss cooperative. Member firms of the KPMG network of independent firms are affiliated with KPMG International. KPMG International provides no client services. No member firm has any authority to obligate or bind KPMG International or any other member firm vis-à-vis third parties, nor does KPMG International have any such authority to obligate or bind any member firm. All rights reserved.
  • 3.
    Foreword 1 Foreword KPMG’s Global Auto Executive Survey And there are huge technology challenges 2010 was conducted at the end of a historic to be met. Last year companies told year for the auto business. The intensity of us that fuel efficiency and emissions the crisis that engulfed the entire industry improvements were top of their agenda. can hardly be underestimated. This year they are still top of their agenda. Last year we surveyed an industry that Meanwhile, companies face the challenge had been plunged, very suddenly, into of financing the cycle of innovation – and total uncertainty. As one of the large let us not forget that we are still in the automakers interviewed as part of this middle of a rapid innovation cycle – while year’s report said, “a year ago we were consumers feel they are poorer than Dieter Becker in the middle of nowhere … anything before, and less inclined to spend. That, Global Chair, Automotive was possible.” say our respondents, means that companies KPMG ELLP are likely to have to compete on technology This crisis was in part a consequence and on cost. That is a tall order. of success. Auto products are better than they have ever been: with today’s Meeting that challenge inevitably means high levels of reliability and longevity, more change – more change in the structure many customers can defer the purchase and in the practices of the auto industry. of a new vehicle. So when confidence If anything is clear from what respondents collapsed on a global scale at the end are saying to us today, it is that change has of 2008, that is exactly what customers only just begun. did. Sales plummeted in almost every market, while financial conditions became intolerable even for companies with moderate levels of indebtedness. The destruction of large segments of the world’s auto industry – and other industries too – became a real possibility. As our survey records, the industry is already on the way out of that period of crisis. Confidence is higher, while growth and new investment are back on the agenda. But more striking is the record of auto industry caution that the survey depicts. We have come a long way, respondent companies are saying, but we have a lot further to go. In particular, we note that many companies are saying that overcapacity is still at very high levels – respondents believe it is significantly higher than last year, despite a year of closures and bankruptcies – and the consequence is that much of the expected restructuring of the industry may still lie in the future. © 2010 KPMG International. KPMG International is a Swiss cooperative. Member firms of the KPMG network of independent firms are affiliated with KPMG International. KPMG International provides no client services. No member firm has any authority to obligate or bind KPMG International or any other member firm vis-à-vis third parties, nor does KPMG International have any such authority to obligate or bind any member firm. All rights reserved.
  • 4.
    2 KPMG Global Auto Executive Survey 2010 Chapter 1: Survey methodology KPMG’s Global Auto Executive Each year we ask executives to describe In last year’s survey a number of questions Survey 2010 is the 11th consecutive themselves and their companies. In earlier were restricted to regional companies. annual survey of senior global auto surveys automakers and suppliers describing In the present survey all companies were themselves as Tier 1, Tier 2 and Tier 3 offered the opportunity to respond to all executives carried out by KPMG companies participated. However, the questions, irrespective of the region in International. This year the survey is increasing difficulty of finding a large which the company was headquartered. more extensive than in previous sample of Tier 3 suppliers that are of The result is a greatly expanded sample years: 200 respondents from 24 sufficient size to participate in the survey base throughout the current survey. countries took part in the survey (with revenues in excess of US$100 million) between mid-September and early meant that in last year’s survey no respondents Some questions elicited no response from November 2009, including chose to describe themselves as Tier 3 some respondents; therefore total results companies in the Americas, Asia suppliers, and results from Tier 2 and Tier 3 may be less than 100 percent. Pacific, Europe, Africa and the suppliers in data from earlier years were Middle East. All survey questions grouped together. In the current survey relate to the coming five-year KPMG restricted the survey to Tier 1 and Tier 2 suppliers. In almost all cases this period, extending to 2014, unless permits direct year-on-year comparisons specifically stated otherwise. of results from Tier 1 and Tier 2 suppliers – in only one case (noted in the text), comparative data from 2007 includes some results from Tier 3 suppliers. Survey participants Survey participants by job title by company type 11.50% 4% 3% 38.50% 47% 40% 6% 50.00% CEO/President/Chairman Vehicle manufacturer C-level Executive Tier 1 supplier Business Unit Head/Functional Head Tier 2 supplier Vehicle Manufacturer Business Unit Function Management/ Tier 1 Supplier Leadership Team CEO/President/ChairmanManager Business Unit Functional C-level exe © 2010 KPMG International. KPMG International is a Swiss cooperative. Member firms of the KPMG network of independent firms are affiliated with KPMG International. Business Unit Head/Functional Head KPMG International provides no client services. No member firm has any authority to obligate or bind KPMG International or any other member firm vis-à-vis third parties, Business U nor does KPMG International have any such authority to obligate or bind any member firm. All rights reserved. Business Unit Functional Manager
  • 5.
    Executive Summary 3 Chapter 2: Executive Summary Key results The performance angle Alternative propulsion technologies are Expectations of emerging market Profitability expectations have fallen. the key technological focus for companies. performance and auto investment Respondents believe best performers will Electric power ranks only just behind accumulation have strengthened be companies able to leverage the whole hybrid power developments and battery considerably. of the supply chain, with higher profits and fuel-cell approaches are ascribed expected of automakers, and the lowest almost equal priority. Overcapacity is still seen to be very high expectation for Tier 3 suppliers. over the five-year period in the Americas, Companies say they will direct most Europe and Japan; M&A activity is Companies expect financial conditions investment capital to technology and expected to be strong. to improve, but only moderately, with new model development. New plant conditions better for consumers than building is accorded very low priority. The long-term investment focus remains for companies. on new products and new technologies, New markets especially fuel efficiency. Expectations for M&A have risen, marginally, Companies are nearly unanimous in from an already high level in the preceding expecting emerging markets to build most The growth prospect year, with the exception of the dealer automotive capacity and to provide the All emerging economy regions are business, where after a year of closure most growth in automotive revenues. expected to contribute growth: not only and rationalization companies now see The majority of companies surveyed say Asia excluding Japan, but also Eastern M&A falling back. they intend to increase their investments Europe and Russia. in the BRICs. Companies expect to find fewer cost-saving Growth expectations for Western Europe opportunities in existing businesses. Expectations for both domestic and are low, and lower still for both Japan and export Chinese sales have increased. North America. Product innovation and consumer change The consensus view of companies on The industry still believes that overcapacity New products and new technologies have sales growth in Brazil, India and Russia in the established manufacturing “triad” – moved higher in the ranking of concerns is also strong, although Russian export North America, Europe and Japan – from an already high leading position. potential is not rated so highly. remains very high. Fuel efficiency and the environmental Beyond the BRICs companies expect Companies also have strong concerns profile of products continue to be strong demand growth and auto over the emergence of automotive considered by companies the most investment in South East Asia and overcapacity in the BRICs. Concern is significant consumer buying issues. in Eastern Europe. highest in Russia but companies also believe that the automotive industry Chinese and Indian brands remain in the Top-rated individual destinations for in Brazil will be overbuilt in the near to top three places in terms of expectation of auto investment beyond the BRICs medium term, and that China and India market share gain, but conviction is slightly are Ukraine, Thailand and Mexico. will also have significant overcapacity lower than last year. Two significant not much later. winners of market share competition are seen as Hyundai/Kia and VW. Companies in all three global regions cite exactly the same three vehicle types as top market share gainers (hybrids, other alternative-fuel vehicles and low-cost introduction cars). © 2010 KPMG International. KPMG International is a Swiss cooperative. Member firms of the KPMG network of independent firms are affiliated with KPMG International. KPMG International provides no client services. No member firm has any authority to obligate or bind KPMG International or any other member firm vis-à-vis third parties, nor does KPMG International have any such authority to obligate or bind any member firm. All rights reserved.
  • 6.
    4 KPMG Global Auto Executive Survey 2010 Chapter 3: Introduction Last year’s KPMG Global Auto Executive Yet the worst was avoided. Exceptional But we are left with a world that has Survey reported on an industry falling into government intervention helped to shield changed: a deep restructuring of the crisis. Sales were collapsing, growth the industry from the worst of the fall in automotive industry has begun, and expectations were swinging from positive demand, and allowed some companies continues. One dimension of this has to negative, investment schedules were to begin to rebuild themselves behind the been a significant transfer of automotive being torn up, and for more than one large wall of temporary bankruptcy. Above all, technology to the emerging world. company, bankruptcy loomed. the sudden loss of confidence in demand Existing producers with lower costs have and growth in the big emerging economies seen their businesses strengthened. This year, we report on an industry that was counteracted by an equally sudden And with a global market that has clearly has confronted the crisis, and has just resurgence, as it became clear that shrunk, many established producers are begun to emerge into a landscape of emerging world growth was much more having to confront the fact that competition greater stability. In many ways the crisis resilient than pessimists feared. The for sales is likely to be much, much was much worse than the gloomiest stabilization and subsequent recovery of tougher in the next few years than any predictions. Bankruptcy became a reality asset prices against a background of less time in the last two decades. for a number of large automakers, as volatile energy costs helped immeasurably. demand fell further and faster than As one European automaker interviewed expected, and as the ability of indebted for this report commented: “this last year businesses to finance themselves simply has made us confront reality”. evaporated. © 2010 KPMG International. KPMG International is a Swiss cooperative. Member firms of the KPMG network of independent firms are affiliated with KPMG International. KPMG International provides no client services. No member firm has any authority to obligate or bind KPMG International or any other member firm vis-à-vis third parties, nor does KPMG International have any such authority to obligate or bind any member firm. All rights reserved.
  • 7.
    © 2010 KPMGInternational. KPMG International is a Swiss cooperative. Member firms of the KPMG network of independent firms are affiliated with KPMG International. KPMG International provides no client services. No member firm has any authority to obligate or bind KPMG International or any other member firm vis-à-vis third parties, nor does KPMG International have any such authority to obligate or bind any member firm. All rights reserved.
  • 8.
    6 KPMG Global Auto Executive Survey 2010 Chapter 4: The growth prospect The current survey shows that the gradual All emerging economy regions are On a regional basis, pessimism on reorientation of growth expectations away expected to contribute growth: not only revenues in the Americas is strongest from the mature economies and toward Asia (excluding Japan), but also Eastern in European and Asian companies. Asia and other significant emerging Europe and Russia. The balance of Companies in the Americas are slightly economies has passed a tipping point. expectations for Western Europe is now more positive both regarding their own Although previous surveys show that even between companies expecting region, and on growth prospects in Asia. companies have consistently been some decline and companies expecting forecasting a decline in the growth trend some improvement (most expect little for some years, the great majority of change), but the balance Increase is negative for Stable Decline companies now locate all their significant both Japan and North America: more growth expectations for the next five companies now expect decline in those years in the emerging world. regions than expect improvement. What are your forecasts for auto industry revenues in the following regions and countries? • Growth expectations largely geared to Asia • Eastern Europe shows second biggest increase • Biggest declines seen in North America and Japan ia ss n) ica Ru pa er & Ja Am pe pe ing ica ro a ro h ric Eu lud ut er Eu Af So Am xc rn n & er te (e l& rth st st es ia ra Ea Ea No W As nt n le Ce pa idd Ja M 6.00% 23.50% 24.00% 31.50% 17.50% 15.50% 27.00% 19.00% 42.00% 76.00% 28.00% 50.00% 52.50% 47.00% 44.50% 47.00% 36.00% 24.50% 21.50% 20.00% 19.00% Increase Stable Decline © 2010 KPMG International. KPMG International is a Swiss cooperative. Member firms of the KPMG network of independent firms are affiliated with KPMG International. KPMG International provides no client services. No member firm has any authority to obligate or bind KPMG International or any other member firm vis-à-vis third parties, nor does KPMG International have any such authority to obligate or bind any member firm. All rights reserved.
  • 9.
    The growth prospect 7 What are your forecasts for auto industry revenues in the following regions and countries?* • Companies in the Americas most optimistic on emerging economy growth * Percentage of companies expecting improvements • Japan rated lowest growth market by EMEA companies • Broad regional consensus on high Eastern European and Asian growth 86.67% 74.20% 69.23% 48.71% 46.67% 45.16% 41.66% 38.46% 30.00% 29.03% 26.67% 27.42% 27.42% 23.08% 19.36% 19.23% 18.34% 18.34% 17.74% 16.66% 14.11% North America Western Europe Japan Eastern Europe & Asia (excluding Central & South Middle East & Russia Japan) America Africa Americas Europe, Middle East and Africa (EMEA) Asia Pacific (ASPAC) © 2010 KPMG International. KPMG International is a Swiss cooperative. Member firms of the KPMG network of independent firms are affiliated with KPMG International. ASPAC EMEA KPMG International provides no client services. No member firm has any authority to obligate or bind KPMG International or any other member firm vis-à-vis third parties, nor does KPMG International have any such authority to obligate or bind any member firm. All rights reserved.
  • 10.
    8 KPMG Global Auto Executive Survey 2010 Executive view: volume automaker – Europe This Europe-headquartered global “My confidence level has increased As for the global picture, I think the next automaker with significant significantly in the last 12 months. A year five years are going to see the industry manufacturing and sales in all ago we were in the middle of nowhere – challenged to compete both on technology not just in the auto industry; it applied to all and on cost. In technology we have a huge regions of the world says that more businesses. Nobody knew what the next challenge ahead of us, especially in CO2 than ever the key to success is 24 months would bring. Anything was reduction where expectations are enormous. product excellence. possible. But now we have some clarity. And on the cost front there is no reason to expect our mature-economy consumers Consumer demand has recovered better to become very much wealthier over the than we expected a year ago. It is still next few years, so there is also going to be going to take a long time to recover fully, a strong focus on affordability. but the important thing is that recovery is predictable. The last year has shown us that the winners in tough situations are always I share the general faith in demand from the companies with strong products at the emerging markets. From the consumer affordable cost. If you have weak products point of view these markets are simply you are going to suffer even with a good better placed than the US or Europe or cost situation. That is irrespective Japan. In the past these economies were of segment or market” highly dependent on foreign direct investment for their growth, but now they are generating their own trade surpluses, they have growth that is not investment- dependent, and some of them are still benefiting from very low interest rates. So the emerging market economies will be fairly positive over the next one to two years. The question is, what does this mean for autos? We’ve seen a huge increase in demand over 2009, but for the near future I am more doubtful about auto demand. I don’t expect a collapse, but incentives like we have seen in China and Brazil cannot continue forever. © 2010 KPMG International. KPMG International is a Swiss cooperative. Member firms of the KPMG network of independent firms are affiliated with KPMG International. KPMG International provides no client services. No member firm has any authority to obligate or bind KPMG International or any other member firm vis-à-vis third parties, nor does KPMG International have any such authority to obligate or bind any member firm. All rights reserved.
  • 11.
    The growth prospect 9 Overcapacity is now critical For several years KPMG’s Global The result is one of the most striking in Those companies that do see overcapacity, Executive Auto Survey has asked the survey. After a year of unprecedented are more likely to rate the level of companies about their perceptions of change in the structure of the auto overcapacity higher in North America than overcapacity: the extent to which the industry, one in which automakers – elsewhere, with a consensus of around manufacturing capacity of the industry is including the large US manufacturers 25 percent overcapacity, although a overbuilt is a key determinant of profitability – and suppliers closed capacity around significant minority see higher levels – now and the likely path of restructuring the world, the industry still believes one in ten companies thinks overcapacity through mergers, acquisitions and that overcapacity in the established in North America is more than 40 percent, divestments in the coming five years. manufacturing “triad” – North America, for example. In the current survey these questions Europe and Japan – remains very high. were expanded to provide an insight into industry perceptions of regional Companies see more overcapacity in overcapacity. (It is worth noting that North America than in other regions, these questions on overcapacity relate but in all cases the majority sees to long-term capacity: companies were significant overcapacity. asked to rate levels of overcapacity over a whole business cycle, and not just overcapacity in relation to the current year’s market). Is there automotive overcapacity in North America today? How much? • North America seen as most overbuilt • Perceptions of 20 percent plus overcapacity have risen strongly year-on-year 9.00% 3.00% 37.50% 35.80% 88.00% 13.64% 10.22% 2.84% Yes 1-10% 11-20% 21-30% 31-40% More than 40% No DK/Refuse Yes No Don’t know © 2010 KPMG International. KPMG International is a Swiss cooperative. Member firms of the KPMG network of independent firms are affiliated with KPMG International. KPMG International provides no client services. No member firm has any authority to obligate or bind KPMG International or any other member firm vis-à-vis third parties, nor does KPMG International have any such authority to obligate or bind any member firm. All rights reserved.
  • 12.
    10 KPMG GlobalAuto Executive Survey 2010 Is there automotive overcapacity in Western Europe today? How much? 13.00% 6.50% 37.27% 80.50% 30.43% 18.01% 9.32% 4.97% Yes No 1-10% 11-20% 21-30% 31-40% More DK/Refuse than 40% Yes No Don’t know Is there automotive overcapacity in Japan today? How much? overcapacity Extent of 8.50% 16.50% 35.33% 75.00% 32.00% 17.33% 8.67% 6.67% Yes No 1-10% 11-20% 21-30% 31-40% More DK/Refuse than 40% Yes No Don’t know © 2010 KPMG International. KPMG International is a Swiss cooperative. Member firms of the KPMG network of independent firms are affiliated with KPMG International. KPMG International provides no client services. No member firm has any authority to obligate or bind KPMG International or any other member firm vis-à-vis third parties, nor does KPMG International have any such authority to obligate or bind any member firm. All rights reserved.
  • 13.
    The growth prospect11 Emerging markets are becoming overbuilt Given the high level of expectation of near-term capacities is highest in Russia, revenue growth in the BRICs and the where almost 12 percent of companies high level of expressed intentions to build think that overcapacity is already emerging investment in those economies, the fact and 19 percent believe it will emerge that companies also have strong concerns within two years. over the emergence of automotive overcapacity in the BRICs is striking. However, it is worth noting that it is not irrational for companies to plan investment Companies believe that the automotive in locations where they believe overcapacity industries in both Russia and Brazil will be is emerging: more efficient manufacturers overbuilt in the near to medium term, can always utilize fully their own investments and that China will also have significant and make profits in an overbuilt economy. overcapacity not much later. Concern over When do you expect overcapacity in the BRICs to become a serious issue? • Overcapacity not confined to ‘triad’ • Russia seen as most overbuilt in the short run • Brazil seen as most overbuilt in five year forecast ia il ina ss dia az Ru Ch Br In s 23.24% 24.04% 13.64% 22.62% s 30.68% 30.99% 28.57% 43.27% 43.18% 29.76% 33.10% 27.88% 7.14% 5.63% 6.82% 11.9% 7.04% 2.88% 5.68% 1.92% Now 1-2 years 3-5 years 6-10 years >10 years © 2010 KPMG International. KPMG International is a Swiss cooperative. Member firms of the KPMG network of independent firms are affiliated with KPMG International. KPMG International provides no client services. No member firm has any authority to obligate or bind KPMG International or any other member firm vis-à-vis third parties, nor does KPMG International have any such authority to obligate or bind any member firm. All rights reserved.
  • 14.
    12 KPMG GlobalAuto Executive Survey 2010 Chapter 5: The performance angle Who will best be able to make profits companies believe that higher profits will against this background of falling revenue accrue to companies better able to leverage expectations? Industry expectations of the whole of the supply chain, with higher profitability by company type over the next profits expected of automakers, and the five years are strikingly negative – especially lowest expectation for Tier 3 suppliers. when companies are asked about the On a regional basis, profitability corresponds profitability of their own type of company. roughly to revenue expectations, with the Overall, it is unsurprising that in an era best outlook in ASPAC. expected to be highly competitive How profitable do you think the global automaking, supplier and dealer industries will be over the next five years? • Financial services seen as most profitable • Tier 3 suppliers expected to show lower profitability • Profitability expected to decrease along value chain 40.50% 33.00% 40.50% 44.50% 22.00% 31.50% 34.50% 39.50% 42.50% 36.50% 36.00% 38.50% 40.00% 27.50% 22.50% 18.50% 19.50% 14.50% Automakers Tier 1 Tier 2 Tier 3 Financial Dealers suppliers suppliers suppliers services Increase Stable Decline © 2010 KPMG International. KPMG International is a Swiss cooperative. Member firms of the KPMG network of independent firmsStable Increase Decline are affiliated with KPMG International. KPMG International provides no client services. No member firm has any authority to obligate or bind KPMG International or any other member firm vis-à-vis third parties, nor does KPMG International have any such authority to obligate or bind any member firm. All rights reserved.
  • 15.
    The performance angle13 How profitable do you think the global automaking, supplier and dealer industries will be over the next five years?* • EMEA profitability expectations lowest * Percentage of companies expecting improvements • Across the whole value chain ASPAC expectations highest 51.61% 46.67% 32.26% 30.00% 30.64% 30.00% 27.42% 25.64% 25.81% 23.07% 23.34% 22.58% 21.67% 20.00% 17.95% 13.33% 10.26% 8.97% 8.97% Automakers Tier 1 suppliers Tier 2 suppliers Tier 3 suppliers Financial services Dealers Americas Europe, Middle East and Africa (EMEA) Asia Pacific (ASPAC) © 2010 KPMG International. KPMG International is a Swiss cooperative. Member firms of the KPMG network of independent firms are affiliated with KPMG International. Americas EMEA KPMG International provides no client services. No member firmASPAC authority to obligate or bind KPMG International or any other member firm vis-à-vis third parties, has any nor*does KPMG International have any such authority to obligate or bind any member firm. All rights reserved. Percentage of companies expecting improvement
  • 16.
    14 KPMG GlobalAuto Executive Survey 2010 Executive view: mid-size automaker – US This subsidiary of a Japanese- “Over the last year my confidence level When the cash assistance scheme ended, owned global manufacturer remains has not improved much. Unfavorable sales plummeted. There just isn’t the natural extremely cautious about long-term fundamentals in the market have been with demand in the market. So it is going to be us for some time now, but if anything it is a very difficult 12 months, at least. But we sales and profit prospects. getting harder for people to sustain their are going to have to grow our way out of it. spending. No, I’m not much more confident. Government can’t go on making sales for us. We have cut capacity. Perhaps not as much Growth is the challenge, and that means as we should have done. If it weren’t for investment is the challenge. When you look our contract with the United Auto Workers at the return on a dollar of investment in China we would have done a lot more. We have or in India, and you look at the return in the changed the product mix as well – the old big US, the US does not look attractive. So the SUV products, for example, are just not future is going to be all about operating more viable any more. Our competitive offers now efficiently. We just cannot afford to waste are in compact and crossover vehicles. money on anything inefficient. When we started developing small SUVs people thought we were crazy – but now we The winners from what has happened in are developing crossovers that are even 2009 will be primarily the Korean companies. smaller, and people understand what we are They have the lowest cost of production in doing. These are the cars people want. the US. That means they can profit in this very weak market. But Japanese companies The government assistance scheme in the also have low costs – lower than the US certainly had an impact, although of domestic US makers, even after all the course it was not as great as we might have restructuring. The Japanese also have the hoped. Whether a company benefits from a culture, the camaraderie and the dedication cash assistance program like that depends a on the factory floor. If the domestic US lot on the level of inventory it holds. We gave automakers cannot reproduce that, they up on the strategy of holding high inventory will never prosper.” and waiting for a miracle a long time ago – but when “cash-for-clunkers” came in, we just didn’t have the inventory. The Koreans on the other hand do hold very high inventories, so they had a home run. © 2010 KPMG International. KPMG International is a Swiss cooperative. Member firms of the KPMG network of independent firms are affiliated with KPMG International. KPMG International provides no client services. No member firm has any authority to obligate or bind KPMG International or any other member firm vis-à-vis third parties, nor does KPMG International have any such authority to obligate or bind any member firm. All rights reserved.
  • 17.
    The performance angle 4/Beyond crisis: challenges and opportunities 15 No easy cost savings expected Falling expectations of both revenues and white-collar salaries is higher – this year’s profitability over the next five years imply survey is the first in which companies a continued intense concern with cost-saving have been asked to distinguish between opportunities. Yet in the current survey the wage and salary savings opportunities). overall picture is that company expectations of finding cost-saving opportunities have On a regional basis (results not shown fallen somewhat: in particular, there is less in chart) ASPAC companies are more expectation of finding savings through likely to view new design technologies as a overhead cost-reduction and supply chain cost-saving opportunity. Companies in the innovation, and more interest in Americas are clearly more concerned than implementing advanced IT in design. other regions about salary costs and see There is a low expectation of finding this as a cost opportunity, while European savings through cutting wage costs companies continue to focus more on (the opportunity for making savings in low-cost country sourcing. What are the cost-saving opportunities for auto manufacturers and suppliers?* • Cost focus shifts away from restructuring * Percentage of companies seeing cost-saving opportunities by year • Increasing number of companies believe supply chains are fully optimized • Computer modelling rated sharply higher 67.00% 65.00% 62.00% 61.00% 59.00% 58.00% 57.00% 55.00% 50.00% 48.00% 47.00% 46.00% 46.00% 46.00% 43.00% 43.00% 38.00% 30.50% 29.00% 28.00% 27.00% 23.50% 21.50% x x x x x x x * Percentage of companies seeing cost saving opportunities Product Low-cost Computer Overhead Supply Marketing Tax Salary Wage Health care materials country modeling cost chain and sales efficiency costs costs/direct innovation sourcing reduction management labor 2009 2008 2007 X No data for 2008 X No data for 2007 2009 2008 2007 x No data for 2008 and 2007 © 2010 KPMG International. KPMG International is a Swiss cooperative. Member firms of the KPMG network of independent firms are affiliated with KPMG International. KPMG International provides no client services. No member firm has any authority to obligate or bind KPMG International or any other member firm vis-à-vis third parties, nor does KPMG International have any such authority to obligate or bind any member firm. All rights reserved.
  • 18.
    16 KPMG GlobalAuto Executive Survey 2010 What are the cost-saving opportunities for auto manufacturers and suppliers?* * Percentage of companies seeing • OEMs see higher cost saving opportunities cost-saving opportunities • Materials innovation, computer modeling and low-cost sourcing top opportunities for OEMs • Tier 2 suppliers most likely to cut labor costs • Wage and benefits cost opportunities rated low by most companies 68.83% 66.24% 65.21% 62.34% 60.00% 56.52% 54.00% 51.95% 52.17% 51.00% 47.83% 48.05% 47.00% 45.00% 43.48% 43.48% 42.86% 39.13% 34.78% 33.00% 31.17% 29.00% 26.00% 25.00% 24.67% 23.00% 22.08% 18.19% 17.39% 7.09% Supply Tax Salary costs Wage costs/ Low cost Marketing Product Overhead Computer Healthcare chain efficiency direct labor country and sales materials cost modeling management sourcing innovations reductions No data for 2008, 2007 OEMs Tier 1 suppliers Tier 2 suppliers Tier 1 suppliers OEMs Tier 2 suppliers © 2010 KPMG International. KPMG International is a Swiss cooperative. Member firms of the KPMG network of independent firms are affiliated with KPMG International. KPMG International provides no client services. No member firm has any authority to obligate or bind KPMG International or any other member firm vis-à-vis third parties, nor does KPMG International have any such*authority to obligate or bind any membersaving opportunities Percentage of companies seeing cost firm. All rights reserved.
  • 19.
    The performance angle17 Capital costs to remain high The sudden contraction in late 2008 in the The chart shows company expectations availability of capital for consumers and of improvement. They expect the companies, and the increase in borrowing improvement to be less apparent in costs which remain high despite low policy corporate financing than in consumer interest rates, have been key components financing, and European companies are of the auto business crisis of the last year. most pessimistic about an early return In the current survey, companies were to easy finance. asked for the first time how they expected financial conditions for consumers and companies to evolve. How do you expect financial conditions to evolve in the next 12 months?* • Companies expecting financial improvement outnumber * Percentage of companies expecting improvement those expecting decline • EMEA companies most pessimistic on corporate financing 51.67% 41.94% 37.10% 34.62% 33.87% 33.34% 31.67% 32.06% 30.65% 25.64% 25.00% 14.10% Cost of capital Availability of capital Cost of consumer credit Availability of consumer credit Americas Europe, Middle East and Africa (EMEA) Asia Pacific (ASPAC) Americas EMEA ASPAC © 2010 KPMG International. KPMG International is a Swiss cooperative. Member firms of the KPMG network of independent firms are affiliated with KPMG International. KPMG International provides no client services. No member firm has any authority to obligate or bind KPMG International or any other member firm vis-à-vis third parties, nor does KPMG International have any such authority to obligate or bind any member firm. All rights reserved.
  • 20.
    18 KPMG GlobalAuto Executive Survey 2010 M&A set to grow Perceptions of a continued high level of M&A is also expected in growth markets overcapacity in the face of a diminished as well as in stagnant markets: companies consumer market imply continuing merger believe that the rate of M&A will not only and acquisition activity. The results in the be high in the Americas and Europe, but current survey show that expectations for also in Eastern Europe and in Asia. M&A have risen, marginally, from an Companies appear to be telling us that already high level in the preceding year – M&A may be driven by high growth as although interestingly the one exception to well as by overcapacity in the mature that rising expectation is in the dealer economies. Expectations for Japan are business, where after a year of closure lower, but still highly significant given and rationalization companies now see the historically low rate of M&A activity M&A falling back. in Japan. How will M&A in these types of companies develop over the next five years?* • Expectations of OEM M&A growth stay * Percentage of companies expecting increase at last year’s high levels • Increasing expectation of M&A growth for Tier 2 and Tier 3 suppliers • Only dealer M&A set to fall back 73.50% 72.00% 72.00% 71.00% 70.50% 64.00% 60.00% 56.00% 52.00% 52.00% 49.00% 48.50% 47.00% 43.00% x Automakers Tier 1 suppliers Tier 2 suppliers Tier 3 suppliers Dealers 2009 2008 2007 X No data for 2007 © 2010 KPMG International. KPMG International is a Swiss cooperative. Member firms of the KPMG network of independent firms are affiliated with KPMG International. 2007 2008 x No data for member firm vis-à-vis third parties, KPMG International provides no client services. No member firm has any authority to obligate or bind KPMG International or any other 2007 2009 nor does KPMG International have any such authority to obligate or bind any member firm. All rights reserved.
  • 21.
    The performance angle19 Increase Remain the same Decrease How will M&A in these regions develop over the next five years? • High expectations of Eastern European and Asian M&A • Less than one in ten companies expect M&A to decline anywhere ia ss n) ica Ru pa er Ja pe & Am pe a ing ica ro ric h Eu ro er lud ut Af Eu Am So rn xc & te n (e l& st er rth es n Ea ia st ra pa W No As Ea nt le Ja Ce idd M 8.50% 7.00% 5.00% 5.50% 6.50% 8.00% 28.00% 30.50% 28.00% 7.00% 30.50% 55.00% 57.00% 60.00% 64.00% 64.50% 62.00% 59.00% 35.00% 30.00% 25.50% Increase Stay the same Decline © 2010 KPMG International. KPMG International is a Swiss cooperative. Member firms of the KPMG network of independent firms are affiliated with KPMG International. KPMG International provides no client services. No member firm has any authority to obligate or bind KPMG International or any other member firm vis-à-vis third parties, nor does KPMG International have any such authority to obligate or bind any member firm. All rights reserved.
  • 22.
    20 KPMG GlobalAuto Executive Survey 2010 Debt and technology needs will drive M&A Companies believe that a rising rate of technologies rise in companies’ ratings M&A will be driven partly by crisis factors, of the drivers of M&A, while access to and partly by the long-term imperative of raw materials is seen as less important finding and developing new technology against a background of falling raw material solutions for a changing market (the prices during 2009. Pension and labor continued high stress that companies costs fall further from an already low place upon new technology development position in companies’ ratings of is explored further in chapter 6 of M&A drivers. this survey). So both debt and new What will drive M&A over the next five years? • Indebtedness now seen as top driver of M&A • All cost pressures now seen as less significant 95.00% 89.00% 84.00% 85.00% 82.00% 83.00% 83.00% 80.00% 74.00% 75.00% 73.00% 67.00% 65.00% 55.00% 54.50% 55.00% 53.00% 47.00% 33.00% 30.00% x Debt and risk of Access to new Access to new Raw materials and Labor cost Pension and Potential for bankruptcy technologies and markets and cost pressures pressures health cost product synergies products customers pressures x No data for 2007 2009 2008 2007 X No data for 2007 2009 2008 2007 © 2010 KPMG International. KPMG International is a Swiss cooperative. Member firms of the KPMG network of independent firms are affiliated with KPMG International. KPMG International provides no client services. No member firm has any authority to obligate or bind KPMG International or any other member firm vis-à-vis third parties, nor does KPMG International have any such authority to obligate or bind any member firm. All rights reserved.
  • 23.
    The performance angle21 51.67% What will drive M&A over the next five years from a regional perspective?* * The four largest regional • Americas and EMEA level of global consensus disparities shown on M&A drivers is high • Americas companies more concerned with market access • ASPAC more concerned with raw materials cost pressure 95.00% 90.00% 88.46% 87.18% 83.33% 83.33% 77.42% 72.58% 67.74% 66.13% 51.67% 47.44% Access to new Access to new Raw materials Product synergies technologies markets cost pressure Americas Europe, Middle East and Africa (EMEA) Asia Pacific (ASPAC) EMEA © 2010 KPMG International. KPMG International is a Swiss cooperative. Member firms of the KPMG network of independent firms are affiliated with KPMG International. KPMG International provides no client services. No member firm has any authority to obligate or bind KPMG International or any other member firm vis-à-vis third parties, nor does KPMG International have any such authority to obligate or bind any member firm. All rights reserved.
  • 24.
    22 KPMG GlobalAuto Executive Survey 2010 Chapter 6: Product innovation and consumer change When asked about their long-range Cost reduction has moved slightly lower, But there are differences – ASPAC priorities, automotive companies have and, interestingly, in a reversal of trend companies are markedly more concerned consistently told KPMG’s Global Auto environmental issues are now accorded than others with managing labor, and Executive Survey that their highest-ranking slightly less weight than in last year’s markedly more concerned with product concerns are with new technology and new survey, suggesting that companies believe quality (the proportion of ASPAC products. That remained the case in the they have already made significant companies rating it “very important” current survey: both new products and new environmental advances. Managing labor as against “moderately important” is technologies have moved higher in the relations remains a low priority. high). ASPAC companies are also more ranking of concerns from an already high concerned with pricing, while companies leading position in last year’s survey. Regional results show very similar in the Americas and in Europe prefer to patterns, suggesting as in earlier surveys prioritize total affordability. that the broad shape of priorities remains the same in all regions of the world: auto companies tend to take a global view. How important today are the following issues to the global auto industry?* * Percentage of companies rating • Companies are shifting focus from quality improvement to new products issues as important • Total affordability and pricing seen as less important than innovation • Environment falls in rating for first time in three years 96.00% 89.00% 90.00% 86.00% 84.50% 85.00% 85.00% 83.00% 82.00% 81.00% 80.50% 79.00% 74.50% 72.00% 72.00% 65.00% 64.00% 64.00% 63.00% 62.00% 59.00% 49.50% 49.50% x * Percentage of companies seeing cost saving opportunities Developing Developing new Reducing Meeting Pricing and Improving Improving total Managing labor new products technologies costs environmental sales incentives product quality affordability relations demands 2009 2008 2007 X No data for 2007 2008 2009 2007 x No data for 2007 © 2010 KPMG International. KPMG International is a Swiss cooperative. Member firms of the KPMG network of independent firms are affiliated with KPMG International. KPMG International provides no client services. No member firm has any authority to obligate or bind KPMG International or any other member firm vis-à-vis third parties, nor does KPMG International have any such authority to obligate or bind any member firm. All rights reserved.
  • 25.
    Product innovation andconsumer change 23 How important today are the following issues to the global auto industry?* * The four largest regional • Asian companies least concerned with total affordability, disparities shown most concerned with quality • EMEA companies give low rating to quality improvement • Affordability a leading issue for companies in the Americas C s PA ica AS er Am C PA s ica AS EA er EA 32.26% EM Am EM 45.00% as ic 38.71% C er PA C Am PA AS 33.33% 36.67% 39.74% AS EA s EM ica 30.65% 26.67% er 43.55% Am EA 30.77% EM 28.33% 43.55% 26.92% 32.05% 30.00% 30.65% 28.33% 28.33% 25.81% 24.36% 17.95% 15.00% 11.29% 10.26% Managing labor Improving total Pricing and sales Improving product relations affordability incentives quality Extremely Somewhat Extremely Somewhat © 2010 KPMG International. KPMG International is a Swiss cooperative. Member firms of the KPMG network of independent firms are affiliated with KPMG International. KPMG International provides no client services. No member firm has any authority to obligate or bind KPMG International or any other member firm vis-à-vis third parties, nor does KPMG International have any such authority to obligate or bind any member firm. All rights reserved.
  • 26.
    24 KPMG GlobalAuto Executive Survey 2010 Fuel efficiency and environment top of consumer concerns In qualitative interviews which accompanied In the current survey fuel efficiency and the inclined to rate consumer preferences as the preparation of the current survey, environmental profile of products continue “very important” than are companies in companies repeatedly stated that they to be considered by companies the most other regions. The relatively low priority believe that adaptation to changing significant consumer buying issues. But ascribed to telematics is consistent with consumer demand will be an important on a regional basis it is clear that consumer results last year – globally, telematics key to survival in the coming five years. concerns are believed to differ: the high received the highest number of “not The survey questions on drivers of rating accorded to safety is due to ASPAC important” scores. Overall, the efficiency consumer buying give an insight into companies citing this issue – and on of vehicles is believed to dominate just how companies will do that. all issues ASPAC companies are more consumer concerns. How important are these product issues to consumer purchase decisions over the next five years?* * Percentage of companies rating issues as • Fuel efficiency top concern over last three years important (the top three issues shown) • Companies think consumer concerns on environment continue to rise 96.00% 93.50% 84.00% 80.50% 70.00% 71.00% 72.00% 65.00% 50.00% Fuel efficiency Environmental Safety innovation friendliness 2007 2009 2008 2008 2009 2007 © 2010 KPMG International. KPMG International is a Swiss cooperative. Member firms of of companies ratingof independent firms are affiliated with KPMG International. *Percentage the KPMG network issue as important KPMG International provides no client services. No member firm has any authority to obligate or bind KPMG International or any other member firm vis-à-vis third parties, nor does KPMG International have any such authority to obligate or bind any member firm. All rights reserved.
  • 27.
    Product innovation andconsumer change 25 How important are these product issues to consumer purchase decisions over the next five years?* * Percentage of companies rating • Asian companies now rate styling, comfort and safety significantly higher than others issues as important • Asian companies also most likely to rate environment as top consumer concern • Fuel efficiency for all regions most important 95.00% 93.55% 92.31% 83.87% 80.77% 79.03% 76.67% 74.19% 70.00% 67.75% 65.39% 58.98% 56.45% 56.67% 50.00% 50.00% 45.00% 44.87% 40.00% 35.90% 33.33% Safety innovation Environmental Ergonomics Fuel efficiency Enhanced vehicle Telematics/ Vehicle styling friendliness and comfort lifespan personal assistance services Americas Europe, Middle East and Africa (EMEA) Asia Pacific (ASPAC) Americas EMEA ASPAC © 2010 KPMG International. KPMG International is a Swiss cooperative.important firms of the KPMG network of independent firms are affiliated with KPMG International. * Percentage of companies rating issue as Member KPMG International provides no client services. No member firm has any authority to obligate or bind KPMG International or any other member firm vis-à-vis third parties, nor does KPMG International have any such authority to obligate or bind any member firm. All rights reserved.
  • 28.
    26 KPMG GlobalAuto Executive Survey 2010 Low-cost producers to win most market share Company expectations of market Two significant winners emerge Both Mercedes and BMW are also seen share gain and loss have changed in in year-on-year comparisons: as better placed to win market share, both significant ways. Chinese and Indian Hyundai/Kia is one – a result that may companies having defied expectations of brands remain in the top three places in reflect the success of Korean automakers a collapse of premium vehicle sales. terms of expectation of market share in profiting from government sales gain, but conviction is slightly lower subsidies during 2009 – and VW is the than in last year’s survey. Both Toyota second. Market share gain expectations and Honda are expected to win market for the big three US makers remain low share at a lower rate than in previous and Chrysler has fallen further, although years, and there has been a fall in Fiat, now the key actor in Chrysler’s expectation for Russian brands. Overall immediate future, is rated higher in terms we note that the top six rated companies of market share prospects than in the have either very strong cost or product previous year. advantages, or both. How will market share by company change in the next five years? • Low cost makers in top three places • Toyota and Honda fall in ratings for first time in three years • VW seen as strongest European OEM, Ford as strongest US OEM n s oe an or ds ss ot itr en ds an ia ds lM t/C i s /N ag de i/K an br an i eo r ult ish sw ra sle ce br da a se a W br uji ot ne ug na rd nd ub lk er un ry n ine t BM y u/F ian Fo Fia Ge Re Pe dia Vo Ho To M Ch its Hy Ch ss ar In M b Ru Su 6.50% 11.00% 10.00% 25.00% 15.00% 11.50% 26.00% 15.00% 27.50% 68.00% 72.50% 5.00% 10.50% 9.50% 42.50% 22.50% 35.00% 31.50% 13.00% 13.00% 14.50% 30.50% 36.50% 56.50% 49.00% 57.00% 78.50% 73.50% 72.50% 32.50% 44.00% 70.00% 53.50% 45.50% 38.00% 57.00% 37.50% 51.50% 40.50% 34.50% 30.50% 17.50% 29.00% 26.50% 18.00% 20.50% 17.50% 16.00% 16.00% 13.00% 7.50% Increase Stay the same Decrease © 2010 KPMG International. KPMG International is a Swiss cooperative. Member firms of the KPMG network of independent firms are affiliated with KPMG International. KPMG International provides no client services. No member firm has any authority to obligate or bind KPMG International or any other member firm vis-à-vis third parties, nor does KPMG International have any such authority to obligate or bind any member firm. All rights reserved. Increase Remain the same Decrease
  • 29.
    Product innovation andconsumer change 27 Expectations of the performance of sales by vehicle type show a remarkable degree of consensus: companies in all three global regions cite exactly the same three vehicle types as top performers (hybrids, other alternative fuel vehicles and low-cost introduction cars). Expectations of declining sales performance are perhaps not surprisingly focused on larger and more inefficient vehicles, although it is notable that companies in the Americas do not cite luxury vehicles in their “bottom three”. How will sales by vehicle type change in the next five years?* * Regional best and worst performers • Hybrids, alternative fuel and low cost vehicles lead in all regions • Inefficient vehicles to lose most sales les les les hic hic hic rs rs rs ca ca ca ve ve ve ion ion ion el el el les les les fu fu fu ct ct ct du du hic hic du ive ive ive hic les les ro ro ro ps ps ve ve ps at ps at at ve hic hic int int int rn rn rn ku ku ku ku el el el lte ve lte ve lte st st pic pic fu fu st ns pic pic fu -co -co ra -co ra ra ry va ry id id id Vs e e e Vs all xu he xu br br he he rg w rg w ini br w rg SU Sm SU Hy Hy Lo Lu Lo La La Lu Lo Hy Ot La Ot M Ot 1.67% 1.28% 1.28% 1.61% 3.33% 3.23% 5.00% 5.13% 3.23% 68.33% 60.00% 45.00% 7.69% 16.67% 62.82% 60.00% 35.90% 10.00% 4.84% 17.74% 14.52% 32.26% 32.26% 24.19% 95.00% 10.00% 12.82% 91.03% 91.94% 88.33% 85.00% 82.05% 80.77% 79.03% 80.65% 27.42% 45.16% 37.10% 44.87% 38.33% 30.77% 48.39% 23.33% 24.36% 23.33% 29.03% 22.58% 16.75% 19.23% 19.23% 16.67% 12.82% 8.33% Americas EMEA ASPAC Americas EMEA ASPAC Best Worst Best Worst Best Worst Increase Stay the same Decrease © 2010 KPMG International. KPMG International is a Swiss cooperative. Member firms of the KPMG network of independent firms are affiliated with KPMG International. Increase Remain same Decrease KPMG International provides no client services. No member firm has any authority to obligate or bind KPMG International or any other member firm vis-à-vis third parties, nor does KPMG International have any such authority to obligate or bind any member firm. All rights reserved.
  • 30.
    28 KPMG GlobalAuto Executive Survey 2010 Hybrid technology rated clear leader The primary importance that companies survey responses, and battery and ascribe to vehicle efficiency and the fuel-cell approaches are ascribed almost further development of alternative equal priority. Regional views of other propulsion technologies is already alternatives are clearly influenced by apparent from earlier questions in the regional issues, particularly the extent of current survey, as well as from the installed fuel infrastructure; accordingly, growing emphasis on these developments ethanol is rated low priority by EMEA in year-on-year responses despite companies, while LPG is considered relatively low sales (see next page). considerably less important in the Electric power ranks only just behind Americas than elsewhere. hybrid power developments in the current How important are these alternative fuel technologies over the next five years?* *Percentage of companies rating • Strong global consensus on importance of hybrids and electric technologies technologies as important • ASPAC companies rate solar power much higher than other regions 85.90% 85.00% 82.26% 68.34% 67.95% 67.74% 64.52% 63.34% 61.54% 61.29% 46.78% 46.67% 41.66% 41.94% 40.33% 34.62% 34.61% 23.07% 20.51% 20.00% 18.34% Fuel-cell electric Battery electric Ethanol Biodiesel LPG/LNG Hybrid fuel Solar power power power systems Americas Europe, Middle East and Africa (EMEA) Asia Pacific (ASPAC) Americas © 2010 KPMG International. KPMG International is a Swiss cooperative. Member firms of the KPMG network of independent firms are affiliated with KPMG International. EMEA ASPAC KPMG International provides no client services. No member firm has any authority to obligate or bind KPMG International or any other member firm vis-à-vis third parties, nor does KPMG International have any such authority to obligate or bind any member firm. All rights reserved. * Percentage of companies rating technologies important
  • 31.
    Product innovation andconsumer change 29 How many alternative fuel vehicles (not including hybrids) will be sold in 2010?* *2008 sales approximately 1.5 million 11.50% 7.69% 19.35% 10.00% 1.28% 1.61% 17.95% 6.67% 7.69% 16.13% 13.33% 25.64% 24.19% 38.71% 55.00% 39.74% Americas EMEA ASPAC <1 million 1-1.5 million 1.5-2 million 2-2.5 million >2.5 million Don’t know How many hybrid vehicles will be sold in 2010?* Fewer than 1 million 1 - 1.5 million 1.5 - 2 million *2008 sales approximately 780,000 2 - 2.5 million More than 2.5 million Don’t know Americas EMEA ASPAC 16.67% 12.82% 8.97% 1.67% 24.19% 1.61% 10.00% 10.26% 37.10% 43.33% 29.49% 17.74% 28.33% 38.46% 19.34% * 2008 sales approximately 780,000 Americas EMEA ASPAC <750,000 750,000-1 million 1-1.25 million 1.25-1.5 million >1.5 million Don’t know © 2010 KPMG International. KPMG International is a Swiss cooperative. Member firms of the KPMG network of independent1firms are affiliated with KPMG International. Fewer than 750,000 750,000 - million KPMG International provides no client services. No member firm has any authority to obligate or bind KPMG International or any other member firm vis-à-vis third parties, nor does KPMG International have any such authority to obligate or bind any member firm. All rights reserved. Greater than 1 million - 1.25 million Greater 1.25 million - 1.5 million
  • 32.
    30 KPMG GlobalAuto Executive Survey 2010 Executive view: large Tier 1 supplier – US This large US supplier believes that “I am a little bit more optimistic than I was a Overall the industry still needs to cut the industry has made progress year ago, but there are a lot of uncertainties. capacity. It is much easier to cut capacity in 2009, but that more needs to in the US than it is in Europe, and that is The US is only going to sell around 10 million one reason why the big three have all cut be done. cars this year. Whether the recovery we’ve capacity in the US. That is something they seen during the second half of the year still have to do in Europe. The carmakers is sustainable in 2010 is uncertain: will all need to continue moving European the economy has not bottomed yet, and production to the East to cut costs, and unemployment is still rising. Elsewhere, they will need to cut their production in China is still growing, although that bubble Western Europe because there just won’t may burst. India still has huge potential, be the sales for those plants. although whether consumers have the money to buy cars in volume we don’t yet I think the biggest winner over the last know. And Europe I think may have a more year has been General Motors. And it has difficult time next year than this, once the a pretty good model line-up now. As for ending of the government incentive the others, Ford has had to borrow money schemes hits home. But South America and that has damaged their finances. will grow, and especially Brazil will grow. Chrysler still has to be turned around, and it’s an open question whether Fiat can My sense is that in the US people still do achieve that. I think European makers will not understand how things are changing. suffer unless they can find more ways to The automakers are very busy developing cut costs. Even Toyota has seen a fall in smaller cars, but whether they are going US market share for the first time. Almost to sell them to the US consumer is another everyone has suffered in some way. matter: the mindset is not there, not yet. For the US the question is all about demand. We are working with a number of The potential for selling 16 or 17 million companies on electric cars, hybrid-cars cars a year is there – the demographics and super-economical vehicles. I think the are there. The only question is, will people pure electric car as a mass-market product have the money to buy those cars? I don’t is ten years away at least. For now, plug-in know the answer to that.” hybrids have more potential. But in both cases the economics of the vehicles are unfavorable. For example, we are working on a small electric vehicle, but it will still have to cost around $40,000 – that’s an expensive car. Even with hybrids, if you do the math then they don’t really make sense. People don’t buy them for economic reasons, because as things stand you will never get your money back in fuel savings. It is hard to see that as a mass market proposition. © 2010 KPMG International. KPMG International is a Swiss cooperative. Member firms of the KPMG network of independent firms are affiliated with KPMG International. KPMG International provides no client services. No member firm has any authority to obligate or bind KPMG International or any other member firm vis-à-vis third parties, nor does KPMG International have any such authority to obligate or bind any member firm. All rights reserved.
  • 33.
    Product innovation andconsumer change 31 R&D will win most investment When companies were asked where they to invest, reflecting the concern of many border dealer expansion will be muted, would direct investment capital, while new Tier 2 suppliers (supported by the results especially in the Americas and in EMEA. technology and new model development on profitability earlier in this survey) that We also note companies’ expectation of remained top priorities, companies also they need to invest to raise profitability. significant IT and training investment in said they would spend more on marketing the dealer industry; this reinforces results – but less on logistics and much less on The responses on dealer investment from KPMG’s study of the global dealer new plants. The pattern of investment represent the views of manufacturers on industry published in early 2009, which intentions for suppliers remains the same dealer businesses (dealers themselves found that dealers themselves believe as in last year’s survey, but for suppliers were not participants in the survey). that the industry suffers from an IT and too the reduction in expectation of new Companies believed that ASPAC dealers training deficit. plant building is striking. Tier 2 suppliers will have a higher propensity to invest, are expected to show a higher propensity and believed that domestic and cross- Do you expect manufacturers to increase their investment over the next two years?* * Positive responses from • Investment growth expectations of OEMs fall slightly manufacturers only year-on-year • Expectations of investment growth in innovation remain high 93.00% 93.51% 93.00% 85.71% 55.84% 53.00% 49.00% 45.00% 44.16% 25.97% New plants New models/ New Marketing and Logistics/ products technologies advertising distribution 2009 2008 © 2010 KPMG International. KPMG International is a Swiss cooperative. Member firms of the KPMG network of independent firms are affiliated with KPMG International. KPMG International provides no client services. No member firm has any authority to obligate or bind KPMG International or any other member firm vis-à-vis third parties, nor does KPMG International have any such authority to obligate or bind any member firm. All rights reserved.
  • 34.
    32 KPMG GlobalAuto Executive Survey 2010 Do you expect suppliers to increase their investment over the next two years?* * Positive responses from suppliers only. 2008 results include • Supplier expectations of innovation investment have grown some responses from Tier 3 suppliers • Investment growth in new plants to fall by almost half • Tier 2 suppliers expect to increase investments in marketing and advertising r r r r lie lie lie lie pp pp pp pp r r r r lie lie lie lie su su su su pp pp pp pp 1 1 2 2 su su su su r r r r Tie Tie Tie Tie 1 1 2 2 r r r r Tie Tie Tie Tie r r r r lie lie lie lie pp pp pp pp su su su su 95.65% 100.00% 1 1 2 2 r r r r Tie Tie Tie Tie 93.00% r r r r 93.00% lie lie lie lie 89.00% 91.00% 91.00% pp pp pp pp 88.00% su su su su 82.61% 1 1 2 2 r r r r lie lie lie lie r r r r Tie Tie Tie Tie pp pp pp pp su su su su 1 1 2 2 r r r r Tie Tie Tie Tie 70.00% 64.00% 64.00% 62.00% 59.00% 59.00% 57.00% 47.83% 44.00% 32.00% 30.43% New plants New models/ New Marketing and Logistics/ products technologies advertising distribution 2009 2008 © 2010 KPMG International. KPMG International is a Swiss cooperative. Member firms of the KPMG network of independent firms are affiliated with KPMG International. KPMG International provides no client services. No member firm has any authority to obligate or bind KPMG International or any other member firm vis-à-vis third parties, nor does KPMG International have any such authority to obligate or bind any member firm. All rights reserved.
  • 35.
    Product innovation andconsumer change 33 Do you expect dealers to increase their investment over the next two years?* * Results from manufacturers and suppliers • ASPAC companies see HR deficit as significant dealer issue • All regions expect dealers to improve IT 22.58% 60.00% s EA C 47.44% ica PA EM 53.85% er AS s EA C ica Am PA EM er AS Am 77.42% 72.58% 66.67% s EA C ica PA EM s EA C er AS ica PA Am EM er AS Am 51.28% 46.77% 46.15% 43.55% 38.46% 38.33% 35.90% 31.67% 25.00% Domestic expansion Cross-border expansion IT systems and HR training and acquisitions and acquisitions communication Yes Yes No © 2010 KPMG International. KPMG International is a Swiss cooperative. Member firms of the KPMG network of independent firms are affiliated with KPMG International. KPMG International provides no client services. No member firm has any authority to obligate or bind KPMG International or any other member firm vis-à-vis third parties, nor does KPMG International have any such authority to obligate or bind any member firm. All rights reserved.
  • 36.
    34 KPMG GlobalAuto Executive Survey 2010 Chapter 7: Investing in new markets Companies are nearly unanimous in reflect companies’ revenue expectations: expecting emerging markets to build most the strongest expectations are for revenues automotive capacity and to provide the from China although a very small minority most growth in automotive revenues. The of companies envisage revenue decline in majority of companies say they intend to China. In India many more companies see increase their investments in the BRICs moderate growth than see strong growth, (Brazil, Russia, India and China). although no companies at all envisage revenue falls. Moderate rather than strong Of companies with existing investments in growth is also the majority expectation for the BRICs, most say they will increase the Brazil. Russia is the outlier – while more value of those investments (the number of than half of all investors have expectations companies with existing investments that of moderate or strong growth, a significant say they have no plans to change their level minority now anticipate a fall in revenues of investment is negligible). Those results over five years. North America (ie US & Canada) Over the next five years which Western Europe Japan region of the world or country do you think will build the most Eastern Europe & Russia Asia excluding Japan Centra Middle East & Africa manufacturing capacity? Don’t know 2.50% 2.50% 1.00% 6.50% 1.00% 3.00% 10.00% 73.50% North America (US & Canada) Western Europe Japan Eastern Europe and Russia Asia (excluding Japan) Central & South America Middle East & Africa Don’t know © 2010 KPMG International. KPMG International is a Swiss cooperative. Member firms of the KPMG network of independent firms are affiliated with KPMG International. KPMG International provides no client services. No member firm has any authority to obligate or bind KPMG International or any other member firm vis-à-vis third parties, nor does KPMG International have any such authority to obligate or bind any member firm. All rights reserved.
  • 37.
    Investing in newmarkets 35 Do you plan to increase or decrease your investment What are your revenue forecasts for the in the BRICs? BRICs? • Existing BRIC investors will increase • India and China seen as biggest growth markets exposure • Significant minority see Russian decline • Reduction of investment negligible ia ina il ss dia az now Ru Ch Br In ina 1.14% 2.38% Ch 2.82% 0.70% 3.41% 16.35% 15.48% te decline 2.00% 7.75% 29.55% 58.50% 46.48% 53.85% 25.00% dia In /stable ia ss Ru 53.41% 43.00% 0.50% il 41.67% az Br te improvement 2.00% 35.00% 42.25% 26.00% mprovement 29.81% 15.48% 12.50% Increase Decrease Strong improvement Moderate improvement Neutral/stable Moderate decline Don’t know © 2010 KPMG International. KPMG International is a Swiss cooperative. Member firms of the KPMG network of independent firms are affiliated with KPMG International. KPMG International provides no client services. No member firm has any authority to obligate or bind KPMG International or any other member firm vis-à-vis third parties, nor does KPMG International have any such authority to obligate or bind any member firm. All rights reserved.
  • 38.
    36 KPMG GlobalAuto Executive Survey 2010 Executive view: diversified supplier – emerging market This India-focused supplier, part “I am almost 100 percent more confident As we go into 2010 I can see a lot of M&A of a group with sales of over half than I was at this time last year, and I am opportunities. Many companies outside a billion US dollars and over 6,000 especially confident about the Indian market. of Asia are not in good shape, and we may be able to buy them cheaply. The limiting employees, says that automotive The crisis certainly had a very negative factor is financing: banks have cut lending, demand in emerging markets is effect on many of our customers. We saw and we will have to rely on internal sources set to grow at breakneck speed. the worst effects in the commercial of capital. vehicle market. Vehicle usage was down, demand for new vehicles was down, and We would look for market share and for it was very difficult for companies to technology. In commercial vehicles, for finance new purchases. Private passenger example, we have the market share, but car demand held up better: personal we are concerned that we don’t have finances were more resilient than future technology. For passenger cars company finances. we need market share. We have cut output, but we did that by For the next five years our biggest reducing staffing, a cut of somewhere challenges are going to be dealing with between 20-30 percent. We have not a growing market. We have two or three closed any facilities. And in the last main competitors in India, and we need quarter of 2009 we stopped cutting to maintain market share as the market manpower. It is quite likely that by the end grows. A key will be winning business of the first quarter of 2010 all those job from the world’s main OEMs as they cuts will be reversed. invest more in India.” We have also cut costs by reducing the number of processes we outsource, things like powder coating and machining. Our strategy has been to increase the amount of value we add in-house. © 2010 KPMG International. KPMG International is a Swiss cooperative. Member firms of the KPMG network of independent firms are affiliated with KPMG International. KPMG International provides no client services. No member firm has any authority to obligate or bind KPMG International or any other member firm vis-à-vis third parties, nor does KPMG International have any such authority to obligate or bind any member firm. All rights reserved.
  • 39.
    Investing in newmarkets 37 BRIC sales forecasts continue to grow In previous editions of this survey, When will China sell a significant number (1 million+ a year) companies were asked to give specific of cars in other markets? forecasts of domestic unit sales growth ranges and export sales in China in five • Expectations of Chinese exports improve after falling last year years’ time: the current survey extended 2009 2008 these questions to all of the BRIC markets. 28.90% 36.00% Expectations for both domestic and export Chinese sales have increased. There has been an increase in expectation for the higher ranges of domestic sales to be achieved by 2014, except in the extreme high range of 18 million plus: we believe this indicates both a growth in optimism on and knowledge of 71.10% 64.00% the Chinese market on the part of companies. The proportion of companies expecting export sales to pass one million within five years has also increased. 2009 2008 Within 5 years Beyond 5 years What do you estimate will be the annual volume of unit sales in China by 2014?* *2008 sales approximately 9.4 million cars and commercial vehicles 42.25% 30.00% 20.42% 20.00% 20.00% 13.38% 10.56% 10.00% 10.00% 10.00% 9.15% 1.41% <10 million 10-12 million 12-14 million 14-16 million 16-18 million >18 million 2009 2008 © 2010 KPMG International. KPMG International is a Swiss cooperative. Member firms of the KPMG network of independent firms are affiliated with KPMG International. KPMG International provides no client services. No member firm has any authority to obligate or bind KPMG International or any other member firm vis-à-vis third parties, nor does KPMG International have any such authority to obligate or bind any member firm. All rights reserved.
  • 40.
    38 KPMG GlobalAuto Executive Survey 2010 The consensus views of companies on It should also be noted that investment sales in Brazil, India and Russia are also intentions noted elsewhere in this strikingly strong. Expectations of sales survey for India in particular do not seem volumes in India are equivalent to a commensurate with sales expectations, consensus that growth of 17 percent will suggesting that companies may be be achieved annually. The consensus is for expecting to sell in India a significant growth of around 30 percent over five proportion of vehicles manufactured years in Brazil, and of around 40 percent elsewhere. over five years in Russia (although it should be noted that a significant minority think Russian sales will be flat or even fall). What do you estimate will be the annual What do you estimate will be the annual volume of unit sales in India in 2014?* volume of unit sales in Brazil in 2014?* *2008 sales approximately 2.3 million cars and commercial vehicles *2008 sales approximately 3.2 million cars and commercial vehicles 47.73% 47.12% 36.36% 25.96% 15.38% 11.54% 9.09% 4.55% 2-3 million 3-4 million 3-4 million 4-5 million 4-5 million >5 million 5-6 million >6 million © 2010 KPMG International. KPMG International is a Swiss cooperative. Member firms of the KPMG network of independent firms are affiliated with KPMG International. *2008 sales approximately 2.3 million services. commercial vehicles any authority to obligate or bind KPMG International or any other member firm vis-à-vis third parties, KPMG International provides no client cars and No member firm has nor does KPMG International have any such authority to obligate or bind any member firm. All rights reserved.
  • 41.
    Investing in newmarkets 39 China Expectations for the achievement of be achieved by Brazil within the five-year 31.50% export sales of over one million rank in horizon. However companies do not order India, Brazil and Russia. Over 50 believe that Russia is in that league: 2.82% percent of companies think that level will almost two thirds of companies believe be achieved by India within five years, and Russia will not sell more than one million 29.81% 42.25% over 45 percent of companies think it will cars outside its borders within five years. 53.85% 46.48% When will Brazil, Russia and India What do you estimate will be the annual sell a significant number (1 million + volume of unit sales in Russia in 2014?* a year) of cars in other markets? 16.35% 0.70% 3 *2008 sales approximately 2.8 million cars and commercial vehicles 7.75% ia il ss dia az Ru Br In Beyond 5 years 47.12% 54.55% 63.10% 42.86% Within 5 years 32.14% 52.88% 45.45% 36.90% 15.47% 7.14% 2-3 million 3-4 million Within 5 years Beyond 5 years 4-5 million >5 million © 2010 KPMG International. KPMG International is a Swiss cooperative. Member firms of the KPMG network of independent firms are affiliated with KPMG International. KPMG International provides no client services. No member firm has any authority to obligate or bind KPMG International or any other member firm vis-à-vis third parties, nor does KPMG International have any such authority to obligate or bind any member firm. All rights reserved.
  • 42.
    40 KPMG GlobalAuto Executive Survey 2010 Smaller emerging markets to gain For companies looking for new growth and EMEA companies on the latter. markets, the BRICs are no longer the only However, ASPAC companies are shown game in town. Companies in KPMG’s to be considerably more interested in Global Auto Executive Survey say they Africa than any others, reflecting Asian expect growth and auto investment in companies’ long-standing willingness to many other growing economies, with the invest in economies that others may see strongest expectations for Southeast Asia as marginal. Companies in both EMEA and and for Eastern Europe, with ASPAC the Americas are more likely to expect companies most focused on the former investment in the Middle East. Not counting the BRICs which regions will attract most auto industry investment over the next five years? • For all regions expectations of South East Asian investment highest Americas EMEA ASPAC 35.00% 41.03% 22.58% 35.00% 6.67% 39.74% 6.41% 12.9% 23.33% 10.26% 51.61% 4.84% 1.61% Americas EMEA ASPAC Eastern Europe including Ukraine Central and South America including Mexico Middle East including North Africa Africa excluding North Africa Southeast Asia Eastern Europe including Ukraine Central and South America including Mexico © 2010 KPMG International. KPMG International is a Swiss cooperative. Member firms of the KPMG network of independent firms are affiliated with KPMG International. KPMG International provides no client services. No member firm has any authority to obligate or bind KPMG International or any other member firm vis-à-vis third parties, nor does KPMG International have any such including North Africa Middle East authority to obligate or bind any member firm. All rights reserved. Africa excluding North Africa
  • 43.
    Investing in newmarkets 41 It is striking that when asked which Malaysia over Thailand, and ASPAC individual countries outside the BRICs will companies prefer Vietnam slightly over attract auto investment in the coming five Malaysia). In the Middle East Morocco was years there are clear winners: Ukraine is the clear leader in investment expectations, seen as the outstanding East European albeit on a low base of companies responding. destination (although on regional basis In South and Central America, Mexico Americas and EMEA favor Poland); Thailand emerges – unsurprisingly given its is the outstanding destination in Southeast significance as a manufacturing base for US Asia (although on a regional basis both companies – as the outstanding destination. ASPAC and EMEA companies prefer Which emerging economies will attract most auto investment over the next five years?* *Top five investment destinations • Biggest existing manufacturing countries to attract most new investment ico ex M 71.05% d an ine ail ra Th Uk ia ys ala m 34.68% M d na 33.00% lan ina et ia Po an nt Vi c ge m bli Ro Ar pu sia 25.81% Re ne 22.00% 22.58% do h y ec ar In ng Cz 18.00% 18.42% es Hu ile la pin ue Ch ilip ez ia 12.1% liv Ph n Ve Bo 10.00% 8.00% 6.58% 3.23% 1.32% 2.63% Eastern Europe Southeast Asia Central and South America South East Asia Eastern Europe Central & Sth America © 2010 KPMG International. KPMG International is a Swiss cooperative. Member firms of the KPMG network of independent firms are affiliated with KPMG International. KPMG International provides no client services. No member firm has any authority to obligate or bind KPMG International or any other member firm vis-à-vis third parties, nor does KPMG International have any such authority to obligate or bind any member firm. All rights reserved.
  • 44.
    kpmg.com Global Automotive contacts Regional Automotive contacts Dieter Becker ASPAC Global Chair, Automotive Chang Soo Lee KPMG ELLP Samjong KPMG in Korea T: +49 711 9060 41720 T: +82 (2) 2112 0600 E: dieterbecker@kpmg.com E: changsoolee@kr.kpmg.com Stephanie Goering The Americas Global Executive, Automotive Gary Silberg KPMG ELLP KPMG in the US T: +49 711 9060 41271 T: +1 312 665 1916 E: sgoering@kpmg.com E: gsilberg@kpmg.com EMA Dieter Becker KPMG ELLP T: +49 711 9060 41720 E: dieterbecker@kpmg.com The information contained herein is of a general nature and is not intended to address the circumstances of any particular © 2010 KPMG International Cooperative (“KPMG individual or entity. Although we endeavor to provide accurate and timely information, there can be no guarantee that such International”), a Swiss entity. Member firms of the KPMG information is accurate as of the date it is received or that it will continue to be accurate in the future. No one should act upon network of independent firms are affiliated with KPMG such information without appropriate professional advice after a thorough examination of the particular situation. International. KPMG International provides no client services. No member firm has any authority to obligate or bind KPMG The views and opinions expressed herein are those of the interviewees and do not necessarily represent the views and International or any other member firm vis-à-vis third parties, opinions of KPMG International or KPMG member firms. nor does KPMG International have any such authority to obligate or bind any member firm. All rights reserved. KPMG and the KPMG logo are registered trademarks of KPMG International Cooperative (“KPMG International”), a Swiss entity. Designed by Roundel Publication name: KPMG’s Global Auto Executive Survey 2010 Publication number: 912007 Publication date: December 2009 Printed on recycled material