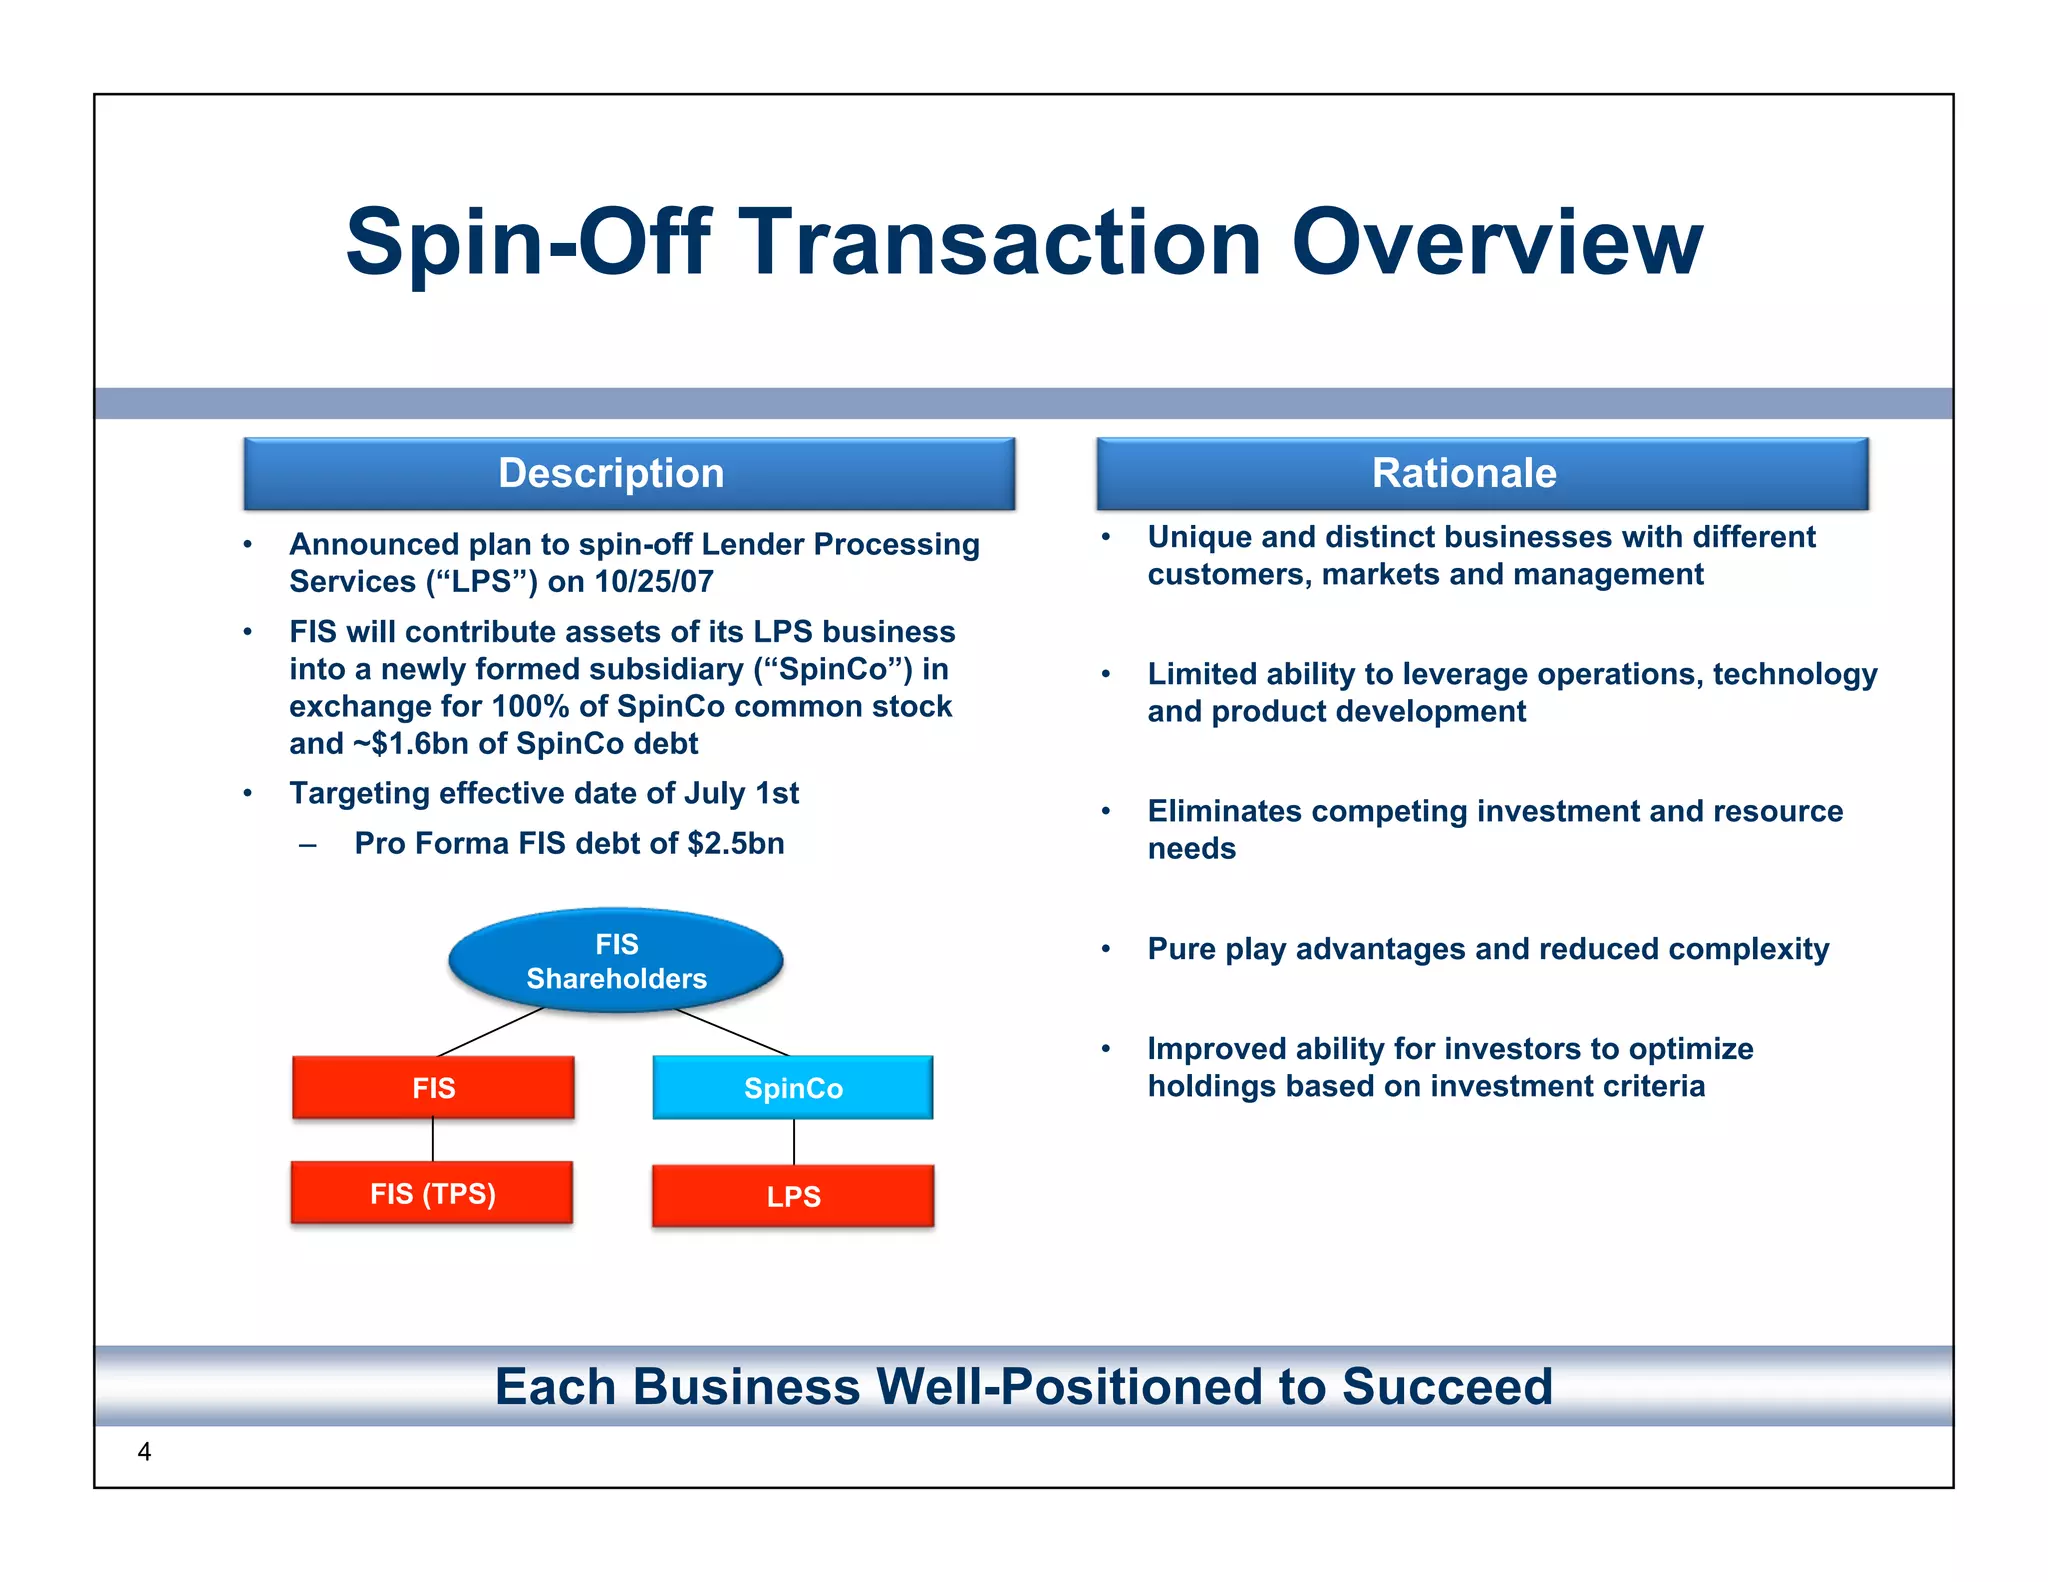
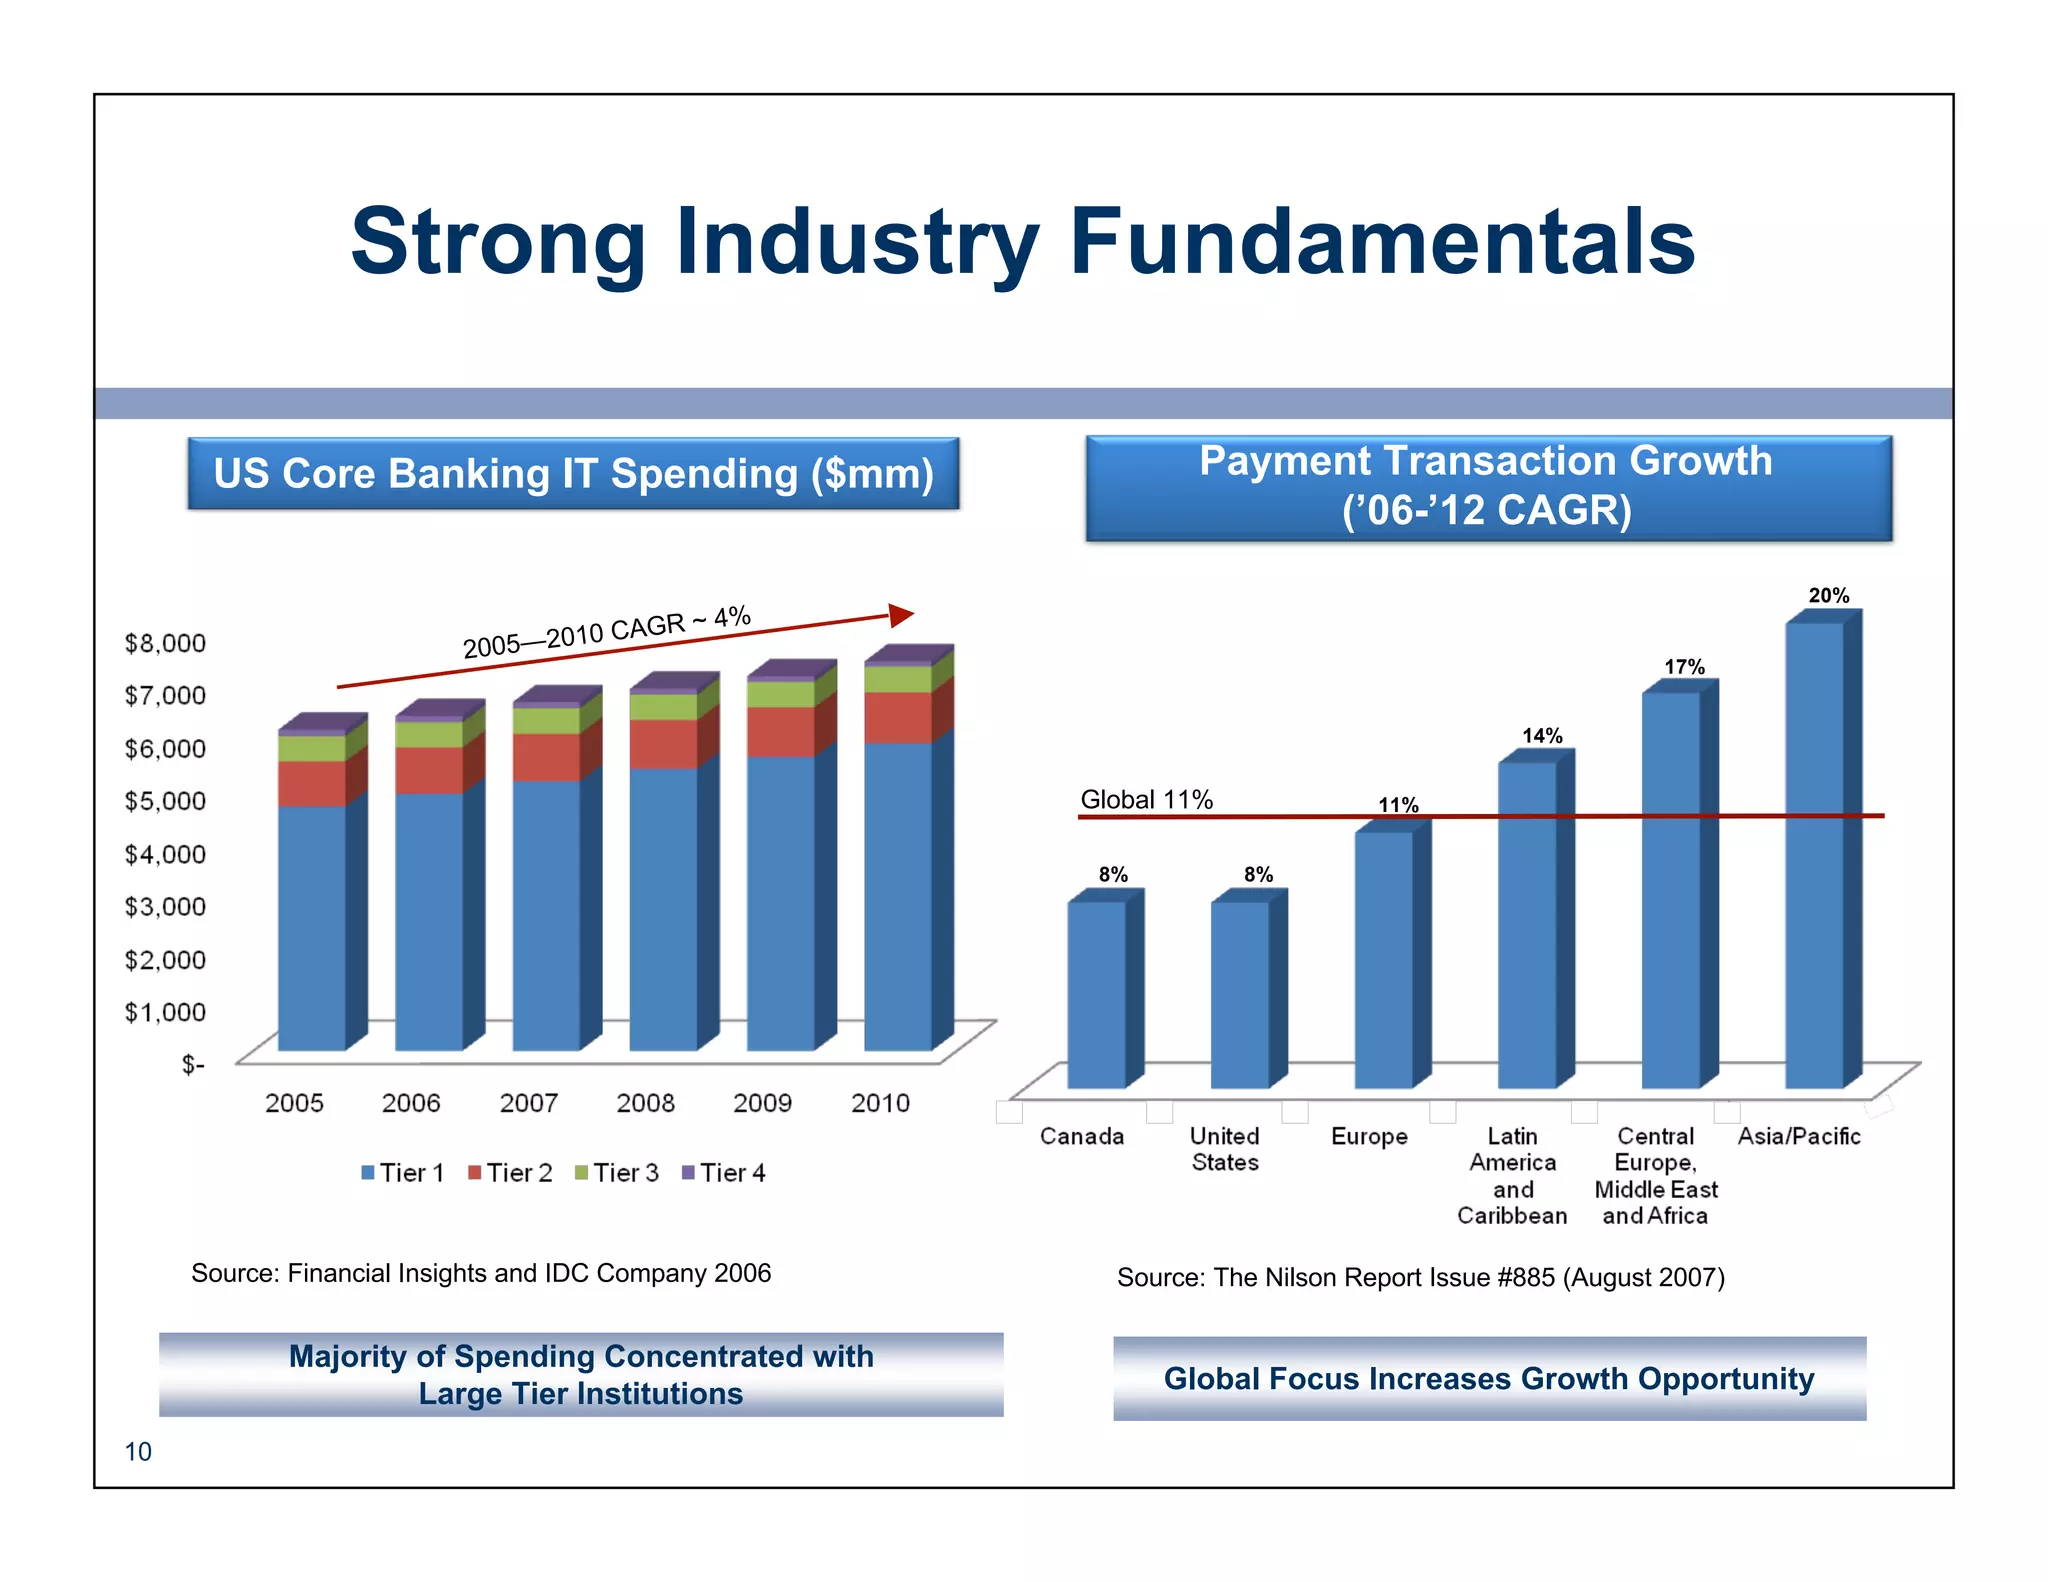
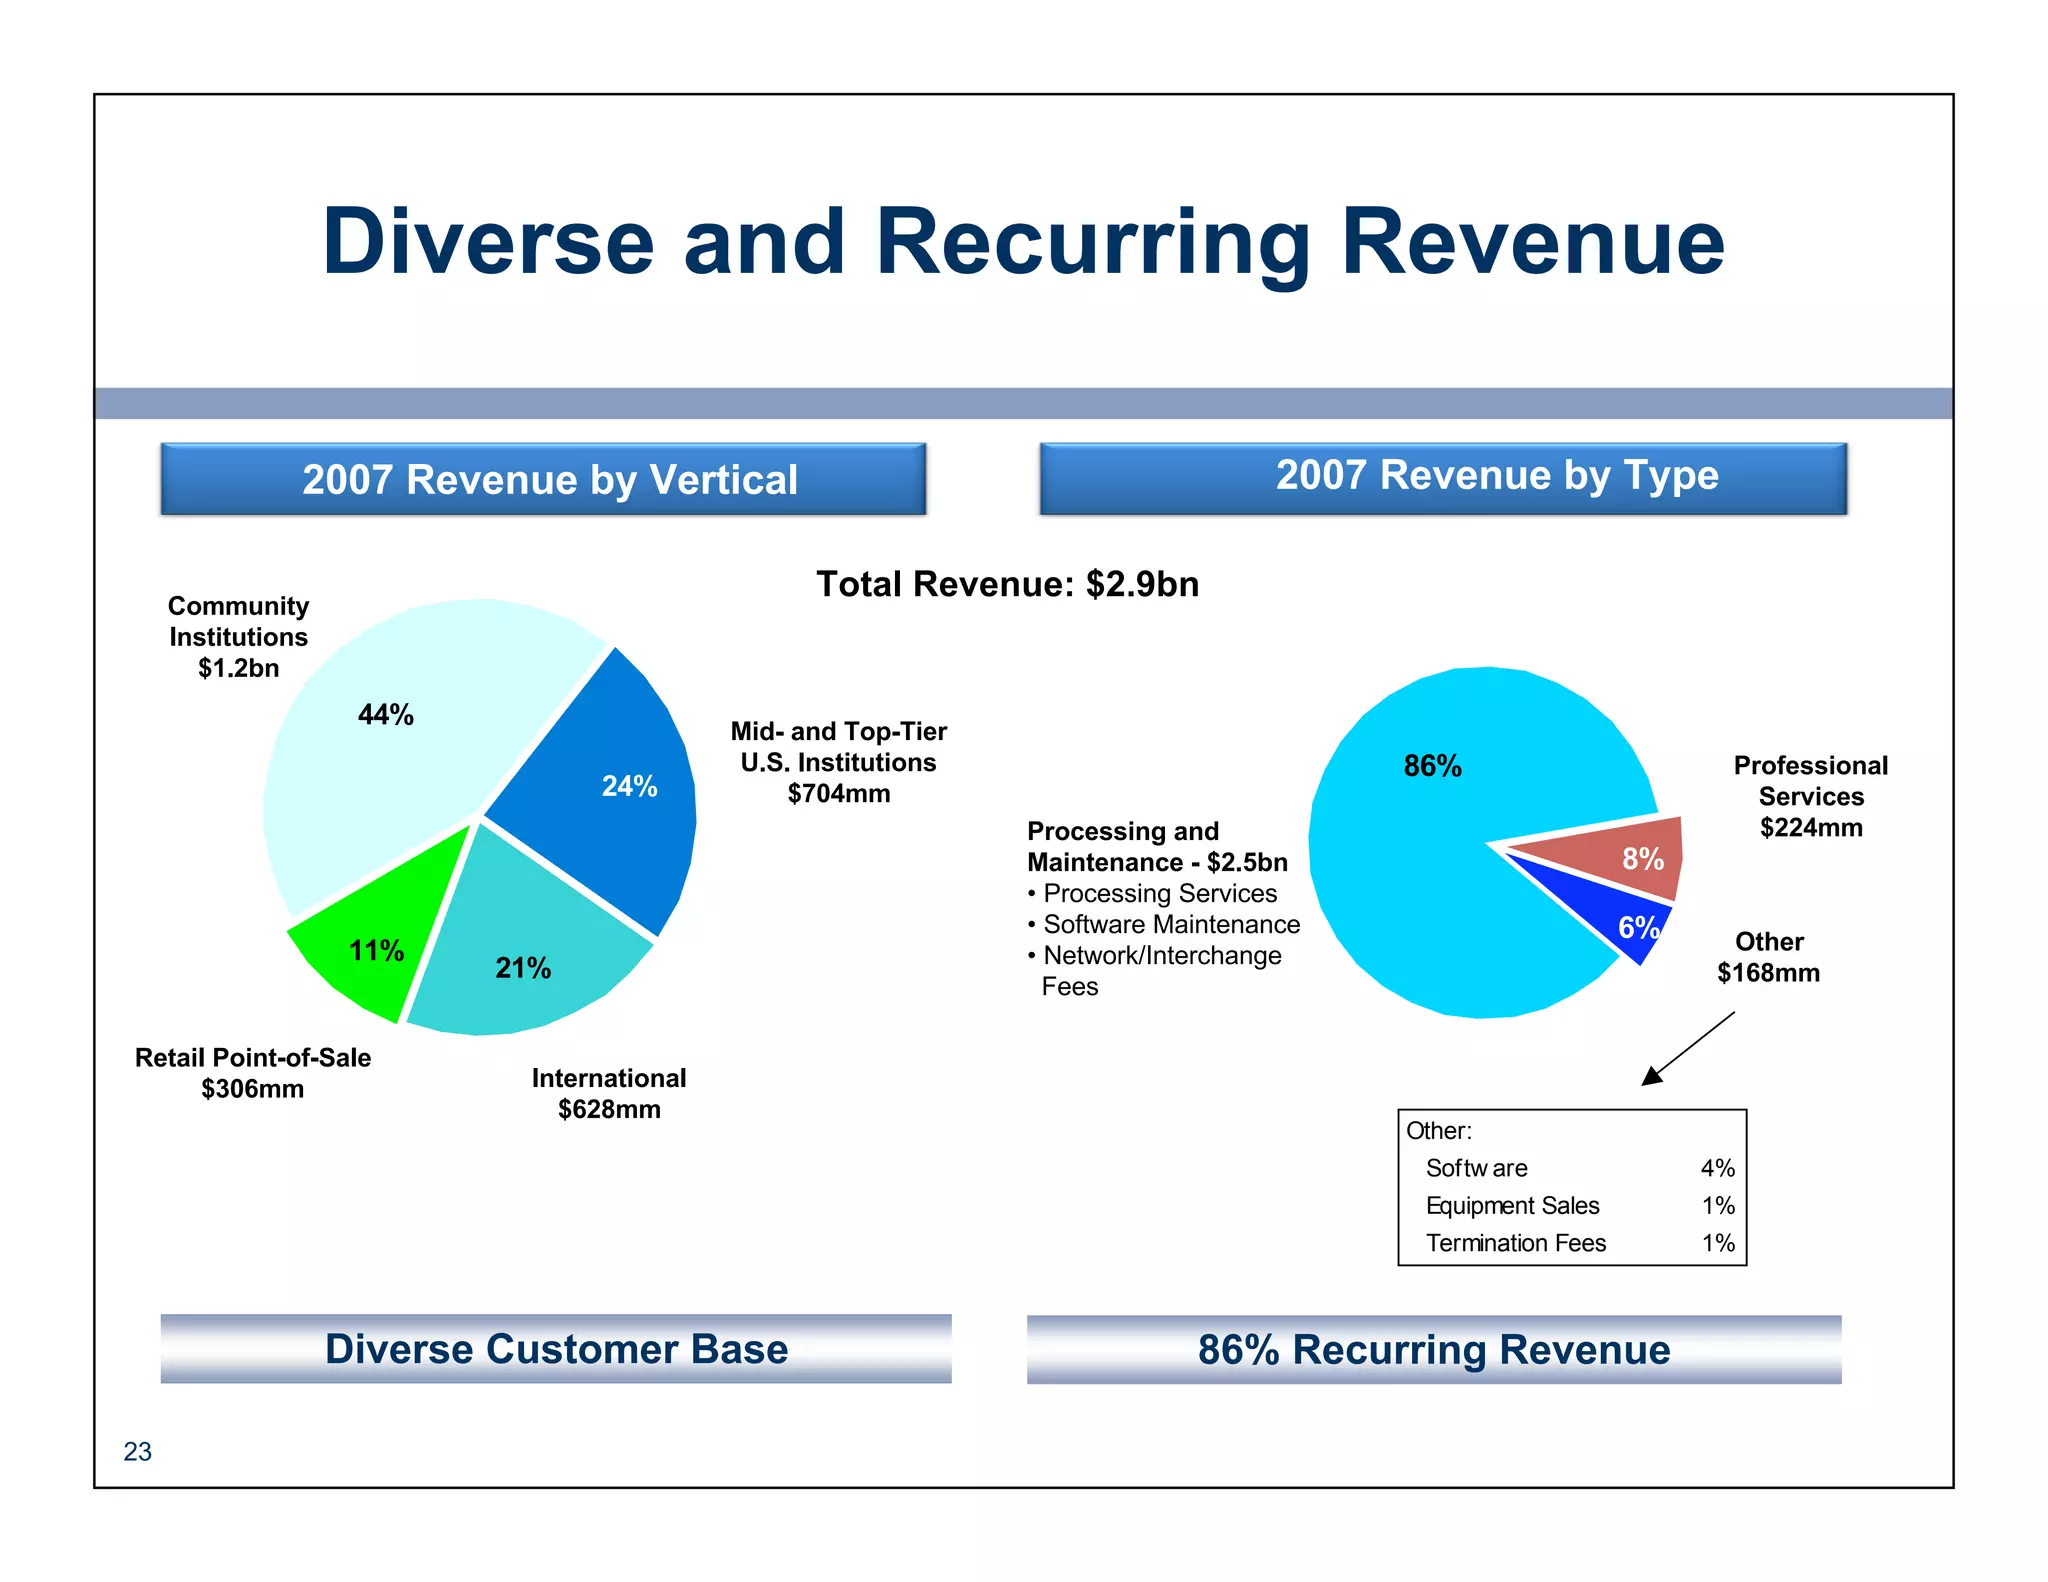
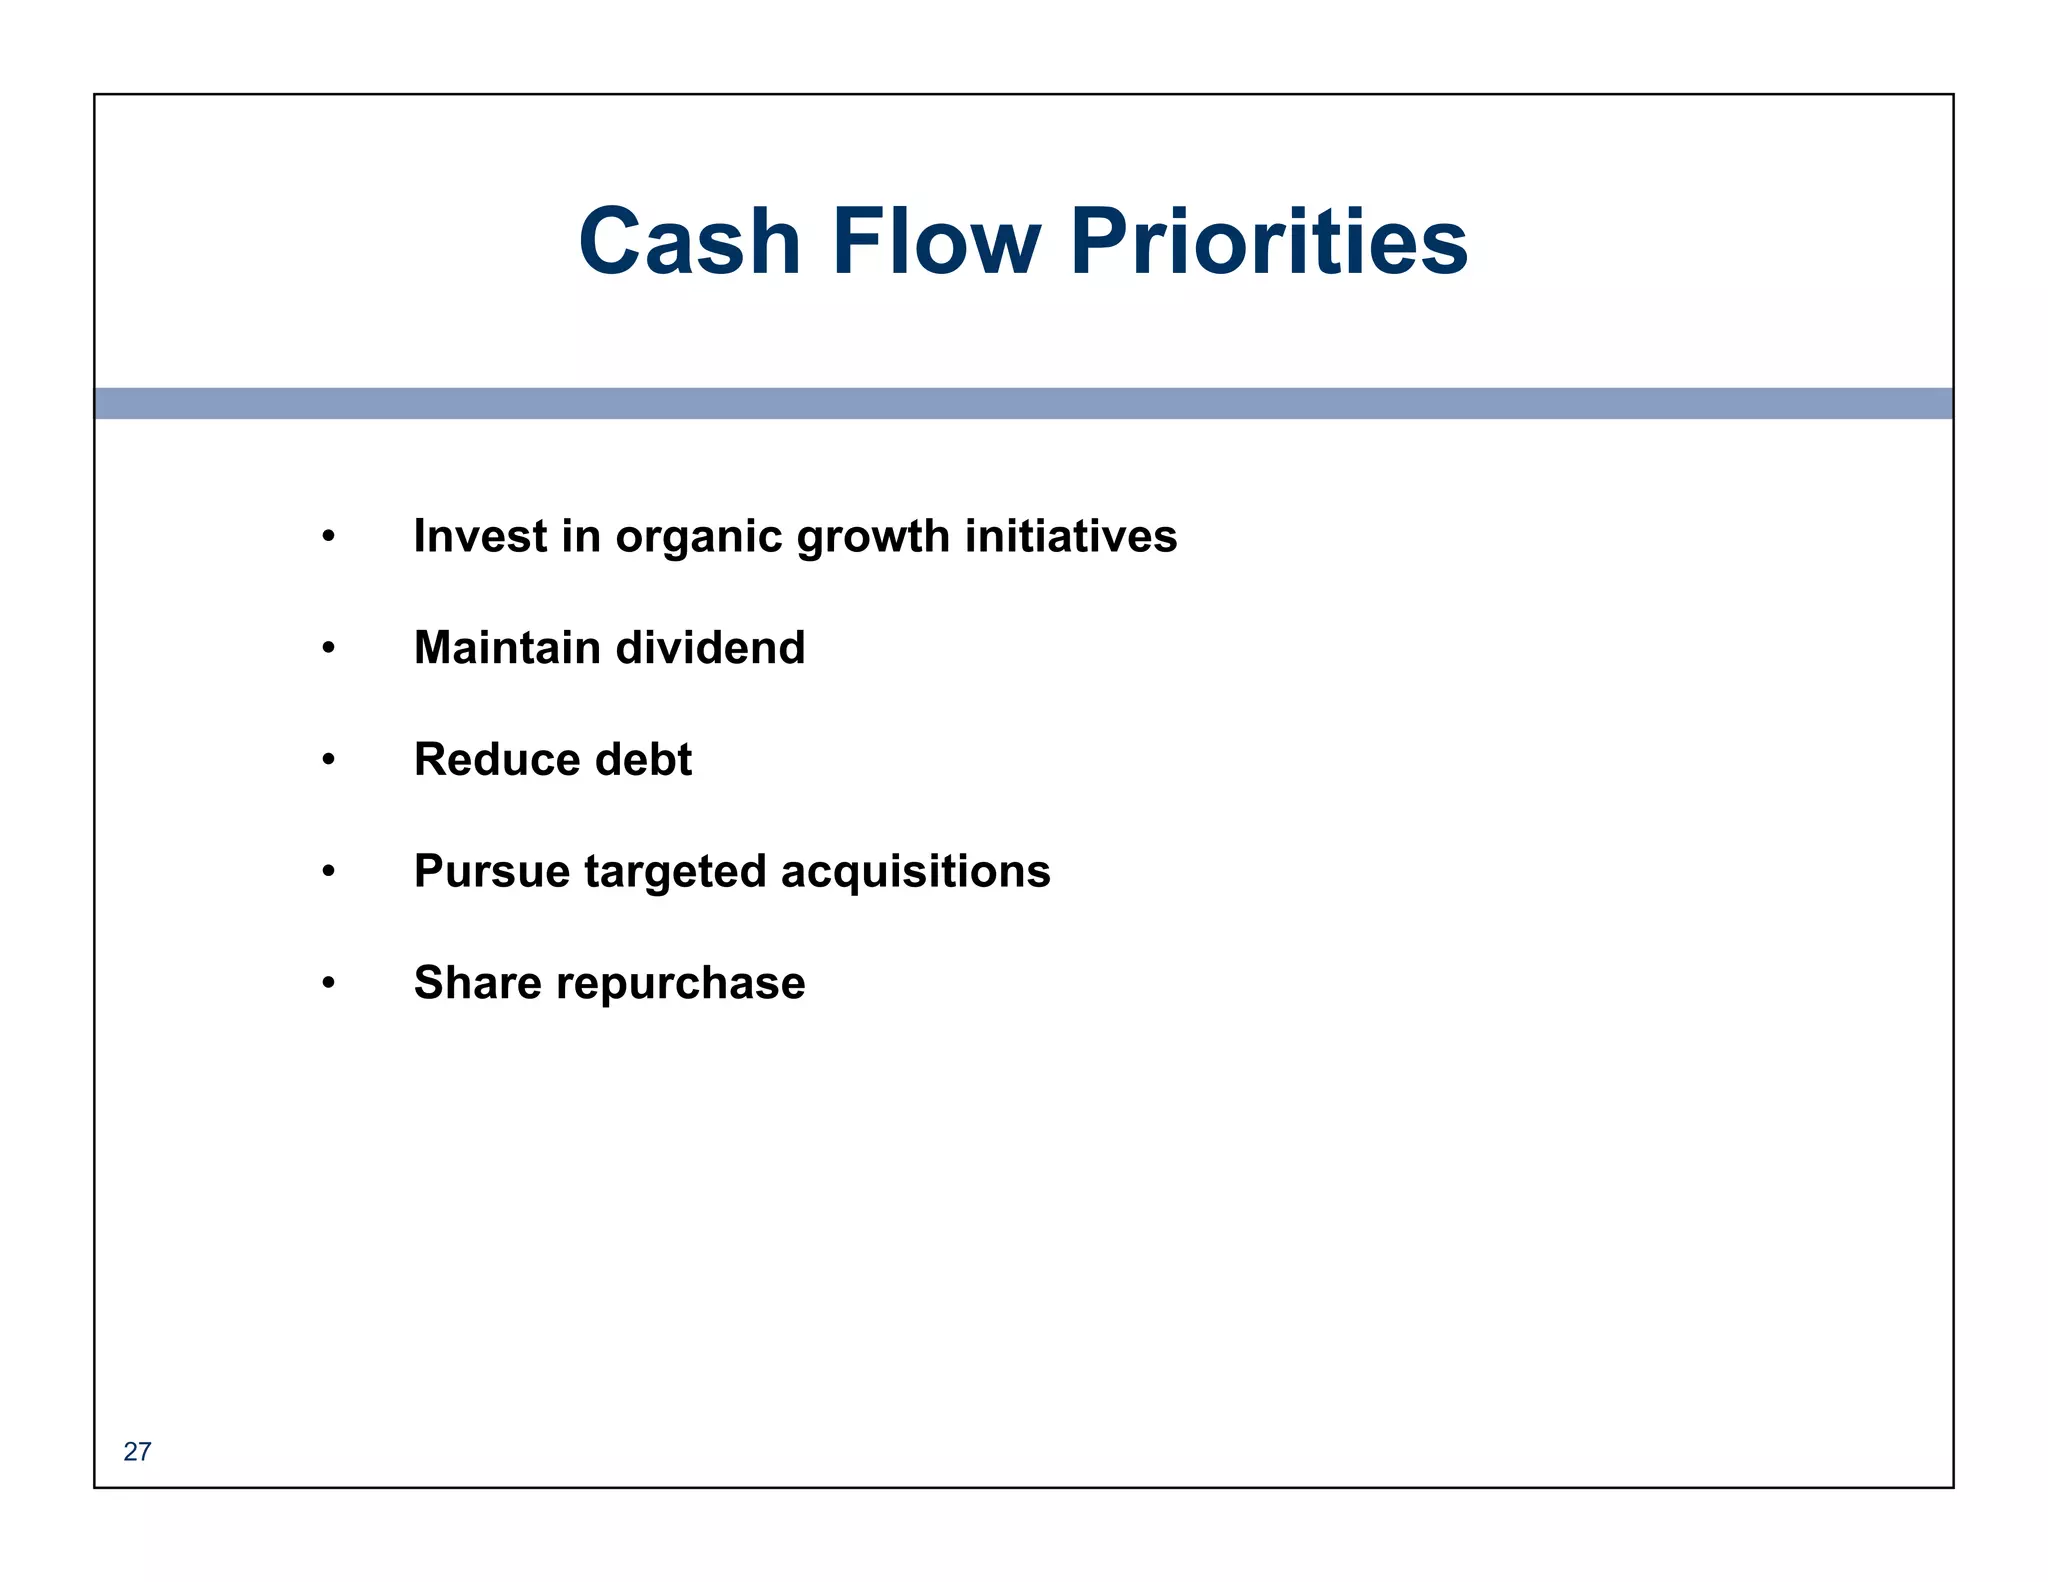
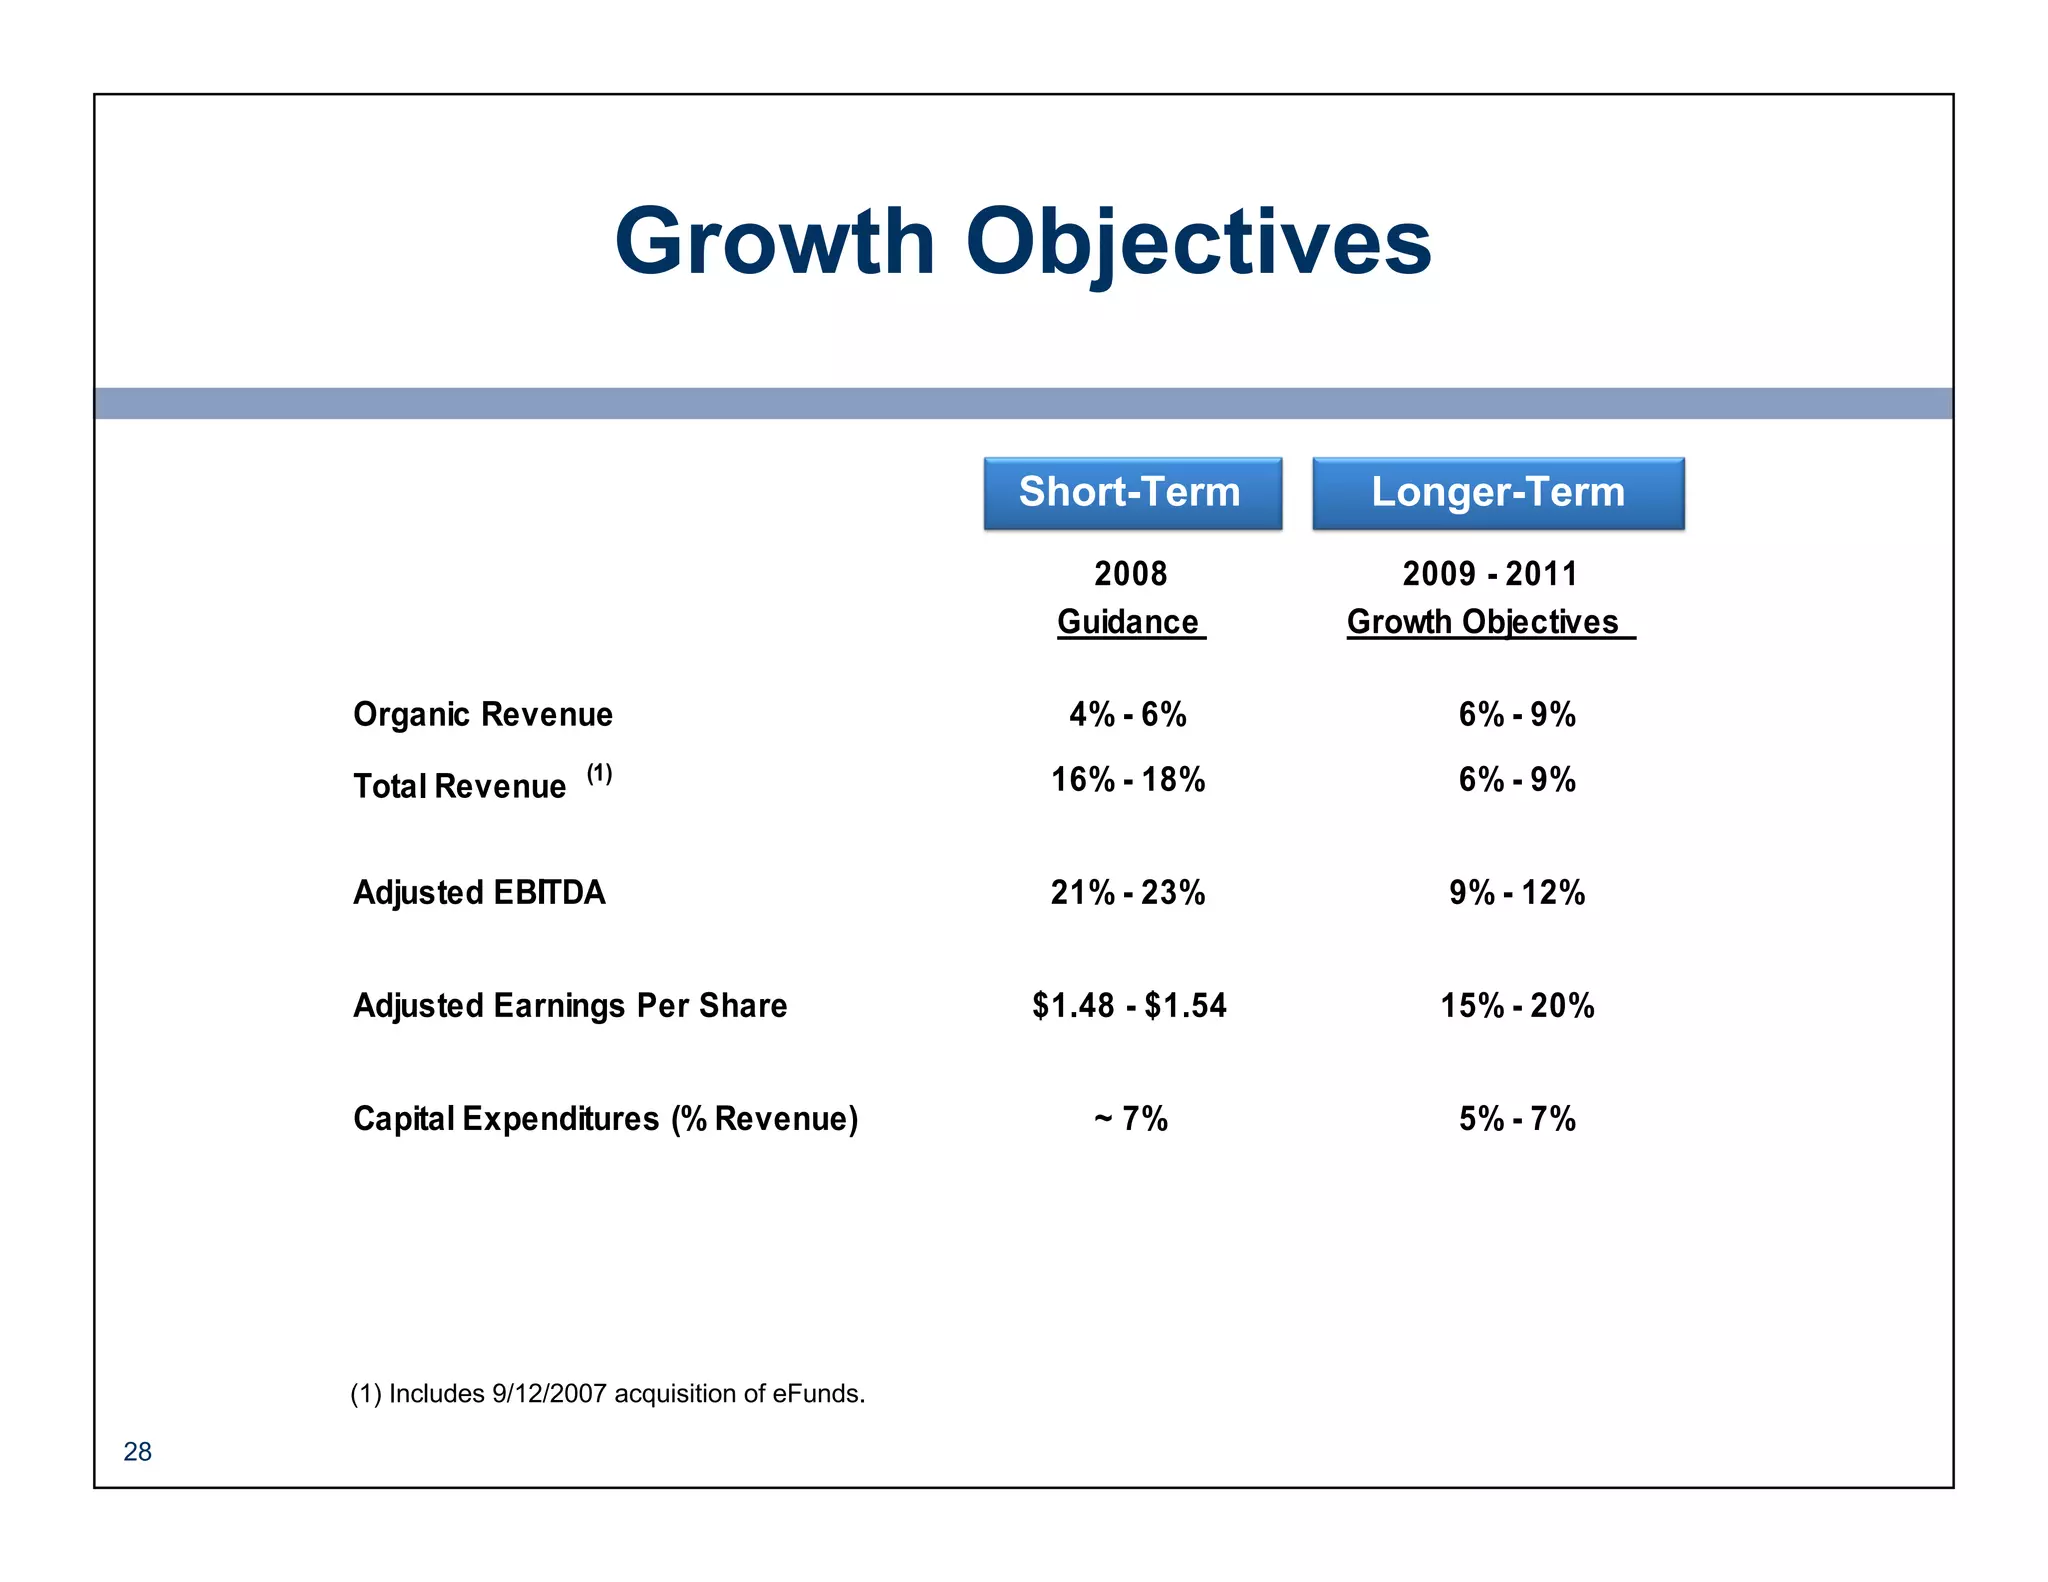
1) Fidelity National Information Services presented an investor presentation in June 2008 that discussed their planned spin-off of the Lender Processing Services segment. The spin-off was intended to create two pure play companies that could better focus resources and have improved investment profiles.
2) FIS overview highlighted their leadership in payments processing and core banking software, with $2.9 billion in annual revenues and significant scale across the US and international markets.
3) Financial highlights showed strong revenue growth, expanding margins, and increasing free cash flow that could be used to invest in growth, reduce debt, pursue acquisitions and return capital to shareholders.
2. Forward-Looking Statements
This presentation contains forward-looking statements that involve a number of risks and uncertainties.
Statements that are not historical facts, including statements about our beliefs and expectations, are forward-
looking statements. Forward-looking statements are based on management's beliefs, as well as assumptions made
by, and information currently available to, management. Because such statements are based on expectations as to
future economic performance and are not statements of fact, actual results may differ materially from those
projected. We undertake no obligation to update any forward-looking statements, whether as a result of new
information, future events or otherwise. The risks and uncertainties which forward-looking statements are subject
to include, but are not limited to: risks associated with the proposed spin-off of the Lender Processing Services
(LPS) segment by FIS, including the ability of FIS to contribute certain LPS assets and liabilities to the entity to be
spun off, the ability of LPS to obtain debt on acceptable terms and exchange that debt with certain holders of the
FIS debt, obtaining government approvals, obtaining FIS Board of Directors approval, market conditions for the
spin-off, and the risk that the spin-off will not be beneficial once accomplished, including as a result of unexpected
dis-synergies resulting from the separation or unfavorable reaction from customers, rating agencies or other
constituencies; changes in general economic, business and political conditions, including changes in the financial
markets; the effects of our substantial leverage (both at FIS prior to the spin-off and at the separate companies
after the spin-off), which may limit the funds available to make acquisitions and invest in our business; the risks of
reduction in revenue from the elimination of existing and potential customers due to consolidation in the banking,
retail and financial services industries; failures to adapt our services to changes in technology or in the
marketplace; adverse changes in the level of real estate activity, which would adversely affect certain of our
businesses; our potential inability to find suitable acquisition candidates or difficulties in integrating acquisitions;
significant competition that our operating subsidiaries face; the possibility that our acquisition of EFD/eFunds may
not be accretive to our earnings due to undisclosed liabilities, management or integration issues, loss of
customers, the inability to achieve targeted cost savings, or other factors; and other risks detailed in the
“Statement Regarding Forward-Looking Information,” “Risk Factors” and other sections of the Company’s Form
10-K and other filings with the Securities and Exchange Commission.
22
4. Spin-Off Transaction Overview
Description Rationale
• Unique and distinct businesses with different
• Announced plan to spin-off Lender Processing
customers, markets and management
Services (“LPS”) on 10/25/07
• FIS will contribute assets of its LPS business
into a newly formed subsidiary (“SpinCo”) in • Limited ability to leverage operations, technology
exchange for 100% of SpinCo common stock and product development
and ~$1.6bn of SpinCo debt
• Targeting effective date of July 1st
• Eliminates competing investment and resource
– Pro Forma FIS debt of $2.5bn needs
FIS • Pure play advantages and reduced complexity
Shareholders
• Improved ability for investors to optimize
holdings based on investment criteria
FIS SpinCo
FIS (TPS) LPS
Each Business Well-Positioned to Succeed
44
5. Strong Management Team
Lee A. Kennedy
President & CEO
Gary Norcross Frank Sanchez George Scanlon Ron Cook Mike Oates
Chief Operating Officer Strategic Development Chief Financial Officer General Counsel Human Resources
Services
Continuity of Management with
165 Years of Combined Industry Experience
55
6. FIS
Overview 2007 Revenue Breakdown
• 40 years of global market leadership in financial
technology services
• Leading market positions Payment Core
Processing
– Payment processing services Processing
37%
Services Services
– Core banking services
51%
– Risk management services
• Significant scale
– $2.9 billion in annual revenues
11%
– $724 million in Adjusted EBITDA¹
– 13,000+ financial institutions clients in over 80 Other
countries
– Over 23,000 employees
2007 Revenue: $2.9bn
• Broad geographic reach
• S&P 500 Stock Index
¹ Pro Forma for carve out and allocation of corporate expense
Focused Payments and Core Processing Company
66
8. Investment Highlights
Competitive Positioning Operating Model
• Stable and highly recurring
• Attractive global payment
revenue model
services and bank technology
markets
• Diversified customer base and
market segments
• Most comprehensive range of
industry specific integrated
• Strong organic growth through
products and services
international expansion and
cross selling to established
• Broad geographical range
client-base
• Experienced management team
• Significant opportunity for
margin expansion through scale
efficiencies and cost synergies
88
13. Most Integrated and Comprehensive
Products and Services
Core Payments Services
Core Decision Credit Card Debit Card Prepaid Card Item Internet IT/BPO Technology
Processing Solutions Processing Processing Processing Processing Banking/ Services
Bill Pay
FIS
FDC
FISV
JKHY
Temenos
TSYS
MV
Leadership Presence Limited/Not Served
13
13
14. Significant Processing Scale
• Domestic:
– 34 percent of all consumer debt
– 25 percent of all demand accounts
– 9 million+ credit card accounts
– 3.5 billion+ checks
– 8 million+ loyalty accounts
– 43 million+ debit cards and 18,000 ATMs
• International:
– 5 of the top 5 world banks
– 47 of the top 100 world banks
– More than 35 million cards
Across Six Domestic and Four International Technology Centers
14
14
15. Diverse Customer Base
Markets Served Asset Size of Largest Core Bank Customers
Markets Served
FIS has the Greatest Proven Scalability
15
15
18. Strong International Market Position
2007 International Revenue by Region
• Unique inventory of core banking assets
Asia Pacific
– Core bank processing & Other 18%
– Card issuer/acquiring services
Latin
– Risk management America
35%
EMEA
– Business process outsourcing 47%
• FIS scale and experience
• Active in established and emerging Total Revenue: $628mm
markets
Revenue growth
• Banking and card cross-sell opportunities
• Serving customers in more than 80 $750 R: 73%
07 CAG
2004-20
countries $500
$250
$0
2004 2005 2006 2007
Significant Competitive Presence Provides Comparative Advantage
18
18
19. Organization Aligned to Capture
Cross-Sell Opportunity
New Operating Model
• Operating objectives
– Accountability and ownership
– Product domain focus
– Entrepreneurialism within the business lines
– Increase sales of product and technology
assets across multiple market segments
Customer
– Eliminate redundant expenses across
divisions
– Decrease capital expenditures by eliminating
duplication across market segments Product
Development
• Announced November 2007 and fully implemented
in February 2008
Functionally Integrated Organization
19
19
20. Strategic Growth Drivers
Leverage Existing
Customer Relationships
Expand Addressable Market
Integrated Products and Delivery
Strategic Product Development
Disciplined Global Expansion
20
20
23. Diverse and Recurring Revenue
2007 Revenue by Type
2007 Revenue by Vertical
Total Revenue: $2.9bn
Community
Institutions
$1.2bn
44%
Mid- and Top-Tier
U.S. Institutions 86% Professional
24% $704mm Services
$224mm
Processing and
8%
Maintenance - $2.5bn
• Processing Services
• Software Maintenance 6% Other
11% • Network/Interchange
21% $168mm
Fees
Retail Point-of-Sale
International
$306mm
$628mm
Other:
Softw are 4%
Equipment Sales 1%
Termination Fees 1%
Diverse Customer Base 86% Recurring Revenue
23
23
29. Investment Highlights
Competitive Positioning Operating Model
• Stable and highly recurring
• Attractive global payment
revenue model
services and bank technology
markets
• Diversified customer base and
market segments
• Most comprehensive range of
industry specific integrated
• Strong organic growth through
products and services
international expansion and
cross selling to established
• Broad geographical range
client-base
• Continuity of experienced
• Significant opportunity for
management team
margin expansion through scale
efficiencies and cost synergies
29
29
31. Use of Non-GAAP Measures
FIS reports several non -GAAP measures, including earnings before interest,
taxes, depreciation and amortization (“EBITDA”) and adjusted net earnings.
The adjusted results exclude the after -tax impact of merger and acquisition
and integration expenses, ce rtain stock compensation charges, debt
restructuring and other costs, gains (losses) on the sale of certain non -
strategic assets and acquisition related amortization. Any non -GAAP
measures should be considered in context with the GAAP financial
presentat ion and should not be considered in isolation or as a substitute for
GAAP net earnings. A reconciliation of these non -GAAP measures to related
GAAP measures is incl uded in the FIS earnings press release dated April 28,
2008, for the quarter ended March 31 , 2008, and in the following
supplemental schedules .
31 31
31
32. Adjustments to 2007 Results of Operations
“TPS” and “LPS” represent the historical Transaction Processing
Services and Lender Processing Services operating segments within FIS
Non- Net Free
Revenue EBIT DA EBIT Operating Pre-tax Earnings Cash Flow (1)
Non-GAAP Adjustments:
Eliminate TPS Non-GAAP Items & Adjust Working Capital $0.0 $4.6 $18.1 $1.0 $19.1 $12.1 $51.5
Eliminate LPS Non-GAAP Items & Adjust Working Capital - 6.8 7.9 - 7.9 5.0 5.0
Eliminate Corporate Non-GAAP Items & Adjust Working Capital - 2.8 2.8 (330.0) (327.3) (206.2) 145.9
Total Non-GAAP Adjustm ents – Historical FIS $0.0 $14.2 $28.8 ($329.0) ($300.3) ($189.2) $202.4
Carveout Adjustments:
Transfer Managed Ops Contracts to TPS $45.6 $7.0 $6.5 $0.0 $6.5 $4.1 $0.0
Transfer Technology Depreciation to TPS - 30.6 - - - - -
Transfer Technology Ops to TPS - (16.9) (16.9) - (16.9) (10.7) -
Allocate Interest Expense to LPS - - - 91.0 91.0 55.8 55.8
Total Carveout Adjustm ents – New FIS $45.6 $20.7 ($10.4) $91.0 $80.6 $49.3 $55.8
(1) Adjustments to free cash flow primarily represent the payment of tax liabilities associated with the disposition of non-strategic investments,
as well as the after-tax impact of non-recurring integration costs. Refer to page 36 of this presentation and Exhibit F of the first quarter 2008
earnings release for additional details.
32
32
34. 2007 Income Statement Reconciliation
(2 of 2)
Historical
TPS LPS Corp FIS
Net Earnings:
Net Earnings (1) $310.9 $250.3 - $561.2
Non-GAAP adj, net of tax (189.2) - - (189.2)
Carveout adj, net of tax 49.3 (49.3) - -
Pro Forma $171.0 $201.0 - $372.0
Adjusted Earnings:
Adjusted Earnings (1) $391.0 $276.4 - $667.4
Non-GAAP adj, net of tax (189.2) - - (189.2)
Carveout adj, net of tax 49.3 (49.3) - -
Pro Forma $251.1 $227.1 - $478.2
Adjusted EPS – Diluted
Adjusted EPS - Diluted (1) $2.01 $1.41 - $3.40
Non-GAAP adj (0.96) - - (0.96)
Carveout 0.25 (0.25) - -
Pro Forma $1.30 $1.16 - $2.44
Free Cash Flow:
Free Cash Flow (1) ($92.2) $212.4 - $120.3
Non-GAAP adj, net of tax 202.4 - - 202.4
Carveout adj, net of tax 55.8 (55.8) - -
Pro Forma $166.0 $156.6 - $322.6
(2)
(1)
• Earnings by operating segment have not been previously disclosed. These results reflect the allocation of
the corporate segment to the TPS and LPS operating segments.
• Reflects free cash flow for LPS as included in the Company's Form 10 for year ended December 31, 2007,
(2)
adjusted to include a pro forma allocation of interest expense.
34
34
35. 2007 EBITDA Margin
Pro Forma FIS
Revenue EBITDA EBITDA %
2007 TPS, excluding charges $ 2,888.7 $ 759.0 26.3%
Carve out adjustments:
Transfer of managed operations contract 45.6 7.0 -0.2%
Transfer technology depreciation - 30.6 1.1%
Transfer technology operations (16.9) -0.6%
(1)
Corporate allocation - leasing contracts 11.8 11.4 0.3%
Corporate expense allocation - (67.5) -2.3%
2007 pro forma FIS, as adjusted $ 2,946.1 $ 723.6 24.6%
(1) Leasing contracts sold 9/30/07
35
35
36. Free Cash Flow Reconciliation
(in millions)
2007 Pro Forma,
Historical FIS as adjusted
2007 as Less: Non- 2007 Non- Less: LPS New
Reported GAAP adj GAAP Carveout FIS
Net Earnings $ 561.2 $ 167.8 $ 729.0 $ (201.0) $ 528.0
(1)
Add: D&A 496.8 (14.6) 482.2 (102.6) 379.6
(2)
Other, net (594.5) 49.2 (545.3) 76.4 (468.9)
(3)
Cash flow from operations 463.6 202.4 665.9 (227.2) 438.7
Capital expenditures (343.3) - (343.3) 70.6 (272.7)
Net free cash flow $ 120.3 $ 202.4 $ 322.6 $ (156.6) $ 166.0
Eliminate tax liabilities associated with disposition of non-strategic assets (Covansys stock, Property Insight) –
(1)
$145.6 million and after-tax impact of non-recurring integration costs – $7.8 million.
Eliminate depreciation and amortization primarily associated with non-strategic assets.
(2)
Adjustments to working capital reflect elimination of settlement of various acquisition related liabilities.
(3)
36
36
37. 2008 Outlook
New FIS
FIS 2007
Pro Forma, Estimated 2008
(in millions, except per share amounts) as adjusted Low High
Revenue $ 2,946 16.0% – 18.0%
(1)
Adjusted EBITDA, excluding other costs 724 21.5% – 23.5%
D&A 373 425 425
Interest expense and other, net 106 145 145
Minority interest expense (income) (3) 5 5
(2) (2)
Acquisition related amortization, net of tax 80 89 89
Adjusted Net Earnings - continuing operations 242 287 299
Adjusted Net Earnings Per Share - continuing operations $ 1.23 $ 1.48 $ 1.54
Estim a te d 2008
Q1 Q2 Q3 Q4 2008
(1)
Me rge r & inte gra tion costs, ne t of ta x $ 10 $ 2 $ 1 $ 1 $ 13
LPS spin-off costs, ne t of ta x 2 13 - - 15
Re structuring costs, ne t of ta x - 7 - - 7
$ 11 $ 22 $ 1 $ 1 $ 35
(2)
Acquistion re la te d a m ortiza tion, ne t of ta x $ 23 $ 23 $ 22 $ 21 $ 89
37
37
38. 2008 Estimated Revenue
New FIS
2007 2008 Growth Excluding
eFunds (2)
Pro Forma Low High
IFS $ 1,254.3 20% 22%
(1)
EBS 1,010.6 11% 13%
Int'l 628.5 22% 24%
Other (4.8) -25% -25%
As reported 2,888.7 17% 19% 4% - 6%
Carve out adjustment 45.6 -4% -4%
Leasing contracts (3) 11.8 -100% -100%
As adjusted $ 2,946.1 16% 18%
(1)
EBS growth would approximate 20% excluding Retail POS Check Services
(2)
eFunds acquisition completed 9/12/07
(3)
Leasing contracts sold 9/30/07
38
38
39. Estimated Free Cash Flow
New FIS
2007 Pro Forma 2008 Estimated
as adjusted New FIS
Low High
(1,2)
Net Earnings $ 528.0 $ 196.0 $ 208.0
Add: D&A 379.6 425.0 425.0
Other, net (468.9) (56.0) (48.0)
Cash flow from operations $ 438.7 565.0 585.0
(3)
Capital expenditures (272.7) (250.0) (240.0)
Net free cash flow $ 166.0 $ 315.0 $ 345.0
Refer to page 36 for reconciliation of GAAP to non-GAAP free cash flow.
(1)
(2) Excludes acquisition related integration costs and restructuring expense.
(3) Includes PP&E, purchased software, capitalized software and approximately
$25 million for eFunds integration capital.
39
39