
Download as PDF, PPTX


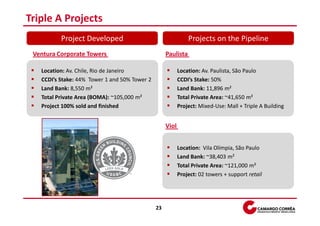


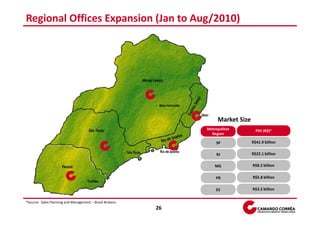


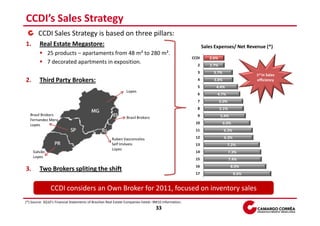


This document provides an overview of Camargo Corrêa Desenvolvimento Imobiliário (CCDI), a Brazilian real estate development company. CCDI operates in multiple market segments, including low-income, traditional, and luxury ("Triple A") projects. In 2010, CCDI accelerated its growth, launching 27 projects with over 8,000 units and R$1.5 billion in potential sales value. CCDI also expanded regionally, with new offices launching projects in Rio de Janeiro, Espírito Santo, Minas Gerais, and Paraná. Going forward, CCDI aims to continue growing its operations while maintaining a focus on costs, innovation, and client satisfaction.


